Association & Correlation Coefficients (College Board AP® Statistics): Study Guide

Association
What is an association?
An association between two variables means that the variables are related to each other in some particular way
A change in one variable corresponds to a change in the other
It is possible for two variables to have no association
A change in one variable does not correspond to a change in the other
What is the direction of an association?
If an association exists, it can have different directions:
Positive association is when one variable increases, the other tends to increase
For example, as temperature increases, sales of cold drinks tend to increase
Negative association is when one variable increases, the other tends to decrease
For example, increasing the age of a car tends to decrease its value
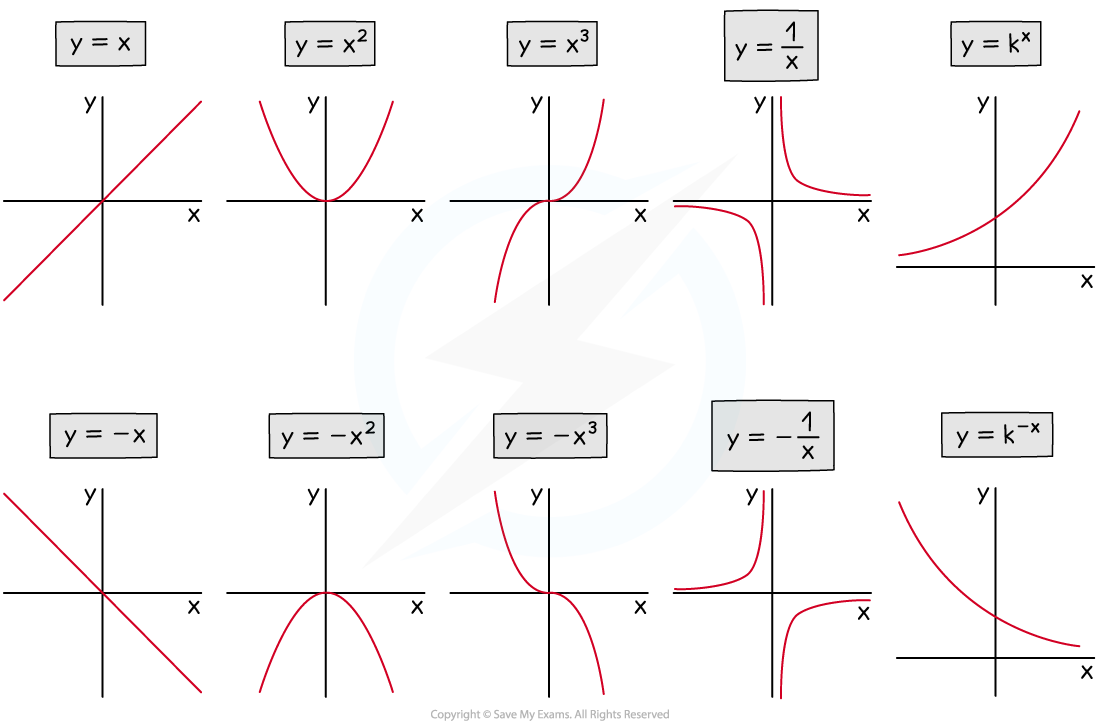
What is the form of an association?
Having a positive or negative association does not mean the association is linear (a straight line)
There are many different forms an association could take, for example:
Linear forms follow straight lines
Non-linear forms follow curved lines, including:
quadratics and cubics
reciprocals, e.g.
format('truetype')%3Bfont-weight%3Anormal%3Bfont-style%3Anormal%3B%7D%3C%2Fstyle%3E%3C%2Fdefs%3E%3Ctext%20font-family%3D%22Times%20New%20Roman%22%20font-size%3D%2218%22%20font-style%3D%22italic%22%20text-anchor%3D%22middle%22%20x%3D%224.5%22%20y%3D%2230%22%3Ey%3C%2Ftext%3E%3Ctext%20font-family%3D%22math17f39f8317fbdb1988ef4c628eb%22%20font-size%3D%2216%22%20text-anchor%3D%22middle%22%20x%3D%2218.5%22%20y%3D%2230%22%3E%3D%3C%2Ftext%3E%3Cline%20stroke%3D%22%23000000%22%20stroke-linecap%3D%22square%22%20stroke-width%3D%221%22%20x1%3D%2229.5%22%20x2%3D%2242.5%22%20y1%3D%2223.5%22%20y2%3D%2223.5%22%2F%3E%3Ctext%20font-family%3D%22Times%20New%20Roman%22%20font-size%3D%2218%22%20text-anchor%3D%22middle%22%20x%3D%2236.5%22%20y%3D%2216%22%3E1%3C%2Ftext%3E%3Ctext%20font-family%3D%22Times%20New%20Roman%22%20font-size%3D%2218%22%20font-style%3D%22italic%22%20text-anchor%3D%22middle%22%20x%3D%2235.5%22%20y%3D%2241%22%3Ex%3C%2Ftext%3E%3C%2Fsvg%3E)
exponentials, e.g.
format('truetype')%3Bfont-weight%3Anormal%3Bfont-style%3Anormal%3B%7D%3C%2Fstyle%3E%3C%2Fdefs%3E%3Ctext%20font-family%3D%22Times%20New%20Roman%22%20font-size%3D%2218%22%20font-style%3D%22italic%22%20text-anchor%3D%22middle%22%20x%3D%224.5%22%20y%3D%2217%22%3Ey%3C%2Ftext%3E%3Ctext%20font-family%3D%22math17f39f8317fbdb1988ef4c628eb%22%20font-size%3D%2216%22%20text-anchor%3D%22middle%22%20x%3D%2218.5%22%20y%3D%2217%22%3E%3D%3C%2Ftext%3E%3Ctext%20font-family%3D%22Times%20New%20Roman%22%20font-size%3D%2218%22%20text-anchor%3D%22middle%22%20x%3D%2231.5%22%20y%3D%2217%22%3E2%3C%2Ftext%3E%3Ctext%20font-family%3D%22Times%20New%20Roman%22%20font-size%3D%2213%22%20font-style%3D%22italic%22%20text-anchor%3D%22middle%22%20x%3D%2239.5%22%20y%3D%2212%22%3Ex%3C%2Ftext%3E%3C%2Fsvg%3E)
What is the strength of an association?
The strength of an association is how well the data points on a scatterplot follow the form of the association
Strengths are described as either strong, moderate or weak
The stronger the strength, the more closely data points follow the form
e.g. data points may show a 'weak quadratic' association
What are unusual features of a scatterplot?
Unusual features of a scatterplot include
clusters
where data points appear to be in groups (clouds)
outliers
data points that do not appear to fit the general pattern shown
Examiner Tips and Tricks
In the exam, if asked to describe the relationship shown on a scatterplot, you should comment in context on the direction (positive, negative, none), form (linear, non-linear) and strength (strong, moderate, weak) of an association, as well as any unusual features (clusters, outliers).
Worked Example
Describe the relationship shown between the hours spent on a phone per day and the hours spent on a computer per day for nine students in a class, shown on the scatterplot below.

Answer:
You must comment on the strength, direction and form of the association seen
You must also comment on unusual features, in particular outliers and clusters
Remember to give your answer in context
The scatterplot reveals a strong, negative, roughly linear association between the hours spent on a phone per day and the hours spent on a computer per day for the nine students in the class
There are no significant outliers, though there is a slight clustering of points into two clusters (top left, between 1 and 3 hours on a phone per day, and bottom right, between 5 and 9 hours on a phone per day)
Correlation coefficients
What is correlation?
Correlation is a numerical measure of the direction and strength of a linear association between two variables

What is the correlation coefficient?
The correlation coefficient,
 , is a value between -1 and 1 where
format('truetype')%3Bfont-weight%3Anormal%3Bfont-style%3Anormal%3B%7D%3C%2Fstyle%3E%3C%2Fdefs%3E%3Ctext%20font-family%3D%22Times%20New%20Roman%22%20font-size%3D%2218%22%20font-style%3D%22italic%22%20text-anchor%3D%22middle%22%20x%3D%223.5%22%20y%3D%2216%22%3Er%3C%2Ftext%3E%3Ctext%20font-family%3D%22math17f39f8317fbdb1988ef4c628eb%22%20font-size%3D%2216%22%20text-anchor%3D%22middle%22%20x%3D%2215.5%22%20y%3D%2216%22%3E%3D%3C%2Ftext%3E%3Ctext%20font-family%3D%22Times%20New%20Roman%22%20font-size%3D%2218%22%20text-anchor%3D%22middle%22%20x%3D%2228.5%22%20y%3D%2216%22%3E1%3C%2Ftext%3E%3C%2Fsvg%3E) means a perfect positive linear association
means a perfect positive linear associationAll points lie along the same straight line with a positive slope
format('truetype')%3Bfont-weight%3Anormal%3Bfont-style%3Anormal%3B%7D%3C%2Fstyle%3E%3C%2Fdefs%3E%3Ctext%20font-family%3D%22Times%20New%20Roman%22%20font-size%3D%2218%22%20font-style%3D%22italic%22%20text-anchor%3D%22middle%22%20x%3D%223.5%22%20y%3D%2216%22%3Er%3C%2Ftext%3E%3Ctext%20font-family%3D%22math17f39f8317fbdb1988ef4c628eb%22%20font-size%3D%2216%22%20text-anchor%3D%22middle%22%20x%3D%2215.5%22%20y%3D%2216%22%3E%3D%3C%2Ftext%3E%3Ctext%20font-family%3D%22Times%20New%20Roman%22%20font-size%3D%2218%22%20text-anchor%3D%22middle%22%20x%3D%2228.5%22%20y%3D%2216%22%3E0%3C%2Ftext%3E%3C%2Fsvg%3E) means no linear association
means no linear associationformat('truetype')%3Bfont-weight%3Anormal%3Bfont-style%3Anormal%3B%7D%3C%2Fstyle%3E%3C%2Fdefs%3E%3Ctext%20font-family%3D%22Times%20New%20Roman%22%20font-size%3D%2218%22%20font-style%3D%22italic%22%20text-anchor%3D%22middle%22%20x%3D%223.5%22%20y%3D%2216%22%3Er%3C%2Ftext%3E%3Ctext%20font-family%3D%22math143f4d31b04031e49f5eb18baba%22%20font-size%3D%2216%22%20text-anchor%3D%22middle%22%20x%3D%2215.5%22%20y%3D%2216%22%3E%3D%3C%2Ftext%3E%3Ctext%20font-family%3D%22math143f4d31b04031e49f5eb18baba%22%20font-size%3D%2216%22%20text-anchor%3D%22middle%22%20x%3D%2232.5%22%20y%3D%2216%22%3E%26%23x2212%3B%3C%2Ftext%3E%3Ctext%20font-family%3D%22Times%20New%20Roman%22%20font-size%3D%2218%22%20text-anchor%3D%22middle%22%20x%3D%2245.5%22%20y%3D%2216%22%3E1%3C%2Ftext%3E%3C%2Fsvg%3E) means a perfect negative linear association
means a perfect negative linear associationAll points lie along the same straight line with a negative slope
Values in between can be described as weak, moderate or strong
e.g.
format('truetype')%3Bfont-weight%3Anormal%3Bfont-style%3Anormal%3B%7D%3C%2Fstyle%3E%3C%2Fdefs%3E%3Ctext%20font-family%3D%22Times%20New%20Roman%22%20font-size%3D%2218%22%20font-style%3D%22italic%22%20text-anchor%3D%22middle%22%20x%3D%223.5%22%20y%3D%2216%22%3Er%3C%2Ftext%3E%3Ctext%20font-family%3D%22math11824c643d1feb4da18b28ed527%22%20font-size%3D%2216%22%20text-anchor%3D%22middle%22%20x%3D%2215.5%22%20y%3D%2216%22%3E%3D%3C%2Ftext%3E%3Ctext%20font-family%3D%22Times%20New%20Roman%22%20font-size%3D%2218%22%20text-anchor%3D%22middle%22%20x%3D%2228.5%22%20y%3D%2216%22%3E0%3C%2Ftext%3E%3Ctext%20font-family%3D%22math11824c643d1feb4da18b28ed527%22%20font-size%3D%2216%22%20text-anchor%3D%22middle%22%20x%3D%2235.5%22%20y%3D%2216%22%3E.%3C%2Ftext%3E%3Ctext%20font-family%3D%22Times%20New%20Roman%22%20font-size%3D%2218%22%20text-anchor%3D%22middle%22%20x%3D%2242.5%22%20y%3D%2216%22%3E9%3C%2Ftext%3E%3C%2Fsvg%3E) is a 'strong positive linear' association
is a 'strong positive linear' associationPoints appear to roughly follow a straight line with a positive slope

What is the formula for the correlation coefficient?
For
 data points with coordinates
 format('truetype')%3Bfont-weight%3Anormal%3Bfont-style%3Anormal%3B%7D%40font-face%7Bfont-family%3A'round_brackets22549f92a457f2409'%3Bsrc%3Aurl(data%3Afont%2Ftruetype%3Bcharset%3Dutf-8%3Bbase64%2CAAEAAAAMAIAAAwBAT1MvMjxkLiAAAADMAAAATmNtYXDf7xCrAAABHAAAADxjdnQgBAkDLgAAAVgAAAASZ2x5Zr5a4R4AAAFsAAABKWhlYWQO9ymoAAACmAAAADZoaGVhDVUVZQAAAtAAAAAkaG10eCFnAAIAAAL0AAAADGxvY2EAAARdAAADAAAAABBtYXhwBIgEWQAAAxAAAAAgbmFtZXHO2TgAAAMwAAACOXBvc3QEagIzAAAFbAAAACBwcmVwupWEAAAABYwAAAAHAAAGrgGQAAUAAAgACAAAAAAACAAIAAAAAAAAAQIAAAAAAAAAAAAAAAAAAAAAAAAAAAAAAAAAAAAAACAgICAAAAAo8AMGe%2F57AAAIzgIPAAAAAAACAAEAAQAAABQAAwABAAAAFAAEACgAAAAGAAQAAQACACgAKf%2F%2FAAAAKAAp%2F%2F%2F%2F2f%2FZAAEAAAAAAAAAAAFUAFYBAAAsAKgDgAAyAAcAAAACAAAAKgDVA1UAAwAHAAA1MxEjEyMRM9XVq4CAKgMr%2FQAC1QABAAD%2BYAJQCGAACQBNGAGwChCwA9SwAxCwAtSwChCwBdSwBRCwANSwAxCwBzywAhCwCDwAsAoQsAPUsAMQsAfUsAoQsAXUsAoQsADUsAMQsAI8sAcQsAg8MTATAgEzABMQASMABAQBwJD%2BPAQBwJD%2BRANg%2FHD%2BkAFwA5ADoAFg%2FqAAAQAA%2FmACUAhgAAkATRgBsAoQsAPUsAMQsALUsAoQsAXUsAUQsADUsAMQsAc8sAIQsAg8ALAKELAD1LADELAH1LAKELAF1LAKELAA1LADELACPLAHELAIPDEwARIBIwADEAEzAAJMBP5AkAHEBP5AkAG8A2D8cP6QAXADkAOgAWD%2BoAAAAAABAAAAAQAALiwXwl8PPPUAAwgA%2F%2F%2F%2F%2F9Wt7vT%2F%2F%2F%2F%2F1a3u9AAA%2FmAEhAhgAAAACgACAAEAAAAAAAEAAAjO%2FfEAABdwAAD%2F%2FgSEAAEAAAAAAAAAAAAAAAAAAAADANUAAAJQAAACUAAAAAAAAAAAACQAAACmAAABKQABAAAAAwAKAAIAAAAAAAIAgAQAAAAAAAQAAE0AAAAAAAAAFQECAAAAAAAAAAEAPgAAAAAAAAAAAAIADgA%2BAAAAAAAAAAMAXABMAAAAAAAAAAQAPgCoAAAAAAAAAAUAFgDmAAAAAAAAAAYAHwD8AAAAAAAAAAgAHAEbAAEAAAAAAAEAPgAAAAEAAAAAAAIADgA%2BAAEAAAAAAAMAXABMAAEAAAAAAAQAPgCoAAEAAAAAAAUAFgDmAAEAAAAAAAYAHwD8AAEAAAAAAAgAHAEbAAMAAQQJAAEAPgAAAAMAAQQJAAIADgA%2BAAMAAQQJAAMAXABMAAMAAQQJAAQAPgCoAAMAAQQJAAUAFgDmAAMAAQQJAAYAHwD8AAMAAQQJAAgAHAEbAFIAbwB1AG4AZAAgAGIAcgBhAGMAawBlAHQAcwAgAHcAaQB0AGgAIABhAHMAYwBlAG4AdAAgADIAMgA1ADQAUgBlAGcAdQBsAGEAcgBNAGEAdABoAHMAIABGAG8AcgAgAE0AbwByAGUAIABSAG8AdQBuAGQAIABiAHIAYQBjAGsAZQB0AHMAIAB3AGkAdABoACAAYQBzAGMAZQBuAHQAIAAyADIANQA0AFIAbwB1AG4AZAAgAGIAcgBhAGMAawBlAHQAcwAgAHcAaQB0AGgAIABhAHMAYwBlAG4AdAAgADIAMgA1ADQAVgBlAHIAcwBpAG8AbgAgADIALgAwUm91bmRfYnJhY2tldHNfd2l0aF9hc2NlbnRfMjI1NABNAGEAdABoAHMAIABGAG8AcgAgAE0AbwByAGUAAAAAAwAAAAAAAARnAjMAAAAAAAAAAAAAAAAAAAAAAAAAALkH%2FwABjYUA)format('truetype')%3Bfont-weight%3Anormal%3Bfont-style%3Anormal%3B%7D%3C%2Fstyle%3E%3C%2Fdefs%3E%3Ctext%20font-family%3D%22round_brackets22549f92a457f2409%22%20font-size%3D%2218%22%20text-anchor%3D%22middle%22%20x%3D%223.5%22%20y%3D%2221%22%3E(%3C%2Ftext%3E%3Ctext%20font-family%3D%22round_brackets22549f92a457f2409%22%20font-size%3D%2218%22%20text-anchor%3D%22middle%22%20x%3D%2247.5%22%20y%3D%2221%22%3E)%3C%2Ftext%3E%3Ctext%20font-family%3D%22Times%20New%20Roman%22%20font-size%3D%2218%22%20font-style%3D%22italic%22%20text-anchor%3D%22middle%22%20x%3D%2210.5%22%20y%3D%2216%22%3Ex%3C%2Ftext%3E%3Ctext%20font-family%3D%22Times%20New%20Roman%22%20font-size%3D%2213%22%20font-style%3D%22italic%22%20text-anchor%3D%22middle%22%20x%3D%2218.5%22%20y%3D%2224%22%3Ei%3C%2Ftext%3E%3Ctext%20font-family%3D%22math1f7177163c833dff4b38fc8d287%22%20font-size%3D%2216%22%20text-anchor%3D%22middle%22%20x%3D%2223.5%22%20y%3D%2216%22%3E%2C%3C%2Ftext%3E%3Ctext%20font-family%3D%22Times%20New%20Roman%22%20font-size%3D%2218%22%20font-style%3D%22italic%22%20text-anchor%3D%22middle%22%20x%3D%2234.5%22%20y%3D%2216%22%3Ey%3C%2Ftext%3E%3Ctext%20font-family%3D%22Times%20New%20Roman%22%20font-size%3D%2213%22%20font-style%3D%22italic%22%20text-anchor%3D%22middle%22%20x%3D%2242.5%22%20y%3D%2224%22%3Ei%3C%2Ftext%3E%3C%2Fsvg%3E) , the formula for the correlation coefficient is
, the formula for the correlation coefficient isformat('truetype')%3Bfont-weight%3Anormal%3Bfont-style%3Anormal%3B%7D%40font-face%7Bfont-family%3A'math1bfb9763c2a4e2f59808a77994b'%3Bsrc%3Aurl(data%3Afont%2Ftruetype%3Bcharset%3Dutf-8%3Bbase64%2CAAEAAAAMAIAAAwBAT1MvMi7iBBMAAADMAAAATmNtYXDEvmKUAAABHAAAAERjdnQgDVUNBwAAAWAAAAA6Z2x5ZoPi2VsAAAGcAAABhWhlYWQQC2qxAAADJAAAADZoaGVhCGsXSAAAA1wAAAAkaG10eE2rRkcAAAOAAAAAEGxvY2EAHTwYAAADkAAAABRtYXhwBT0FPgAAA6QAAAAgbmFtZaBxlY4AAAPEAAABn3Bvc3QB9wD6AAAFZAAAACBwcmVwa1uragAABYQAAAAUAAADSwGQAAUAAAQABAAAAAAABAAEAAAAAAAAAQEAAAAAAAAAAAAAAAAAAAAAAAAAAAAAAAAAAAAAACAgICAAAAAg1UADev96AAAD6ACWAAAAAAACAAEAAQAAABQAAwABAAAAFAAEADAAAAAIAAgAAgAAAD0iESIS%2F%2F8AAAA9IhEiEv%2F%2F%2F8Td8d3xAAEAAAAAAAAAAAAAAVQDLACAAQAAVgAqAlgCHgEOASwCLABaAYACgACgANQAgAAAAAAAAAArAFUAgACrANUBAAErAAcAAAACAFUAAAMAA6sAAwAHAAAzESERJSERIVUCq%2F2rAgD%2BAAOr%2FFVVAwAAAgCAAOsC1QIVAAMABwBlGAGwCBCwBtSwBhCwBdSwCBCwAdSwARCwANSwBhCwBzywBRCwBDywARCwAjywABCwAzwAsAgQsAbUsAYQsAfUsAcQsAHUsAEQsALUsAYQsAU8sAcQsAQ8sAEQsAA8sAIQsAM8MTATITUhHQEhNYACVf2rAlUBwFXVVVUAAQCAAAADKwMrAA8AShgBsBAQsQQD9rAAPLEJA%2FWwCzyxBgv1sA48sRED5rEHBv2wDTwAsQQAP7EIBf2xAwk8PLEGBe2xAAI%2FsQwF%2FbELATw8sQ4F%2FTEwExUJARUhNSMVIQkBIRUzNYABK%2F7VAqsr%2FgABK%2F7VAgArAytV%2Fv%2F%2BgFWrVgGAAQFWqwABAIABVQLVAasAAwAwGAGwBBCxAAP2sAM8sQIH9bABPLEFA%2BYAsQAAExCxAAblsQABExCwATyxAwX1sAI8EyEVIYACVf2rAatWAAAAAAEAAAABAADVeM5BXw889QADBAD%2F%2F%2F%2F%2F1joTc%2F%2F%2F%2F%2F%2FWOhNzAAD%2FIASAA6sAAAAKAAIAAQAAAAAAAQAAA%2Bj%2FagAAF3AAAP%2B2BIAAAQAAAAAAAAAAAAAAAAAAAAQDUgBVA1YAgAOsAIADVgCAAAAAAAAAACgAAACyAAABOwAAAYUAAQAAAAQAXgAFAAAAAAACAIAEAAAAAAAEAADeAAAAAAAAABUBAgAAAAAAAAABABIAAAAAAAAAAAACAA4AEgAAAAAAAAADADAAIAAAAAAAAAAEABIAUAAAAAAAAAAFABYAYgAAAAAAAAAGAAkAeAAAAAAAAAAIABwAgQABAAAAAAABABIAAAABAAAAAAACAA4AEgABAAAAAAADADAAIAABAAAAAAAEABIAUAABAAAAAAAFABYAYgABAAAAAAAGAAkAeAABAAAAAAAIABwAgQADAAEECQABABIAAAADAAEECQACAA4AEgADAAEECQADADAAIAADAAEECQAEABIAUAADAAEECQAFABYAYgADAAEECQAGAAkAeAADAAEECQAIABwAgQBNAGEAdABoACAARgBvAG4AdABSAGUAZwB1AGwAYQByAE0AYQB0AGgAcwAgAEYAbwByACAATQBvAHIAZQAgAE0AYQB0AGgAIABGAG8AbgB0AE0AYQB0AGgAIABGAG8AbgB0AFYAZQByAHMAaQBvAG4AIAAxAC4AME1hdGhfRm9udABNAGEAdABoAHMAIABGAG8AcgAgAE0AbwByAGUAAAMAAAAAAAAB9AD6AAAAAAAAAAAAAAAAAAAAAAAAAAC5BxEAAI2FGACyAAAAFRQTsQABPw%3D%3D)format('truetype')%3Bfont-weight%3Anormal%3Bfont-style%3Anormal%3B%7D%40font-face%7Bfont-family%3A'brack_sm2882ad605b1e27be87c7468'%3Bsrc%3Aurl(data%3Afont%2Ftruetype%3Bcharset%3Dutf-8%3Bbase64%2CAAEAAAAMAIAAAwBAT1MvMi7PH4UAAADMAAAATmNtYXA3kjw6AAABHAAAADxjdnQgAQYDiAAAAVgAAAASZ2x5ZkyYQ7YAAAFsAAAAkWhlYWQLyR8fAAACAAAAADZoaGVhAq0XCAAAAjgAAAAkaG10eDEjA%2FUAAAJcAAAADGxvY2EAAEKZAAACaAAAABBtYXhwBJsEcQAAAngAAAAgbmFtZW7QvZAAAAKYAAAB5XBvc3QArQBVAAAEgAAAACBwcmVwu5WEAAAABKAAAAAHAAACDAGQAAUAAAQABAAAAAAABAAEAAAAAAAAAQEAAAAAAAAAAAAAAAAAAAAAAAAAAAAAAAAAAAAAACAgICAAAAAg9AMD%2FP%2F8AAABVAABAAAAAAACAAEAAQAAABQAAwABAAAAFAAEACgAAAAGAAQAAQACI5wjn%2F%2F%2FAAAjnCOf%2F%2F%2FcZdxjAAEAAAAAAAAAAAFUAFQBAAArAIwAgACoAAcAAAACAAAAAADVAQEAAwAHAAAxMxEjFyM1M9XVq4CAAQHWqwABAAAAAABVAVgAAwAfGAGwAy%2BwADyxAgL1sAE8ALEDAD%2BwAjx8sQAG9bABPBEzESNVVQFY%2FqgAAQDXAAABLAFUAAMAIBgBsAUvsAE8sAI8sQAC9bADPACwAy%2BwAjyxAAH1sAE8EzMRI9dVVQFU%2FqwAAAAAAQAAAAEAAIsesexfDzz1AAMEAP%2F%2F%2F%2F%2FVre5k%2F%2F%2F%2F%2F9Wt7mT%2FgP%2F%2FAdYBWAAAAAoAAgABAAAAAAABAAABVP%2F%2FAAAXcP%2BA%2F4AB1gABAAAAAAAAAAAAAAAAAAAAAwDVAAABLAAAASwA1wAAAAAAAAAhAAAAWAAAAJEAAQAAAAMACgACAAAAAAACAIAEAAAAAAAEAABlAAAAAAAAABUBAgAAAAAAAAABACYAAAAAAAAAAAACAA4AJgAAAAAAAAADAEQANAAAAAAAAAAEACYAeAAAAAAAAAAFABYAngAAAAAAAAAGABMAtAAAAAAAAAAIABwAxwABAAAAAAABACYAAAABAAAAAAACAA4AJgABAAAAAAADAEQANAABAAAAAAAEACYAeAABAAAAAAAFABYAngABAAAAAAAGABMAtAABAAAAAAAIABwAxwADAAEECQABACYAAAADAAEECQACAA4AJgADAAEECQADAEQANAADAAEECQAEACYAeAADAAEECQAFABYAngADAAEECQAGABMAtAADAAEECQAIABwAxwBCAHIAYQBjAGsAZQB0AHMAIABzAG0AYQBsAGwAIABzAGkAegBlAFIAZQBnAHUAbABhAHIATQBhAHQAaABzACAARgBvAHIAIABNAG8AcgBlACAAQgByAGEAYwBrAGUAdABzACAAcwBtAGEAbABsACAAcwBpAHoAZQBCAHIAYQBjAGsAZQB0AHMAIABzAG0AYQBsAGwAIABzAGkAegBlAFYAZQByAHMAaQBvAG4AIAAyAC4AMEJyYWNrZXRzX3NtYWxsX3NpemUATQBhAHQAaABzACAARgBvAHIAIABNAG8AcgBlAAAAAAMAAAAAAAAAqgBVAAAAAAAAAAAAAAAAAAAAAAAAAAC5B%2F8AAo2FAA%3D%3D)format('truetype')%3Bfont-weight%3Anormal%3Bfont-style%3Anormal%3B%7D%40font-face%7Bfont-family%3A'bracketse552f5417ff4680c6b50499'%3Bsrc%3Aurl(data%3Afont%2Ftruetype%3Bcharset%3Dutf-8%3Bbase64%2CAAEAAAAMAIAAAwBAT1MvMi7RIisAAADMAAAATmNtYXBi7uzYAAABHAAAAExjdnQgBAkDLgAAAWgAAAASZ2x5Zo64f%2BkAAAF8AAABSWhlYWQLniGcAAACyAAAADZoaGVhBK4XLAAAAwAAAAAkaG10eCWq%2F90AAAMkAAAAFGxvY2EAABknAAADOAAAABhtYXhwBJIESAAAA1AAAAAgbmFtZRAA8I4AAANwAAAB3nBvc3QBwwDgAAAFUAAAACBwcmVwupWEAAAABXAAAAAHAAACggGQAAUAAAQABAAAAAAABAAEAAAAAAAAAQEAAAAAAAAAAAAAAAAAAAAAAAAAAAAAAAAAAAAAACAgICAAAAAg9AMEAAAAAAADgAAAAAAAAAACAAEAAQAAABQAAwABAAAAFAAEADgAAAAKAAgAAgACI5sjnSOeI6D%2F%2FwAAI5sjnSOeI6D%2F%2F9xm3GXcZdxkAAEAAAAAAAAAAAAAAAABVABWAQAALACoA4AAMgAHAAAAAgAAACoA1QNVAAMABwAANTMRIxMjETPV1auAgCoDK%2F0AAtUAAQAAAAABgAOAAAUAJBgBsAAvsAPFsQEC%2FbADELEEBP0AsQAAP7ABPLEEBj%2BwAzwwMTEzEAEjAFUBKyv%2BqwH8AYT%2BqgABAAAAAAGAA4AABQAmGAGwAC6wA8WxBQL9sAMQsQIE%2FQB8sQAGPxiwBTyxAwb2sAI8MDEREgEzABMBAVQr%2FtMCA4D91v6qAYQB%2FAAB%2F6wAAAEsA4AABQAnGAGwAC%2BwBzywA8WxAQL9sAMQsQQE%2FQCxAAA%2FsAE8sQQGP7ADPDAxISMSATMAASxVAf7UKwFVAfwBhP6rAAH%2FrAAAASwDgAAFACkYAbABL7AHPLAExbEAAv2wBBCxAwT9AHyxAQY%2FsAA8GLEEAD%2BwAzwwMRMzEAEjANdV%2FqsrASsDgP3V%2FqsBhgAAAAABAAAAAQAAeuTcpl8PPPUAAwQA%2F%2F%2F%2F%2F9Wt7o7%2F%2F%2F%2F%2F1a3ujv%2BsAAABgAOAAAAACgACAAEAAAAAAAEAAAOAAAAAABdw%2F6z%2FrAGAAAEAAAAAAAAAAAAAAAAAAAAFANUAAAEsAAABLAAAASz%2FrAEs%2F6wAAAAAAAAAJAAAAGgAAACzAAAA%2FQAAAUkAAQAAAAUACAACAAAAAAACAIAEAAAAAAAEAAA%2BAAAAAAAAABUBAgAAAAAAAAABACQAAAAAAAAAAAACAA4AJAAAAAAAAAADAEIAMgAAAAAAAAAEACQAdAAAAAAAAAAFABYAmAAAAAAAAAAGABIArgAAAAAAAAAIABwAwAABAAAAAAABACQAAAABAAAAAAACAA4AJAABAAAAAAADAEIAMgABAAAAAAAEACQAdAABAAAAAAAFABYAmAABAAAAAAAGABIArgABAAAAAAAIABwAwAADAAEECQABACQAAAADAAEECQACAA4AJAADAAEECQADAEIAMgADAAEECQAEACQAdAADAAEECQAFABYAmAADAAEECQAGABIArgADAAEECQAIABwAwABCAHIAYQBjAGsAZQB0AHMAIABmAHUAbABsACAAcwBpAHoAZQBSAGUAZwB1AGwAYQByAE0AYQB0AGgAcwAgAEYAbwByACAATQBvAHIAZQAgAEIAcgBhAGMAawBlAHQAcwAgAGYAdQBsAGwAIABzAGkAegBlAEIAcgBhAGMAawBlAHQAcwAgAGYAdQBsAGwAIABzAGkAegBlAFYAZQByAHMAaQBvAG4AIAAyAC4AMEJyYWNrZXRzX2Z1bGxfc2l6ZQBNAGEAdABoAHMAIABGAG8AcgAgAE0AbwByAGUAAAADAAAAAAAAAcAA4AAAAAAAAAAAAAAAAAAAAAAAAAAAuQf%2FAAGNhQA%3D)format('truetype')%3Bfont-weight%3Anormal%3Bfont-style%3Anormal%3B%7D%3C%2Fstyle%3E%3C%2Fdefs%3E%3Ctext%20font-family%3D%22Times%20New%20Roman%22%20font-size%3D%2218%22%20font-style%3D%22italic%22%20text-anchor%3D%22middle%22%20x%3D%223.5%22%20y%3D%2238%22%3Er%3C%2Ftext%3E%3Ctext%20font-family%3D%22math1bfb9763c2a4e2f59808a77994b%22%20font-size%3D%2216%22%20text-anchor%3D%22middle%22%20x%3D%2215.5%22%20y%3D%2238%22%3E%3D%3C%2Ftext%3E%3Cline%20stroke%3D%22%23000000%22%20stroke-linecap%3D%22square%22%20stroke-width%3D%221%22%20x1%3D%2226.5%22%20x2%3D%2265.5%22%20y1%3D%2231.5%22%20y2%3D%2231.5%22%2F%3E%3Ctext%20font-family%3D%22Times%20New%20Roman%22%20font-size%3D%2218%22%20text-anchor%3D%22middle%22%20x%3D%2246.5%22%20y%3D%2224%22%3E1%3C%2Ftext%3E%3Ctext%20font-family%3D%22Times%20New%20Roman%22%20font-size%3D%2218%22%20font-style%3D%22italic%22%20text-anchor%3D%22middle%22%20x%3D%2232.5%22%20y%3D%2249%22%3En%3C%2Ftext%3E%3Ctext%20font-family%3D%22math1bfb9763c2a4e2f59808a77994b%22%20font-size%3D%2216%22%20text-anchor%3D%22middle%22%20x%3D%2246.5%22%20y%3D%2249%22%3E%26%23x2212%3B%3C%2Ftext%3E%3Ctext%20font-family%3D%22Times%20New%20Roman%22%20font-size%3D%2218%22%20text-anchor%3D%22middle%22%20x%3D%2259.5%22%20y%3D%2249%22%3E1%3C%2Ftext%3E%3Ctext%20font-family%3D%22math1bfb9763c2a4e2f59808a77994b%22%20font-size%3D%2224%22%20text-anchor%3D%22middle%22%20x%3D%2279.5%22%20y%3D%2241%22%3E%26%23x2211%3B%3C%2Ftext%3E%3Ctext%20font-family%3D%22bracketse552f5417ff4680c6b50499%22%20font-size%3D%2218%22%20text-anchor%3D%22start%22%20x%3D%2291.5%22%20y%3D%2219%22%3E%26%23x239B%3B%3C%2Ftext%3E%3Ctext%20font-family%3D%22brack_sm2882ad605b1e27be87c7468%22%20font-size%3D%2218%22%20text-anchor%3D%22start%22%20x%3D%2291.5%22%20y%3D%2225%22%3E%26%23x239C%3B%3C%2Ftext%3E%3Ctext%20font-family%3D%22brack_sm2882ad605b1e27be87c7468%22%20font-size%3D%2218%22%20text-anchor%3D%22start%22%20x%3D%2291.5%22%20y%3D%2231%22%3E%26%23x239C%3B%3C%2Ftext%3E%3Ctext%20font-family%3D%22brack_sm2882ad605b1e27be87c7468%22%20font-size%3D%2218%22%20text-anchor%3D%22start%22%20x%3D%2291.5%22%20y%3D%2237%22%3E%26%23x239C%3B%3C%2Ftext%3E%3Ctext%20font-family%3D%22brack_sm2882ad605b1e27be87c7468%22%20font-size%3D%2218%22%20text-anchor%3D%22start%22%20x%3D%2291.5%22%20y%3D%2243%22%3E%26%23x239C%3B%3C%2Ftext%3E%3Ctext%20font-family%3D%22bracketse552f5417ff4680c6b50499%22%20font-size%3D%2218%22%20text-anchor%3D%22start%22%20x%3D%2291.5%22%20y%3D%2259%22%3E%26%23x239D%3B%3C%2Ftext%3E%3Ctext%20font-family%3D%22bracketse552f5417ff4680c6b50499%22%20font-size%3D%2218%22%20text-anchor%3D%22start%22%20x%3D%22148.5%22%20y%3D%2219%22%3E%26%23x239E%3B%3C%2Ftext%3E%3Ctext%20font-family%3D%22brack_sm2882ad605b1e27be87c7468%22%20font-size%3D%2218%22%20text-anchor%3D%22start%22%20x%3D%22148.5%22%20y%3D%2225%22%3E%26%23x239F%3B%3C%2Ftext%3E%3Ctext%20font-family%3D%22brack_sm2882ad605b1e27be87c7468%22%20font-size%3D%2218%22%20text-anchor%3D%22start%22%20x%3D%22148.5%22%20y%3D%2231%22%3E%26%23x239F%3B%3C%2Ftext%3E%3Ctext%20font-family%3D%22brack_sm2882ad605b1e27be87c7468%22%20font-size%3D%2218%22%20text-anchor%3D%22start%22%20x%3D%22148.5%22%20y%3D%2237%22%3E%26%23x239F%3B%3C%2Ftext%3E%3Ctext%20font-family%3D%22brack_sm2882ad605b1e27be87c7468%22%20font-size%3D%2218%22%20text-anchor%3D%22start%22%20x%3D%22148.5%22%20y%3D%2243%22%3E%26%23x239F%3B%3C%2Ftext%3E%3Ctext%20font-family%3D%22bracketse552f5417ff4680c6b50499%22%20font-size%3D%2218%22%20text-anchor%3D%22start%22%20x%3D%22148.5%22%20y%3D%2259%22%3E%26%23x23A0%3B%3C%2Ftext%3E%3Cline%20stroke%3D%22%23000000%22%20stroke-linecap%3D%22square%22%20stroke-width%3D%221%22%20x1%3D%2299.5%22%20x2%3D%22144.5%22%20y1%3D%2231.5%22%20y2%3D%2231.5%22%2F%3E%3Ctext%20font-family%3D%22Times%20New%20Roman%22%20font-size%3D%2218%22%20font-style%3D%22italic%22%20text-anchor%3D%22middle%22%20x%3D%22105.5%22%20y%3D%2218%22%3Ex%3C%2Ftext%3E%3Ctext%20font-family%3D%22Times%20New%20Roman%22%20font-size%3D%2213%22%20font-style%3D%22italic%22%20text-anchor%3D%22middle%22%20x%3D%22113.5%22%20y%3D%2226%22%3Ei%3C%2Ftext%3E%3Ctext%20font-family%3D%22math1bfb9763c2a4e2f59808a77994b%22%20font-size%3D%2216%22%20text-anchor%3D%22middle%22%20x%3D%22124.5%22%20y%3D%2218%22%3E%26%23x2212%3B%3C%2Ftext%3E%3Ctext%20font-family%3D%22horizontalbf65417dcecc7f2b0006e%22%20font-size%3D%2213%22%20text-anchor%3D%22middle%22%20x%3D%22136.5%22%20y%3D%2210%22%3E%26%23x23AF%3B%3C%2Ftext%3E%3Ctext%20font-family%3D%22horizontalbf65417dcecc7f2b0006e%22%20font-size%3D%2213%22%20text-anchor%3D%22middle%22%20x%3D%22140.5%22%20y%3D%2210%22%3E%26%23x23AF%3B%3C%2Ftext%3E%3Ctext%20font-family%3D%22Times%20New%20Roman%22%20font-size%3D%2218%22%20font-style%3D%22italic%22%20text-anchor%3D%22middle%22%20x%3D%22137.5%22%20y%3D%2218%22%3Ex%3C%2Ftext%3E%3Ctext%20font-family%3D%22Times%20New%20Roman%22%20font-size%3D%2218%22%20font-style%3D%22italic%22%20text-anchor%3D%22middle%22%20x%3D%22117.5%22%20y%3D%2249%22%3Es%3C%2Ftext%3E%3Ctext%20font-family%3D%22Times%20New%20Roman%22%20font-size%3D%2213%22%20font-style%3D%22italic%22%20text-anchor%3D%22middle%22%20x%3D%22125.5%22%20y%3D%2257%22%3Ex%3C%2Ftext%3E%3Ctext%20font-family%3D%22bracketse552f5417ff4680c6b50499%22%20font-size%3D%2218%22%20text-anchor%3D%22start%22%20x%3D%22155.5%22%20y%3D%2219%22%3E%26%23x239B%3B%3C%2Ftext%3E%3Ctext%20font-family%3D%22brack_sm2882ad605b1e27be87c7468%22%20font-size%3D%2218%22%20text-anchor%3D%22start%22%20x%3D%22155.5%22%20y%3D%2225%22%3E%26%23x239C%3B%3C%2Ftext%3E%3Ctext%20font-family%3D%22brack_sm2882ad605b1e27be87c7468%22%20font-size%3D%2218%22%20text-anchor%3D%22start%22%20x%3D%22155.5%22%20y%3D%2231%22%3E%26%23x239C%3B%3C%2Ftext%3E%3Ctext%20font-family%3D%22brack_sm2882ad605b1e27be87c7468%22%20font-size%3D%2218%22%20text-anchor%3D%22start%22%20x%3D%22155.5%22%20y%3D%2237%22%3E%26%23x239C%3B%3C%2Ftext%3E%3Ctext%20font-family%3D%22brack_sm2882ad605b1e27be87c7468%22%20font-size%3D%2218%22%20text-anchor%3D%22start%22%20x%3D%22155.5%22%20y%3D%2243%22%3E%26%23x239C%3B%3C%2Ftext%3E%3Ctext%20font-family%3D%22bracketse552f5417ff4680c6b50499%22%20font-size%3D%2218%22%20text-anchor%3D%22start%22%20x%3D%22155.5%22%20y%3D%2259%22%3E%26%23x239D%3B%3C%2Ftext%3E%3Ctext%20font-family%3D%22bracketse552f5417ff4680c6b50499%22%20font-size%3D%2218%22%20text-anchor%3D%22start%22%20x%3D%22212.5%22%20y%3D%2219%22%3E%26%23x239E%3B%3C%2Ftext%3E%3Ctext%20font-family%3D%22brack_sm2882ad605b1e27be87c7468%22%20font-size%3D%2218%22%20text-anchor%3D%22start%22%20x%3D%22212.5%22%20y%3D%2225%22%3E%26%23x239F%3B%3C%2Ftext%3E%3Ctext%20font-family%3D%22brack_sm2882ad605b1e27be87c7468%22%20font-size%3D%2218%22%20text-anchor%3D%22start%22%20x%3D%22212.5%22%20y%3D%2231%22%3E%26%23x239F%3B%3C%2Ftext%3E%3Ctext%20font-family%3D%22brack_sm2882ad605b1e27be87c7468%22%20font-size%3D%2218%22%20text-anchor%3D%22start%22%20x%3D%22212.5%22%20y%3D%2237%22%3E%26%23x239F%3B%3C%2Ftext%3E%3Ctext%20font-family%3D%22brack_sm2882ad605b1e27be87c7468%22%20font-size%3D%2218%22%20text-anchor%3D%22start%22%20x%3D%22212.5%22%20y%3D%2243%22%3E%26%23x239F%3B%3C%2Ftext%3E%3Ctext%20font-family%3D%22bracketse552f5417ff4680c6b50499%22%20font-size%3D%2218%22%20text-anchor%3D%22start%22%20x%3D%22212.5%22%20y%3D%2259%22%3E%26%23x23A0%3B%3C%2Ftext%3E%3Cline%20stroke%3D%22%23000000%22%20stroke-linecap%3D%22square%22%20stroke-width%3D%221%22%20x1%3D%22163.5%22%20x2%3D%22208.5%22%20y1%3D%2231.5%22%20y2%3D%2231.5%22%2F%3E%3Ctext%20font-family%3D%22Times%20New%20Roman%22%20font-size%3D%2218%22%20font-style%3D%22italic%22%20text-anchor%3D%22middle%22%20x%3D%22169.5%22%20y%3D%2218%22%3Ey%3C%2Ftext%3E%3Ctext%20font-family%3D%22Times%20New%20Roman%22%20font-size%3D%2213%22%20font-style%3D%22italic%22%20text-anchor%3D%22middle%22%20x%3D%22177.5%22%20y%3D%2226%22%3Ei%3C%2Ftext%3E%3Ctext%20font-family%3D%22math1bfb9763c2a4e2f59808a77994b%22%20font-size%3D%2216%22%20text-anchor%3D%22middle%22%20x%3D%22188.5%22%20y%3D%2218%22%3E%26%23x2212%3B%3C%2Ftext%3E%3Ctext%20font-family%3D%22horizontalbf65417dcecc7f2b0006e%22%20font-size%3D%2213%22%20text-anchor%3D%22middle%22%20x%3D%22200.5%22%20y%3D%2210%22%3E%26%23x23AF%3B%3C%2Ftext%3E%3Ctext%20font-family%3D%22horizontalbf65417dcecc7f2b0006e%22%20font-size%3D%2213%22%20text-anchor%3D%22middle%22%20x%3D%22204.5%22%20y%3D%2210%22%3E%26%23x23AF%3B%3C%2Ftext%3E%3Ctext%20font-family%3D%22Times%20New%20Roman%22%20font-size%3D%2218%22%20font-style%3D%22italic%22%20text-anchor%3D%22middle%22%20x%3D%22201.5%22%20y%3D%2218%22%3Ey%3C%2Ftext%3E%3Ctext%20font-family%3D%22Times%20New%20Roman%22%20font-size%3D%2218%22%20font-style%3D%22italic%22%20text-anchor%3D%22middle%22%20x%3D%22181.5%22%20y%3D%2249%22%3Es%3C%2Ftext%3E%3Ctext%20font-family%3D%22Times%20New%20Roman%22%20font-size%3D%2213%22%20font-style%3D%22italic%22%20text-anchor%3D%22middle%22%20x%3D%22189.5%22%20y%3D%2257%22%3Ey%3C%2Ftext%3E%3C%2Fsvg%3E)
where
format('truetype')%3Bfont-weight%3Anormal%3Bfont-style%3Anormal%3B%7D%40font-face%7Bfont-family%3A'math1bfb9763c2a4e2f59808a77994b'%3Bsrc%3Aurl(data%3Afont%2Ftruetype%3Bcharset%3Dutf-8%3Bbase64%2CAAEAAAAMAIAAAwBAT1MvMi7iBBMAAADMAAAATmNtYXDEvmKUAAABHAAAAERjdnQgDVUNBwAAAWAAAAA6Z2x5ZoPi2VsAAAGcAAABhWhlYWQQC2qxAAADJAAAADZoaGVhCGsXSAAAA1wAAAAkaG10eE2rRkcAAAOAAAAAEGxvY2EAHTwYAAADkAAAABRtYXhwBT0FPgAAA6QAAAAgbmFtZaBxlY4AAAPEAAABn3Bvc3QB9wD6AAAFZAAAACBwcmVwa1uragAABYQAAAAUAAADSwGQAAUAAAQABAAAAAAABAAEAAAAAAAAAQEAAAAAAAAAAAAAAAAAAAAAAAAAAAAAAAAAAAAAACAgICAAAAAg1UADev96AAAD6ACWAAAAAAACAAEAAQAAABQAAwABAAAAFAAEADAAAAAIAAgAAgAAAD0iESIS%2F%2F8AAAA9IhEiEv%2F%2F%2F8Td8d3xAAEAAAAAAAAAAAAAAVQDLACAAQAAVgAqAlgCHgEOASwCLABaAYACgACgANQAgAAAAAAAAAArAFUAgACrANUBAAErAAcAAAACAFUAAAMAA6sAAwAHAAAzESERJSERIVUCq%2F2rAgD%2BAAOr%2FFVVAwAAAgCAAOsC1QIVAAMABwBlGAGwCBCwBtSwBhCwBdSwCBCwAdSwARCwANSwBhCwBzywBRCwBDywARCwAjywABCwAzwAsAgQsAbUsAYQsAfUsAcQsAHUsAEQsALUsAYQsAU8sAcQsAQ8sAEQsAA8sAIQsAM8MTATITUhHQEhNYACVf2rAlUBwFXVVVUAAQCAAAADKwMrAA8AShgBsBAQsQQD9rAAPLEJA%2FWwCzyxBgv1sA48sRED5rEHBv2wDTwAsQQAP7EIBf2xAwk8PLEGBe2xAAI%2FsQwF%2FbELATw8sQ4F%2FTEwExUJARUhNSMVIQkBIRUzNYABK%2F7VAqsr%2FgABK%2F7VAgArAytV%2Fv%2F%2BgFWrVgGAAQFWqwABAIABVQLVAasAAwAwGAGwBBCxAAP2sAM8sQIH9bABPLEFA%2BYAsQAAExCxAAblsQABExCwATyxAwX1sAI8EyEVIYACVf2rAatWAAAAAAEAAAABAADVeM5BXw889QADBAD%2F%2F%2F%2F%2F1joTc%2F%2F%2F%2F%2F%2FWOhNzAAD%2FIASAA6sAAAAKAAIAAQAAAAAAAQAAA%2Bj%2FagAAF3AAAP%2B2BIAAAQAAAAAAAAAAAAAAAAAAAAQDUgBVA1YAgAOsAIADVgCAAAAAAAAAACgAAACyAAABOwAAAYUAAQAAAAQAXgAFAAAAAAACAIAEAAAAAAAEAADeAAAAAAAAABUBAgAAAAAAAAABABIAAAAAAAAAAAACAA4AEgAAAAAAAAADADAAIAAAAAAAAAAEABIAUAAAAAAAAAAFABYAYgAAAAAAAAAGAAkAeAAAAAAAAAAIABwAgQABAAAAAAABABIAAAABAAAAAAACAA4AEgABAAAAAAADADAAIAABAAAAAAAEABIAUAABAAAAAAAFABYAYgABAAAAAAAGAAkAeAABAAAAAAAIABwAgQADAAEECQABABIAAAADAAEECQACAA4AEgADAAEECQADADAAIAADAAEECQAEABIAUAADAAEECQAFABYAYgADAAEECQAGAAkAeAADAAEECQAIABwAgQBNAGEAdABoACAARgBvAG4AdABSAGUAZwB1AGwAYQByAE0AYQB0AGgAcwAgAEYAbwByACAATQBvAHIAZQAgAE0AYQB0AGgAIABGAG8AbgB0AE0AYQB0AGgAIABGAG8AbgB0AFYAZQByAHMAaQBvAG4AIAAxAC4AME1hdGhfRm9udABNAGEAdABoAHMAIABGAG8AcgAgAE0AbwByAGUAAAMAAAAAAAAB9AD6AAAAAAAAAAAAAAAAAAAAAAAAAAC5BxEAAI2FGACyAAAAFRQTsQABPw%3D%3D)format('truetype')%3Bfont-weight%3Anormal%3Bfont-style%3Anormal%3B%7D%40font-face%7Bfont-family%3A'round_brackets22549f92a457f2409'%3Bsrc%3Aurl(data%3Afont%2Ftruetype%3Bcharset%3Dutf-8%3Bbase64%2CAAEAAAAMAIAAAwBAT1MvMjxkLiAAAADMAAAATmNtYXDf7xCrAAABHAAAADxjdnQgBAkDLgAAAVgAAAASZ2x5Zr5a4R4AAAFsAAABKWhlYWQO9ymoAAACmAAAADZoaGVhDVUVZQAAAtAAAAAkaG10eCFnAAIAAAL0AAAADGxvY2EAAARdAAADAAAAABBtYXhwBIgEWQAAAxAAAAAgbmFtZXHO2TgAAAMwAAACOXBvc3QEagIzAAAFbAAAACBwcmVwupWEAAAABYwAAAAHAAAGrgGQAAUAAAgACAAAAAAACAAIAAAAAAAAAQIAAAAAAAAAAAAAAAAAAAAAAAAAAAAAAAAAAAAAACAgICAAAAAo8AMGe%2F57AAAIzgIPAAAAAAACAAEAAQAAABQAAwABAAAAFAAEACgAAAAGAAQAAQACACgAKf%2F%2FAAAAKAAp%2F%2F%2F%2F2f%2FZAAEAAAAAAAAAAAFUAFYBAAAsAKgDgAAyAAcAAAACAAAAKgDVA1UAAwAHAAA1MxEjEyMRM9XVq4CAKgMr%2FQAC1QABAAD%2BYAJQCGAACQBNGAGwChCwA9SwAxCwAtSwChCwBdSwBRCwANSwAxCwBzywAhCwCDwAsAoQsAPUsAMQsAfUsAoQsAXUsAoQsADUsAMQsAI8sAcQsAg8MTATAgEzABMQASMABAQBwJD%2BPAQBwJD%2BRANg%2FHD%2BkAFwA5ADoAFg%2FqAAAQAA%2FmACUAhgAAkATRgBsAoQsAPUsAMQsALUsAoQsAXUsAUQsADUsAMQsAc8sAIQsAg8ALAKELAD1LADELAH1LAKELAF1LAKELAA1LADELACPLAHELAIPDEwARIBIwADEAEzAAJMBP5AkAHEBP5AkAG8A2D8cP6QAXADkAOgAWD%2BoAAAAAABAAAAAQAALiwXwl8PPPUAAwgA%2F%2F%2F%2F%2F9Wt7vT%2F%2F%2F%2F%2F1a3u9AAA%2FmAEhAhgAAAACgACAAEAAAAAAAEAAAjO%2FfEAABdwAAD%2F%2FgSEAAEAAAAAAAAAAAAAAAAAAAADANUAAAJQAAACUAAAAAAAAAAAACQAAACmAAABKQABAAAAAwAKAAIAAAAAAAIAgAQAAAAAAAQAAE0AAAAAAAAAFQECAAAAAAAAAAEAPgAAAAAAAAAAAAIADgA%2BAAAAAAAAAAMAXABMAAAAAAAAAAQAPgCoAAAAAAAAAAUAFgDmAAAAAAAAAAYAHwD8AAAAAAAAAAgAHAEbAAEAAAAAAAEAPgAAAAEAAAAAAAIADgA%2BAAEAAAAAAAMAXABMAAEAAAAAAAQAPgCoAAEAAAAAAAUAFgDmAAEAAAAAAAYAHwD8AAEAAAAAAAgAHAEbAAMAAQQJAAEAPgAAAAMAAQQJAAIADgA%2BAAMAAQQJAAMAXABMAAMAAQQJAAQAPgCoAAMAAQQJAAUAFgDmAAMAAQQJAAYAHwD8AAMAAQQJAAgAHAEbAFIAbwB1AG4AZAAgAGIAcgBhAGMAawBlAHQAcwAgAHcAaQB0AGgAIABhAHMAYwBlAG4AdAAgADIAMgA1ADQAUgBlAGcAdQBsAGEAcgBNAGEAdABoAHMAIABGAG8AcgAgAE0AbwByAGUAIABSAG8AdQBuAGQAIABiAHIAYQBjAGsAZQB0AHMAIAB3AGkAdABoACAAYQBzAGMAZQBuAHQAIAAyADIANQA0AFIAbwB1AG4AZAAgAGIAcgBhAGMAawBlAHQAcwAgAHcAaQB0AGgAIABhAHMAYwBlAG4AdAAgADIAMgA1ADQAVgBlAHIAcwBpAG8AbgAgADIALgAwUm91bmRfYnJhY2tldHNfd2l0aF9hc2NlbnRfMjI1NABNAGEAdABoAHMAIABGAG8AcgAgAE0AbwByAGUAAAAAAwAAAAAAAARnAjMAAAAAAAAAAAAAAAAAAAAAAAAAALkH%2FwABjYUA)format('truetype')%3Bfont-weight%3Anormal%3Bfont-style%3Anormal%3B%7D%3C%2Fstyle%3E%3C%2Fdefs%3E%3Ctext%20font-family%3D%22Times%20New%20Roman%22%20font-size%3D%2218%22%20font-style%3D%22italic%22%20text-anchor%3D%22middle%22%20x%3D%223.5%22%20y%3D%2246%22%3Es%3C%2Ftext%3E%3Ctext%20font-family%3D%22Times%20New%20Roman%22%20font-size%3D%2213%22%20font-style%3D%22italic%22%20text-anchor%3D%22middle%22%20x%3D%2211.5%22%20y%3D%2254%22%3Ex%3C%2Ftext%3E%3Ctext%20font-family%3D%22math1bfb9763c2a4e2f59808a77994b%22%20font-size%3D%2216%22%20text-anchor%3D%22middle%22%20x%3D%2224.5%22%20y%3D%2246%22%3E%3D%3C%2Ftext%3E%3Cpolyline%20fill%3D%22none%22%20points%3D%2214%2C-53%2013%2C-53%206%2C0%202%2C-21%22%20stroke%3D%22%23000000%22%20stroke-linecap%3D%22square%22%20stroke-width%3D%221%22%20transform%3D%22translate(33.5%2C63.5)%22%2F%3E%3Cpolyline%20fill%3D%22none%22%20points%3D%226%2C0%202%2C-21%201%2C-18%22%20stroke%3D%22%23000000%22%20stroke-linecap%3D%22square%22%20stroke-width%3D%221%22%20transform%3D%22translate(33.5%2C63.5)%22%2F%3E%3Cline%20stroke%3D%22%23000000%22%20stroke-linecap%3D%22square%22%20stroke-width%3D%221%22%20x1%3D%2247.5%22%20x2%3D%22185.5%22%20y1%3D%2210.5%22%20y2%3D%2210.5%22%2F%3E%3Cline%20stroke%3D%22%23000000%22%20stroke-linecap%3D%22square%22%20stroke-width%3D%221%22%20x1%3D%2251.5%22%20x2%3D%2290.5%22%20y1%3D%2239.5%22%20y2%3D%2239.5%22%2F%3E%3Ctext%20font-family%3D%22Times%20New%20Roman%22%20font-size%3D%2218%22%20text-anchor%3D%22middle%22%20x%3D%2271.5%22%20y%3D%2232%22%3E1%3C%2Ftext%3E%3Ctext%20font-family%3D%22Times%20New%20Roman%22%20font-size%3D%2218%22%20font-style%3D%22italic%22%20text-anchor%3D%22middle%22%20x%3D%2257.5%22%20y%3D%2257%22%3En%3C%2Ftext%3E%3Ctext%20font-family%3D%22math1bfb9763c2a4e2f59808a77994b%22%20font-size%3D%2216%22%20text-anchor%3D%22middle%22%20x%3D%2271.5%22%20y%3D%2257%22%3E%26%23x2212%3B%3C%2Ftext%3E%3Ctext%20font-family%3D%22Times%20New%20Roman%22%20font-size%3D%2218%22%20text-anchor%3D%22middle%22%20x%3D%2284.5%22%20y%3D%2257%22%3E1%3C%2Ftext%3E%3Ctext%20font-family%3D%22math1bfb9763c2a4e2f59808a77994b%22%20font-size%3D%2224%22%20text-anchor%3D%22middle%22%20x%3D%22104.5%22%20y%3D%2249%22%3E%26%23x2211%3B%3C%2Ftext%3E%3Ctext%20font-family%3D%22round_brackets22549f92a457f2409%22%20font-size%3D%2218%22%20text-anchor%3D%22middle%22%20x%3D%22118.5%22%20y%3D%2250%22%3E(%3C%2Ftext%3E%3Ctext%20font-family%3D%22round_brackets22549f92a457f2409%22%20font-size%3D%2218%22%20text-anchor%3D%22middle%22%20x%3D%22169.5%22%20y%3D%2250%22%3E)%3C%2Ftext%3E%3Ctext%20font-family%3D%22Times%20New%20Roman%22%20font-size%3D%2218%22%20font-style%3D%22italic%22%20text-anchor%3D%22middle%22%20x%3D%22125.5%22%20y%3D%2246%22%3Ex%3C%2Ftext%3E%3Ctext%20font-family%3D%22Times%20New%20Roman%22%20font-size%3D%2213%22%20font-style%3D%22italic%22%20text-anchor%3D%22middle%22%20x%3D%22133.5%22%20y%3D%2254%22%3Ei%3C%2Ftext%3E%3Ctext%20font-family%3D%22math1bfb9763c2a4e2f59808a77994b%22%20font-size%3D%2216%22%20text-anchor%3D%22middle%22%20x%3D%22144.5%22%20y%3D%2246%22%3E%26%23x2212%3B%3C%2Ftext%3E%3Ctext%20font-family%3D%22horizontalbf65417dcecc7f2b0006e%22%20font-size%3D%2213%22%20text-anchor%3D%22middle%22%20x%3D%22156.5%22%20y%3D%2238%22%3E%26%23x23AF%3B%3C%2Ftext%3E%3Ctext%20font-family%3D%22horizontalbf65417dcecc7f2b0006e%22%20font-size%3D%2213%22%20text-anchor%3D%22middle%22%20x%3D%22160.5%22%20y%3D%2238%22%3E%26%23x23AF%3B%3C%2Ftext%3E%3Ctext%20font-family%3D%22Times%20New%20Roman%22%20font-size%3D%2218%22%20font-style%3D%22italic%22%20text-anchor%3D%22middle%22%20x%3D%22157.5%22%20y%3D%2246%22%3Ex%3C%2Ftext%3E%3Ctext%20font-family%3D%22Times%20New%20Roman%22%20font-size%3D%2213%22%20text-anchor%3D%22middle%22%20x%3D%22176.5%22%20y%3D%2240%22%3E2%3C%2Ftext%3E%3Ctext%20font-family%3D%22math1bfb9763c2a4e2f59808a77994b%22%20font-size%3D%2216%22%20text-anchor%3D%22middle%22%20x%3D%22194.5%22%20y%3D%2246%22%3E%3D%3C%2Ftext%3E%3Cpolyline%20fill%3D%22none%22%20points%3D%2214%2C-57%2013%2C-57%206%2C0%202%2C-23%22%20stroke%3D%22%23000000%22%20stroke-linecap%3D%22square%22%20stroke-width%3D%221%22%20transform%3D%22translate(203.5%2C60.5)%22%2F%3E%3Cpolyline%20fill%3D%22none%22%20points%3D%226%2C0%202%2C-23%201%2C-20%22%20stroke%3D%22%23000000%22%20stroke-linecap%3D%22square%22%20stroke-width%3D%221%22%20transform%3D%22translate(203.5%2C60.5)%22%2F%3E%3Cline%20stroke%3D%22%23000000%22%20stroke-linecap%3D%22square%22%20stroke-width%3D%221%22%20x1%3D%22217.5%22%20x2%3D%22324.5%22%20y1%3D%223.5%22%20y2%3D%223.5%22%2F%3E%3Cline%20stroke%3D%22%23000000%22%20stroke-linecap%3D%22square%22%20stroke-width%3D%221%22%20x1%3D%22221.5%22%20x2%3D%22320.5%22%20y1%3D%2239.5%22%20y2%3D%2239.5%22%2F%3E%3Ctext%20font-family%3D%22math1bfb9763c2a4e2f59808a77994b%22%20font-size%3D%2224%22%20text-anchor%3D%22middle%22%20x%3D%22234.5%22%20y%3D%2227%22%3E%26%23x2211%3B%3C%2Ftext%3E%3Ctext%20font-family%3D%22round_brackets22549f92a457f2409%22%20font-size%3D%2218%22%20text-anchor%3D%22middle%22%20x%3D%22253.5%22%20y%3D%2228%22%3E(%3C%2Ftext%3E%3Ctext%20font-family%3D%22round_brackets22549f92a457f2409%22%20font-size%3D%2218%22%20text-anchor%3D%22middle%22%20x%3D%22304.5%22%20y%3D%2228%22%3E)%3C%2Ftext%3E%3Ctext%20font-family%3D%22Times%20New%20Roman%22%20font-size%3D%2218%22%20font-style%3D%22italic%22%20text-anchor%3D%22middle%22%20x%3D%22260.5%22%20y%3D%2224%22%3Ex%3C%2Ftext%3E%3Ctext%20font-family%3D%22Times%20New%20Roman%22%20font-size%3D%2213%22%20font-style%3D%22italic%22%20text-anchor%3D%22middle%22%20x%3D%22268.5%22%20y%3D%2232%22%3Ei%3C%2Ftext%3E%3Ctext%20font-family%3D%22math1bfb9763c2a4e2f59808a77994b%22%20font-size%3D%2216%22%20text-anchor%3D%22middle%22%20x%3D%22279.5%22%20y%3D%2224%22%3E%26%23x2212%3B%3C%2Ftext%3E%3Ctext%20font-family%3D%22horizontalbf65417dcecc7f2b0006e%22%20font-size%3D%2213%22%20text-anchor%3D%22middle%22%20x%3D%22291.5%22%20y%3D%2216%22%3E%26%23x23AF%3B%3C%2Ftext%3E%3Ctext%20font-family%3D%22horizontalbf65417dcecc7f2b0006e%22%20font-size%3D%2213%22%20text-anchor%3D%22middle%22%20x%3D%22295.5%22%20y%3D%2216%22%3E%26%23x23AF%3B%3C%2Ftext%3E%3Ctext%20font-family%3D%22Times%20New%20Roman%22%20font-size%3D%2218%22%20font-style%3D%22italic%22%20text-anchor%3D%22middle%22%20x%3D%22292.5%22%20y%3D%2224%22%3Ex%3C%2Ftext%3E%3Ctext%20font-family%3D%22Times%20New%20Roman%22%20font-size%3D%2213%22%20text-anchor%3D%22middle%22%20x%3D%22311.5%22%20y%3D%2218%22%3E2%3C%2Ftext%3E%3Ctext%20font-family%3D%22Times%20New%20Roman%22%20font-size%3D%2218%22%20font-style%3D%22italic%22%20text-anchor%3D%22middle%22%20x%3D%22257.5%22%20y%3D%2257%22%3En%3C%2Ftext%3E%3Ctext%20font-family%3D%22math1bfb9763c2a4e2f59808a77994b%22%20font-size%3D%2216%22%20text-anchor%3D%22middle%22%20x%3D%22271.5%22%20y%3D%2257%22%3E%26%23x2212%3B%3C%2Ftext%3E%3Ctext%20font-family%3D%22Times%20New%20Roman%22%20font-size%3D%2218%22%20text-anchor%3D%22middle%22%20x%3D%22284.5%22%20y%3D%2257%22%3E1%3C%2Ftext%3E%3C%2Fsvg%3E) is the sample standard deviation of the
is the sample standard deviation of the  -values
recall that
format('truetype')%3Bfont-weight%3Anormal%3Bfont-style%3Anormal%3B%7D%40font-face%7Bfont-family%3A'math18a3c3e29d34cb201635f942203'%3Bsrc%3Aurl(data%3Afont%2Ftruetype%3Bcharset%3Dutf-8%3Bbase64%2CAAEAAAAMAIAAAwBAT1MvMi7iBBMAAADMAAAATmNtYXDEvmKUAAABHAAAADxjdnQgDVUNBwAAAVgAAAA6Z2x5ZoPi2VsAAAGUAAABO2hlYWQQC2qxAAAC0AAAADZoaGVhCGsXSAAAAwgAAAAkaG10eE2rRkcAAAMsAAAADGxvY2EAHTwYAAADOAAAABBtYXhwBT0FPgAAA0gAAAAgbmFtZaBxlY4AAANoAAABn3Bvc3QB9wD6AAAFCAAAACBwcmVwa1uragAABSgAAAAUAAADSwGQAAUAAAQABAAAAAAABAAEAAAAAAAAAQEAAAAAAAAAAAAAAAAAAAAAAAAAAAAAAAAAAAAAACAgICAAAAAg1UADev96AAAD6ACWAAAAAAACAAEAAQAAABQAAwABAAAAFAAEACgAAAAGAAQAAQACAD0iEf%2F%2FAAAAPSIR%2F%2F%2F%2FxN3xAAEAAAAAAAAAAAFUAywAgAEAAFYAKgJYAh4BDgEsAiwAWgGAAoAAoADUAIAAAAAAAAAAKwBVAIAAqwDVAQABKwAHAAAAAgBVAAADAAOrAAMABwAAMxEhESUhESFVAqv9qwIA%2FgADq%2FxVVQMAAAIAgADrAtUCFQADAAcAZRgBsAgQsAbUsAYQsAXUsAgQsAHUsAEQsADUsAYQsAc8sAUQsAQ8sAEQsAI8sAAQsAM8ALAIELAG1LAGELAH1LAHELAB1LABELAC1LAGELAFPLAHELAEPLABELAAPLACELADPDEwEyE1IR0BITWAAlX9qwJVAcBV1VVVAAEAgAAAAysDKwAPAEoYAbAQELEEA%2FawADyxCQP1sAs8sQYL9bAOPLERA%2BaxBwb9sA08ALEEAD%2BxCAX9sQMJPDyxBgXtsQACP7EMBf2xCwE8PLEOBf0xMBMVCQEVITUjFSEJASEVMzWAASv%2B1QKrK%2F4AASv%2B1QIAKwMrVf7%2F%2FoBVq1YBgAEBVqsAAAEAAAABAADVeM5BXw889QADBAD%2F%2F%2F%2F%2F1joTc%2F%2F%2F%2F%2F%2FWOhNzAAD%2FIASAA6sAAAAKAAIAAQAAAAAAAQAAA%2Bj%2FagAAF3AAAP%2B2BIAAAQAAAAAAAAAAAAAAAAAAAAMDUgBVA1YAgAOsAIAAAAAAAAAAKAAAALIAAAE7AAEAAAADAF4ABQAAAAAAAgCABAAAAAAABAAA3gAAAAAAAAAVAQIAAAAAAAAAAQASAAAAAAAAAAAAAgAOABIAAAAAAAAAAwAwACAAAAAAAAAABAASAFAAAAAAAAAABQAWAGIAAAAAAAAABgAJAHgAAAAAAAAACAAcAIEAAQAAAAAAAQASAAAAAQAAAAAAAgAOABIAAQAAAAAAAwAwACAAAQAAAAAABAASAFAAAQAAAAAABQAWAGIAAQAAAAAABgAJAHgAAQAAAAAACAAcAIEAAwABBAkAAQASAAAAAwABBAkAAgAOABIAAwABBAkAAwAwACAAAwABBAkABAASAFAAAwABBAkABQAWAGIAAwABBAkABgAJAHgAAwABBAkACAAcAIEATQBhAHQAaAAgAEYAbwBuAHQAUgBlAGcAdQBsAGEAcgBNAGEAdABoAHMAIABGAG8AcgAgAE0AbwByAGUAIABNAGEAdABoACAARgBvAG4AdABNAGEAdABoACAARgBvAG4AdABWAGUAcgBzAGkAbwBuACAAMQAuADBNYXRoX0ZvbnQATQBhAHQAaABzACAARgBvAHIAIABNAG8AcgBlAAADAAAAAAAAAfQA%2BgAAAAAAAAAAAAAAAAAAAAAAAAAAuQcRAACNhRgAsgAAABUUE7EAAT8%3D)format('truetype')%3Bfont-weight%3Anormal%3Bfont-style%3Anormal%3B%7D%3C%2Fstyle%3E%3C%2Fdefs%3E%3Ctext%20font-family%3D%22horizontalbf65417dcecc7f2b0006e%22%20font-size%3D%2213%22%20text-anchor%3D%22middle%22%20x%3D%223.5%22%20y%3D%2234%22%3E%26%23x23AF%3B%3C%2Ftext%3E%3Ctext%20font-family%3D%22horizontalbf65417dcecc7f2b0006e%22%20font-size%3D%2213%22%20text-anchor%3D%22middle%22%20x%3D%227.5%22%20y%3D%2234%22%3E%26%23x23AF%3B%3C%2Ftext%3E%3Ctext%20font-family%3D%22Times%20New%20Roman%22%20font-size%3D%2218%22%20font-style%3D%22italic%22%20text-anchor%3D%22middle%22%20x%3D%224.5%22%20y%3D%2242%22%3Ex%3C%2Ftext%3E%3Ctext%20font-family%3D%22math18a3c3e29d34cb201635f942203%22%20font-size%3D%2216%22%20text-anchor%3D%22middle%22%20x%3D%2218.5%22%20y%3D%2242%22%3E%3D%3C%2Ftext%3E%3Cline%20stroke%3D%22%23000000%22%20stroke-linecap%3D%22square%22%20stroke-width%3D%221%22%20x1%3D%2229.5%22%20x2%3D%2242.5%22%20y1%3D%2235.5%22%20y2%3D%2235.5%22%2F%3E%3Ctext%20font-family%3D%22Times%20New%20Roman%22%20font-size%3D%2218%22%20text-anchor%3D%22middle%22%20x%3D%2236.5%22%20y%3D%2228%22%3E1%3C%2Ftext%3E%3Ctext%20font-family%3D%22Times%20New%20Roman%22%20font-size%3D%2218%22%20font-style%3D%22italic%22%20text-anchor%3D%22middle%22%20x%3D%2235.5%22%20y%3D%2253%22%3En%3C%2Ftext%3E%3Ctext%20font-family%3D%22math18a3c3e29d34cb201635f942203%22%20font-size%3D%2224%22%20text-anchor%3D%22middle%22%20x%3D%2256.5%22%20y%3D%2245%22%3E%26%23x2211%3B%3C%2Ftext%3E%3Ctext%20font-family%3D%22Times%20New%20Roman%22%20font-size%3D%2218%22%20font-style%3D%22italic%22%20text-anchor%3D%22middle%22%20x%3D%2271.5%22%20y%3D%2242%22%3Ex%3C%2Ftext%3E%3Ctext%20font-family%3D%22Times%20New%20Roman%22%20font-size%3D%2213%22%20font-style%3D%22italic%22%20text-anchor%3D%22middle%22%20x%3D%2279.5%22%20y%3D%2250%22%3Ei%3C%2Ftext%3E%3Ctext%20font-family%3D%22math18a3c3e29d34cb201635f942203%22%20font-size%3D%2216%22%20text-anchor%3D%22middle%22%20x%3D%2290.5%22%20y%3D%2242%22%3E%3D%3C%2Ftext%3E%3Cline%20stroke%3D%22%23000000%22%20stroke-linecap%3D%22square%22%20stroke-width%3D%221%22%20x1%3D%22101.5%22%20x2%3D%22146.5%22%20y1%3D%2235.5%22%20y2%3D%2235.5%22%2F%3E%3Ctext%20font-family%3D%22math18a3c3e29d34cb201635f942203%22%20font-size%3D%2224%22%20text-anchor%3D%22middle%22%20x%3D%22114.5%22%20y%3D%2223%22%3E%26%23x2211%3B%3C%2Ftext%3E%3Ctext%20font-family%3D%22Times%20New%20Roman%22%20font-size%3D%2218%22%20font-style%3D%22italic%22%20text-anchor%3D%22middle%22%20x%3D%22134.5%22%20y%3D%2220%22%3Ex%3C%2Ftext%3E%3Ctext%20font-family%3D%22Times%20New%20Roman%22%20font-size%3D%2213%22%20font-style%3D%22italic%22%20text-anchor%3D%22middle%22%20x%3D%22142.5%22%20y%3D%2228%22%3Ei%3C%2Ftext%3E%3Ctext%20font-family%3D%22Times%20New%20Roman%22%20font-size%3D%2218%22%20font-style%3D%22italic%22%20text-anchor%3D%22middle%22%20x%3D%22123.5%22%20y%3D%2253%22%3En%3C%2Ftext%3E%3C%2Fsvg%3E)
and where
format('truetype')%3Bfont-weight%3Anormal%3Bfont-style%3Anormal%3B%7D%40font-face%7Bfont-family%3A'math1bfb9763c2a4e2f59808a77994b'%3Bsrc%3Aurl(data%3Afont%2Ftruetype%3Bcharset%3Dutf-8%3Bbase64%2CAAEAAAAMAIAAAwBAT1MvMi7iBBMAAADMAAAATmNtYXDEvmKUAAABHAAAAERjdnQgDVUNBwAAAWAAAAA6Z2x5ZoPi2VsAAAGcAAABhWhlYWQQC2qxAAADJAAAADZoaGVhCGsXSAAAA1wAAAAkaG10eE2rRkcAAAOAAAAAEGxvY2EAHTwYAAADkAAAABRtYXhwBT0FPgAAA6QAAAAgbmFtZaBxlY4AAAPEAAABn3Bvc3QB9wD6AAAFZAAAACBwcmVwa1uragAABYQAAAAUAAADSwGQAAUAAAQABAAAAAAABAAEAAAAAAAAAQEAAAAAAAAAAAAAAAAAAAAAAAAAAAAAAAAAAAAAACAgICAAAAAg1UADev96AAAD6ACWAAAAAAACAAEAAQAAABQAAwABAAAAFAAEADAAAAAIAAgAAgAAAD0iESIS%2F%2F8AAAA9IhEiEv%2F%2F%2F8Td8d3xAAEAAAAAAAAAAAAAAVQDLACAAQAAVgAqAlgCHgEOASwCLABaAYACgACgANQAgAAAAAAAAAArAFUAgACrANUBAAErAAcAAAACAFUAAAMAA6sAAwAHAAAzESERJSERIVUCq%2F2rAgD%2BAAOr%2FFVVAwAAAgCAAOsC1QIVAAMABwBlGAGwCBCwBtSwBhCwBdSwCBCwAdSwARCwANSwBhCwBzywBRCwBDywARCwAjywABCwAzwAsAgQsAbUsAYQsAfUsAcQsAHUsAEQsALUsAYQsAU8sAcQsAQ8sAEQsAA8sAIQsAM8MTATITUhHQEhNYACVf2rAlUBwFXVVVUAAQCAAAADKwMrAA8AShgBsBAQsQQD9rAAPLEJA%2FWwCzyxBgv1sA48sRED5rEHBv2wDTwAsQQAP7EIBf2xAwk8PLEGBe2xAAI%2FsQwF%2FbELATw8sQ4F%2FTEwExUJARUhNSMVIQkBIRUzNYABK%2F7VAqsr%2FgABK%2F7VAgArAytV%2Fv%2F%2BgFWrVgGAAQFWqwABAIABVQLVAasAAwAwGAGwBBCxAAP2sAM8sQIH9bABPLEFA%2BYAsQAAExCxAAblsQABExCwATyxAwX1sAI8EyEVIYACVf2rAatWAAAAAAEAAAABAADVeM5BXw889QADBAD%2F%2F%2F%2F%2F1joTc%2F%2F%2F%2F%2F%2FWOhNzAAD%2FIASAA6sAAAAKAAIAAQAAAAAAAQAAA%2Bj%2FagAAF3AAAP%2B2BIAAAQAAAAAAAAAAAAAAAAAAAAQDUgBVA1YAgAOsAIADVgCAAAAAAAAAACgAAACyAAABOwAAAYUAAQAAAAQAXgAFAAAAAAACAIAEAAAAAAAEAADeAAAAAAAAABUBAgAAAAAAAAABABIAAAAAAAAAAAACAA4AEgAAAAAAAAADADAAIAAAAAAAAAAEABIAUAAAAAAAAAAFABYAYgAAAAAAAAAGAAkAeAAAAAAAAAAIABwAgQABAAAAAAABABIAAAABAAAAAAACAA4AEgABAAAAAAADADAAIAABAAAAAAAEABIAUAABAAAAAAAFABYAYgABAAAAAAAGAAkAeAABAAAAAAAIABwAgQADAAEECQABABIAAAADAAEECQACAA4AEgADAAEECQADADAAIAADAAEECQAEABIAUAADAAEECQAFABYAYgADAAEECQAGAAkAeAADAAEECQAIABwAgQBNAGEAdABoACAARgBvAG4AdABSAGUAZwB1AGwAYQByAE0AYQB0AGgAcwAgAEYAbwByACAATQBvAHIAZQAgAE0AYQB0AGgAIABGAG8AbgB0AE0AYQB0AGgAIABGAG8AbgB0AFYAZQByAHMAaQBvAG4AIAAxAC4AME1hdGhfRm9udABNAGEAdABoAHMAIABGAG8AcgAgAE0AbwByAGUAAAMAAAAAAAAB9AD6AAAAAAAAAAAAAAAAAAAAAAAAAAC5BxEAAI2FGACyAAAAFRQTsQABPw%3D%3D)format('truetype')%3Bfont-weight%3Anormal%3Bfont-style%3Anormal%3B%7D%40font-face%7Bfont-family%3A'round_brackets22549f92a457f2409'%3Bsrc%3Aurl(data%3Afont%2Ftruetype%3Bcharset%3Dutf-8%3Bbase64%2CAAEAAAAMAIAAAwBAT1MvMjxkLiAAAADMAAAATmNtYXDf7xCrAAABHAAAADxjdnQgBAkDLgAAAVgAAAASZ2x5Zr5a4R4AAAFsAAABKWhlYWQO9ymoAAACmAAAADZoaGVhDVUVZQAAAtAAAAAkaG10eCFnAAIAAAL0AAAADGxvY2EAAARdAAADAAAAABBtYXhwBIgEWQAAAxAAAAAgbmFtZXHO2TgAAAMwAAACOXBvc3QEagIzAAAFbAAAACBwcmVwupWEAAAABYwAAAAHAAAGrgGQAAUAAAgACAAAAAAACAAIAAAAAAAAAQIAAAAAAAAAAAAAAAAAAAAAAAAAAAAAAAAAAAAAACAgICAAAAAo8AMGe%2F57AAAIzgIPAAAAAAACAAEAAQAAABQAAwABAAAAFAAEACgAAAAGAAQAAQACACgAKf%2F%2FAAAAKAAp%2F%2F%2F%2F2f%2FZAAEAAAAAAAAAAAFUAFYBAAAsAKgDgAAyAAcAAAACAAAAKgDVA1UAAwAHAAA1MxEjEyMRM9XVq4CAKgMr%2FQAC1QABAAD%2BYAJQCGAACQBNGAGwChCwA9SwAxCwAtSwChCwBdSwBRCwANSwAxCwBzywAhCwCDwAsAoQsAPUsAMQsAfUsAoQsAXUsAoQsADUsAMQsAI8sAcQsAg8MTATAgEzABMQASMABAQBwJD%2BPAQBwJD%2BRANg%2FHD%2BkAFwA5ADoAFg%2FqAAAQAA%2FmACUAhgAAkATRgBsAoQsAPUsAMQsALUsAoQsAXUsAUQsADUsAMQsAc8sAIQsAg8ALAKELAD1LADELAH1LAKELAF1LAKELAA1LADELACPLAHELAIPDEwARIBIwADEAEzAAJMBP5AkAHEBP5AkAG8A2D8cP6QAXADkAOgAWD%2BoAAAAAABAAAAAQAALiwXwl8PPPUAAwgA%2F%2F%2F%2F%2F9Wt7vT%2F%2F%2F%2F%2F1a3u9AAA%2FmAEhAhgAAAACgACAAEAAAAAAAEAAAjO%2FfEAABdwAAD%2F%2FgSEAAEAAAAAAAAAAAAAAAAAAAADANUAAAJQAAACUAAAAAAAAAAAACQAAACmAAABKQABAAAAAwAKAAIAAAAAAAIAgAQAAAAAAAQAAE0AAAAAAAAAFQECAAAAAAAAAAEAPgAAAAAAAAAAAAIADgA%2BAAAAAAAAAAMAXABMAAAAAAAAAAQAPgCoAAAAAAAAAAUAFgDmAAAAAAAAAAYAHwD8AAAAAAAAAAgAHAEbAAEAAAAAAAEAPgAAAAEAAAAAAAIADgA%2BAAEAAAAAAAMAXABMAAEAAAAAAAQAPgCoAAEAAAAAAAUAFgDmAAEAAAAAAAYAHwD8AAEAAAAAAAgAHAEbAAMAAQQJAAEAPgAAAAMAAQQJAAIADgA%2BAAMAAQQJAAMAXABMAAMAAQQJAAQAPgCoAAMAAQQJAAUAFgDmAAMAAQQJAAYAHwD8AAMAAQQJAAgAHAEbAFIAbwB1AG4AZAAgAGIAcgBhAGMAawBlAHQAcwAgAHcAaQB0AGgAIABhAHMAYwBlAG4AdAAgADIAMgA1ADQAUgBlAGcAdQBsAGEAcgBNAGEAdABoAHMAIABGAG8AcgAgAE0AbwByAGUAIABSAG8AdQBuAGQAIABiAHIAYQBjAGsAZQB0AHMAIAB3AGkAdABoACAAYQBzAGMAZQBuAHQAIAAyADIANQA0AFIAbwB1AG4AZAAgAGIAcgBhAGMAawBlAHQAcwAgAHcAaQB0AGgAIABhAHMAYwBlAG4AdAAgADIAMgA1ADQAVgBlAHIAcwBpAG8AbgAgADIALgAwUm91bmRfYnJhY2tldHNfd2l0aF9hc2NlbnRfMjI1NABNAGEAdABoAHMAIABGAG8AcgAgAE0AbwByAGUAAAAAAwAAAAAAAARnAjMAAAAAAAAAAAAAAAAAAAAAAAAAALkH%2FwABjYUA)format('truetype')%3Bfont-weight%3Anormal%3Bfont-style%3Anormal%3B%7D%3C%2Fstyle%3E%3C%2Fdefs%3E%3Ctext%20font-family%3D%22Times%20New%20Roman%22%20font-size%3D%2218%22%20font-style%3D%22italic%22%20text-anchor%3D%22middle%22%20x%3D%223.5%22%20y%3D%2246%22%3Es%3C%2Ftext%3E%3Ctext%20font-family%3D%22Times%20New%20Roman%22%20font-size%3D%2213%22%20font-style%3D%22italic%22%20text-anchor%3D%22middle%22%20x%3D%2211.5%22%20y%3D%2254%22%3Ey%3C%2Ftext%3E%3Ctext%20font-family%3D%22math1bfb9763c2a4e2f59808a77994b%22%20font-size%3D%2216%22%20text-anchor%3D%22middle%22%20x%3D%2224.5%22%20y%3D%2246%22%3E%3D%3C%2Ftext%3E%3Cpolyline%20fill%3D%22none%22%20points%3D%2214%2C-53%2013%2C-53%206%2C0%202%2C-21%22%20stroke%3D%22%23000000%22%20stroke-linecap%3D%22square%22%20stroke-width%3D%221%22%20transform%3D%22translate(33.5%2C63.5)%22%2F%3E%3Cpolyline%20fill%3D%22none%22%20points%3D%226%2C0%202%2C-21%201%2C-18%22%20stroke%3D%22%23000000%22%20stroke-linecap%3D%22square%22%20stroke-width%3D%221%22%20transform%3D%22translate(33.5%2C63.5)%22%2F%3E%3Cline%20stroke%3D%22%23000000%22%20stroke-linecap%3D%22square%22%20stroke-width%3D%221%22%20x1%3D%2247.5%22%20x2%3D%22185.5%22%20y1%3D%2210.5%22%20y2%3D%2210.5%22%2F%3E%3Cline%20stroke%3D%22%23000000%22%20stroke-linecap%3D%22square%22%20stroke-width%3D%221%22%20x1%3D%2251.5%22%20x2%3D%2290.5%22%20y1%3D%2239.5%22%20y2%3D%2239.5%22%2F%3E%3Ctext%20font-family%3D%22Times%20New%20Roman%22%20font-size%3D%2218%22%20text-anchor%3D%22middle%22%20x%3D%2271.5%22%20y%3D%2232%22%3E1%3C%2Ftext%3E%3Ctext%20font-family%3D%22Times%20New%20Roman%22%20font-size%3D%2218%22%20font-style%3D%22italic%22%20text-anchor%3D%22middle%22%20x%3D%2257.5%22%20y%3D%2257%22%3En%3C%2Ftext%3E%3Ctext%20font-family%3D%22math1bfb9763c2a4e2f59808a77994b%22%20font-size%3D%2216%22%20text-anchor%3D%22middle%22%20x%3D%2271.5%22%20y%3D%2257%22%3E%26%23x2212%3B%3C%2Ftext%3E%3Ctext%20font-family%3D%22Times%20New%20Roman%22%20font-size%3D%2218%22%20text-anchor%3D%22middle%22%20x%3D%2284.5%22%20y%3D%2257%22%3E1%3C%2Ftext%3E%3Ctext%20font-family%3D%22math1bfb9763c2a4e2f59808a77994b%22%20font-size%3D%2224%22%20text-anchor%3D%22middle%22%20x%3D%22104.5%22%20y%3D%2249%22%3E%26%23x2211%3B%3C%2Ftext%3E%3Ctext%20font-family%3D%22round_brackets22549f92a457f2409%22%20font-size%3D%2218%22%20text-anchor%3D%22middle%22%20x%3D%22118.5%22%20y%3D%2250%22%3E(%3C%2Ftext%3E%3Ctext%20font-family%3D%22round_brackets22549f92a457f2409%22%20font-size%3D%2218%22%20text-anchor%3D%22middle%22%20x%3D%22169.5%22%20y%3D%2250%22%3E)%3C%2Ftext%3E%3Ctext%20font-family%3D%22Times%20New%20Roman%22%20font-size%3D%2218%22%20font-style%3D%22italic%22%20text-anchor%3D%22middle%22%20x%3D%22125.5%22%20y%3D%2246%22%3Ey%3C%2Ftext%3E%3Ctext%20font-family%3D%22Times%20New%20Roman%22%20font-size%3D%2213%22%20font-style%3D%22italic%22%20text-anchor%3D%22middle%22%20x%3D%22133.5%22%20y%3D%2254%22%3Ei%3C%2Ftext%3E%3Ctext%20font-family%3D%22math1bfb9763c2a4e2f59808a77994b%22%20font-size%3D%2216%22%20text-anchor%3D%22middle%22%20x%3D%22144.5%22%20y%3D%2246%22%3E%26%23x2212%3B%3C%2Ftext%3E%3Ctext%20font-family%3D%22horizontalbf65417dcecc7f2b0006e%22%20font-size%3D%2213%22%20text-anchor%3D%22middle%22%20x%3D%22156.5%22%20y%3D%2238%22%3E%26%23x23AF%3B%3C%2Ftext%3E%3Ctext%20font-family%3D%22horizontalbf65417dcecc7f2b0006e%22%20font-size%3D%2213%22%20text-anchor%3D%22middle%22%20x%3D%22160.5%22%20y%3D%2238%22%3E%26%23x23AF%3B%3C%2Ftext%3E%3Ctext%20font-family%3D%22Times%20New%20Roman%22%20font-size%3D%2218%22%20font-style%3D%22italic%22%20text-anchor%3D%22middle%22%20x%3D%22157.5%22%20y%3D%2246%22%3Ey%3C%2Ftext%3E%3Ctext%20font-family%3D%22Times%20New%20Roman%22%20font-size%3D%2213%22%20text-anchor%3D%22middle%22%20x%3D%22176.5%22%20y%3D%2240%22%3E2%3C%2Ftext%3E%3Ctext%20font-family%3D%22math1bfb9763c2a4e2f59808a77994b%22%20font-size%3D%2216%22%20text-anchor%3D%22middle%22%20x%3D%22194.5%22%20y%3D%2246%22%3E%3D%3C%2Ftext%3E%3Cpolyline%20fill%3D%22none%22%20points%3D%2214%2C-57%2013%2C-57%206%2C0%202%2C-23%22%20stroke%3D%22%23000000%22%20stroke-linecap%3D%22square%22%20stroke-width%3D%221%22%20transform%3D%22translate(203.5%2C60.5)%22%2F%3E%3Cpolyline%20fill%3D%22none%22%20points%3D%226%2C0%202%2C-23%201%2C-20%22%20stroke%3D%22%23000000%22%20stroke-linecap%3D%22square%22%20stroke-width%3D%221%22%20transform%3D%22translate(203.5%2C60.5)%22%2F%3E%3Cline%20stroke%3D%22%23000000%22%20stroke-linecap%3D%22square%22%20stroke-width%3D%221%22%20x1%3D%22217.5%22%20x2%3D%22324.5%22%20y1%3D%223.5%22%20y2%3D%223.5%22%2F%3E%3Cline%20stroke%3D%22%23000000%22%20stroke-linecap%3D%22square%22%20stroke-width%3D%221%22%20x1%3D%22221.5%22%20x2%3D%22320.5%22%20y1%3D%2239.5%22%20y2%3D%2239.5%22%2F%3E%3Ctext%20font-family%3D%22math1bfb9763c2a4e2f59808a77994b%22%20font-size%3D%2224%22%20text-anchor%3D%22middle%22%20x%3D%22234.5%22%20y%3D%2227%22%3E%26%23x2211%3B%3C%2Ftext%3E%3Ctext%20font-family%3D%22round_brackets22549f92a457f2409%22%20font-size%3D%2218%22%20text-anchor%3D%22middle%22%20x%3D%22253.5%22%20y%3D%2228%22%3E(%3C%2Ftext%3E%3Ctext%20font-family%3D%22round_brackets22549f92a457f2409%22%20font-size%3D%2218%22%20text-anchor%3D%22middle%22%20x%3D%22304.5%22%20y%3D%2228%22%3E)%3C%2Ftext%3E%3Ctext%20font-family%3D%22Times%20New%20Roman%22%20font-size%3D%2218%22%20font-style%3D%22italic%22%20text-anchor%3D%22middle%22%20x%3D%22260.5%22%20y%3D%2224%22%3Ey%3C%2Ftext%3E%3Ctext%20font-family%3D%22Times%20New%20Roman%22%20font-size%3D%2213%22%20font-style%3D%22italic%22%20text-anchor%3D%22middle%22%20x%3D%22268.5%22%20y%3D%2232%22%3Ei%3C%2Ftext%3E%3Ctext%20font-family%3D%22math1bfb9763c2a4e2f59808a77994b%22%20font-size%3D%2216%22%20text-anchor%3D%22middle%22%20x%3D%22279.5%22%20y%3D%2224%22%3E%26%23x2212%3B%3C%2Ftext%3E%3Ctext%20font-family%3D%22horizontalbf65417dcecc7f2b0006e%22%20font-size%3D%2213%22%20text-anchor%3D%22middle%22%20x%3D%22291.5%22%20y%3D%2216%22%3E%26%23x23AF%3B%3C%2Ftext%3E%3Ctext%20font-family%3D%22horizontalbf65417dcecc7f2b0006e%22%20font-size%3D%2213%22%20text-anchor%3D%22middle%22%20x%3D%22295.5%22%20y%3D%2216%22%3E%26%23x23AF%3B%3C%2Ftext%3E%3Ctext%20font-family%3D%22Times%20New%20Roman%22%20font-size%3D%2218%22%20font-style%3D%22italic%22%20text-anchor%3D%22middle%22%20x%3D%22292.5%22%20y%3D%2224%22%3Ey%3C%2Ftext%3E%3Ctext%20font-family%3D%22Times%20New%20Roman%22%20font-size%3D%2213%22%20text-anchor%3D%22middle%22%20x%3D%22311.5%22%20y%3D%2218%22%3E2%3C%2Ftext%3E%3Ctext%20font-family%3D%22Times%20New%20Roman%22%20font-size%3D%2218%22%20font-style%3D%22italic%22%20text-anchor%3D%22middle%22%20x%3D%22257.5%22%20y%3D%2257%22%3En%3C%2Ftext%3E%3Ctext%20font-family%3D%22math1bfb9763c2a4e2f59808a77994b%22%20font-size%3D%2216%22%20text-anchor%3D%22middle%22%20x%3D%22271.5%22%20y%3D%2257%22%3E%26%23x2212%3B%3C%2Ftext%3E%3Ctext%20font-family%3D%22Times%20New%20Roman%22%20font-size%3D%2218%22%20text-anchor%3D%22middle%22%20x%3D%22284.5%22%20y%3D%2257%22%3E1%3C%2Ftext%3E%3C%2Fsvg%3E) is the sample standard deviation of the
is the sample standard deviation of the  -values
and
format('truetype')%3Bfont-weight%3Anormal%3Bfont-style%3Anormal%3B%7D%40font-face%7Bfont-family%3A'math18a3c3e29d34cb201635f942203'%3Bsrc%3Aurl(data%3Afont%2Ftruetype%3Bcharset%3Dutf-8%3Bbase64%2CAAEAAAAMAIAAAwBAT1MvMi7iBBMAAADMAAAATmNtYXDEvmKUAAABHAAAADxjdnQgDVUNBwAAAVgAAAA6Z2x5ZoPi2VsAAAGUAAABO2hlYWQQC2qxAAAC0AAAADZoaGVhCGsXSAAAAwgAAAAkaG10eE2rRkcAAAMsAAAADGxvY2EAHTwYAAADOAAAABBtYXhwBT0FPgAAA0gAAAAgbmFtZaBxlY4AAANoAAABn3Bvc3QB9wD6AAAFCAAAACBwcmVwa1uragAABSgAAAAUAAADSwGQAAUAAAQABAAAAAAABAAEAAAAAAAAAQEAAAAAAAAAAAAAAAAAAAAAAAAAAAAAAAAAAAAAACAgICAAAAAg1UADev96AAAD6ACWAAAAAAACAAEAAQAAABQAAwABAAAAFAAEACgAAAAGAAQAAQACAD0iEf%2F%2FAAAAPSIR%2F%2F%2F%2FxN3xAAEAAAAAAAAAAAFUAywAgAEAAFYAKgJYAh4BDgEsAiwAWgGAAoAAoADUAIAAAAAAAAAAKwBVAIAAqwDVAQABKwAHAAAAAgBVAAADAAOrAAMABwAAMxEhESUhESFVAqv9qwIA%2FgADq%2FxVVQMAAAIAgADrAtUCFQADAAcAZRgBsAgQsAbUsAYQsAXUsAgQsAHUsAEQsADUsAYQsAc8sAUQsAQ8sAEQsAI8sAAQsAM8ALAIELAG1LAGELAH1LAHELAB1LABELAC1LAGELAFPLAHELAEPLABELAAPLACELADPDEwEyE1IR0BITWAAlX9qwJVAcBV1VVVAAEAgAAAAysDKwAPAEoYAbAQELEEA%2FawADyxCQP1sAs8sQYL9bAOPLERA%2BaxBwb9sA08ALEEAD%2BxCAX9sQMJPDyxBgXtsQACP7EMBf2xCwE8PLEOBf0xMBMVCQEVITUjFSEJASEVMzWAASv%2B1QKrK%2F4AASv%2B1QIAKwMrVf7%2F%2FoBVq1YBgAEBVqsAAAEAAAABAADVeM5BXw889QADBAD%2F%2F%2F%2F%2F1joTc%2F%2F%2F%2F%2F%2FWOhNzAAD%2FIASAA6sAAAAKAAIAAQAAAAAAAQAAA%2Bj%2FagAAF3AAAP%2B2BIAAAQAAAAAAAAAAAAAAAAAAAAMDUgBVA1YAgAOsAIAAAAAAAAAAKAAAALIAAAE7AAEAAAADAF4ABQAAAAAAAgCABAAAAAAABAAA3gAAAAAAAAAVAQIAAAAAAAAAAQASAAAAAAAAAAAAAgAOABIAAAAAAAAAAwAwACAAAAAAAAAABAASAFAAAAAAAAAABQAWAGIAAAAAAAAABgAJAHgAAAAAAAAACAAcAIEAAQAAAAAAAQASAAAAAQAAAAAAAgAOABIAAQAAAAAAAwAwACAAAQAAAAAABAASAFAAAQAAAAAABQAWAGIAAQAAAAAABgAJAHgAAQAAAAAACAAcAIEAAwABBAkAAQASAAAAAwABBAkAAgAOABIAAwABBAkAAwAwACAAAwABBAkABAASAFAAAwABBAkABQAWAGIAAwABBAkABgAJAHgAAwABBAkACAAcAIEATQBhAHQAaAAgAEYAbwBuAHQAUgBlAGcAdQBsAGEAcgBNAGEAdABoAHMAIABGAG8AcgAgAE0AbwByAGUAIABNAGEAdABoACAARgBvAG4AdABNAGEAdABoACAARgBvAG4AdABWAGUAcgBzAGkAbwBuACAAMQAuADBNYXRoX0ZvbnQATQBhAHQAaABzACAARgBvAHIAIABNAG8AcgBlAAADAAAAAAAAAfQA%2BgAAAAAAAAAAAAAAAAAAAAAAAAAAuQcRAACNhRgAsgAAABUUE7EAAT8%3D)format('truetype')%3Bfont-weight%3Anormal%3Bfont-style%3Anormal%3B%7D%3C%2Fstyle%3E%3C%2Fdefs%3E%3Ctext%20font-family%3D%22horizontalbf65417dcecc7f2b0006e%22%20font-size%3D%2213%22%20text-anchor%3D%22middle%22%20x%3D%223.5%22%20y%3D%2234%22%3E%26%23x23AF%3B%3C%2Ftext%3E%3Ctext%20font-family%3D%22horizontalbf65417dcecc7f2b0006e%22%20font-size%3D%2213%22%20text-anchor%3D%22middle%22%20x%3D%227.5%22%20y%3D%2234%22%3E%26%23x23AF%3B%3C%2Ftext%3E%3Ctext%20font-family%3D%22Times%20New%20Roman%22%20font-size%3D%2218%22%20font-style%3D%22italic%22%20text-anchor%3D%22middle%22%20x%3D%224.5%22%20y%3D%2242%22%3Ey%3C%2Ftext%3E%3Ctext%20font-family%3D%22math18a3c3e29d34cb201635f942203%22%20font-size%3D%2216%22%20text-anchor%3D%22middle%22%20x%3D%2218.5%22%20y%3D%2242%22%3E%3D%3C%2Ftext%3E%3Cline%20stroke%3D%22%23000000%22%20stroke-linecap%3D%22square%22%20stroke-width%3D%221%22%20x1%3D%2229.5%22%20x2%3D%2242.5%22%20y1%3D%2235.5%22%20y2%3D%2235.5%22%2F%3E%3Ctext%20font-family%3D%22Times%20New%20Roman%22%20font-size%3D%2218%22%20text-anchor%3D%22middle%22%20x%3D%2236.5%22%20y%3D%2228%22%3E1%3C%2Ftext%3E%3Ctext%20font-family%3D%22Times%20New%20Roman%22%20font-size%3D%2218%22%20font-style%3D%22italic%22%20text-anchor%3D%22middle%22%20x%3D%2235.5%22%20y%3D%2253%22%3En%3C%2Ftext%3E%3Ctext%20font-family%3D%22math18a3c3e29d34cb201635f942203%22%20font-size%3D%2224%22%20text-anchor%3D%22middle%22%20x%3D%2256.5%22%20y%3D%2245%22%3E%26%23x2211%3B%3C%2Ftext%3E%3Ctext%20font-family%3D%22Times%20New%20Roman%22%20font-size%3D%2218%22%20font-style%3D%22italic%22%20text-anchor%3D%22middle%22%20x%3D%2271.5%22%20y%3D%2242%22%3Ey%3C%2Ftext%3E%3Ctext%20font-family%3D%22Times%20New%20Roman%22%20font-size%3D%2213%22%20font-style%3D%22italic%22%20text-anchor%3D%22middle%22%20x%3D%2279.5%22%20y%3D%2250%22%3Ei%3C%2Ftext%3E%3Ctext%20font-family%3D%22math18a3c3e29d34cb201635f942203%22%20font-size%3D%2216%22%20text-anchor%3D%22middle%22%20x%3D%2290.5%22%20y%3D%2242%22%3E%3D%3C%2Ftext%3E%3Cline%20stroke%3D%22%23000000%22%20stroke-linecap%3D%22square%22%20stroke-width%3D%221%22%20x1%3D%22101.5%22%20x2%3D%22146.5%22%20y1%3D%2235.5%22%20y2%3D%2235.5%22%2F%3E%3Ctext%20font-family%3D%22math18a3c3e29d34cb201635f942203%22%20font-size%3D%2224%22%20text-anchor%3D%22middle%22%20x%3D%22114.5%22%20y%3D%2223%22%3E%26%23x2211%3B%3C%2Ftext%3E%3Ctext%20font-family%3D%22Times%20New%20Roman%22%20font-size%3D%2218%22%20font-style%3D%22italic%22%20text-anchor%3D%22middle%22%20x%3D%22134.5%22%20y%3D%2220%22%3Ey%3C%2Ftext%3E%3Ctext%20font-family%3D%22Times%20New%20Roman%22%20font-size%3D%2213%22%20font-style%3D%22italic%22%20text-anchor%3D%22middle%22%20x%3D%22142.5%22%20y%3D%2228%22%3Ei%3C%2Ftext%3E%3Ctext%20font-family%3D%22Times%20New%20Roman%22%20font-size%3D%2218%22%20font-style%3D%22italic%22%20text-anchor%3D%22middle%22%20x%3D%22123.5%22%20y%3D%2253%22%3En%3C%2Ftext%3E%3C%2Fsvg%3E)
However, in practice, the correlation coefficient is found using technology
e.g. using a calculator
Examiner Tips and Tricks
The formulas for ![]() ,
, ![]() and
and ![]() are given in the exam, but the formulas for
are given in the exam, but the formulas for ![]() and
and ![]() are not (though they can easily be formed by looking at
are not (though they can easily be formed by looking at ![]() and
and ![]() ).
).
What else do I need to know about correlation coefficients?
You need to know that correlation coefficients,
, arealways in the range
format('truetype')%3Bfont-weight%3Anormal%3Bfont-style%3Anormal%3B%7D%3C%2Fstyle%3E%3C%2Fdefs%3E%3Ctext%20font-family%3D%22math1ca1a29523a31a98778ef30b146%22%20font-size%3D%2216%22%20text-anchor%3D%22middle%22%20x%3D%226.5%22%20y%3D%2216%22%3E%26%23x2212%3B%3C%2Ftext%3E%3Ctext%20font-family%3D%22Times%20New%20Roman%22%20font-size%3D%2218%22%20text-anchor%3D%22middle%22%20x%3D%2217.5%22%20y%3D%2216%22%3E1%3C%2Ftext%3E%3Ctext%20font-family%3D%22math1ca1a29523a31a98778ef30b146%22%20font-size%3D%2216%22%20text-anchor%3D%22middle%22%20x%3D%2230.5%22%20y%3D%2216%22%3E%26%23x2264%3B%3C%2Ftext%3E%3Ctext%20font-family%3D%22Times%20New%20Roman%22%20font-size%3D%2218%22%20font-style%3D%22italic%22%20text-anchor%3D%22middle%22%20x%3D%2241.5%22%20y%3D%2216%22%3Er%3C%2Ftext%3E%3Ctext%20font-family%3D%22math1ca1a29523a31a98778ef30b146%22%20font-size%3D%2216%22%20text-anchor%3D%22middle%22%20x%3D%2253.5%22%20y%3D%2216%22%3E%26%23x2264%3B%3C%2Ftext%3E%3Ctext%20font-family%3D%22Times%20New%20Roman%22%20font-size%3D%2218%22%20text-anchor%3D%22middle%22%20x%3D%2265.5%22%20y%3D%2216%22%3E1%3C%2Ftext%3E%3C%2Fsvg%3E)
only measure strengths of linear relationships
so
has no linear association, but may have a non-linear (curved) association
independent of units
changing the units of the
and variables does not affect
affected by outliers
not affected by swapping the axes
i.e. plotting
values on the axis and vice versa
What does the phrase "correlation does not imply causation" mean?
If two variables appear to correlate, it does not mean that one variable causes changes in the other variable
For example, each day you record the height of a sunflower and the weight of a puppy
As the height of the sunflower increases, the weight of the puppy increases
This shows a positive correlation
But you cannot claim that:
'increasing the heights of sunflowers causes puppies to weigh more'
or 'heavier puppies lead to taller sunflowers'!
Both variables are actually increasing separately due to a third variable
In this case, time

Unlock more, it's free!
Join the 100,000+ Students that ❤️ Save My Exams
the (exam) results speak for themselves:

Was this revision note helpful?
