Comparing Normal Distributions (College Board AP® Statistics): Study Guide
Comparing normal distributions
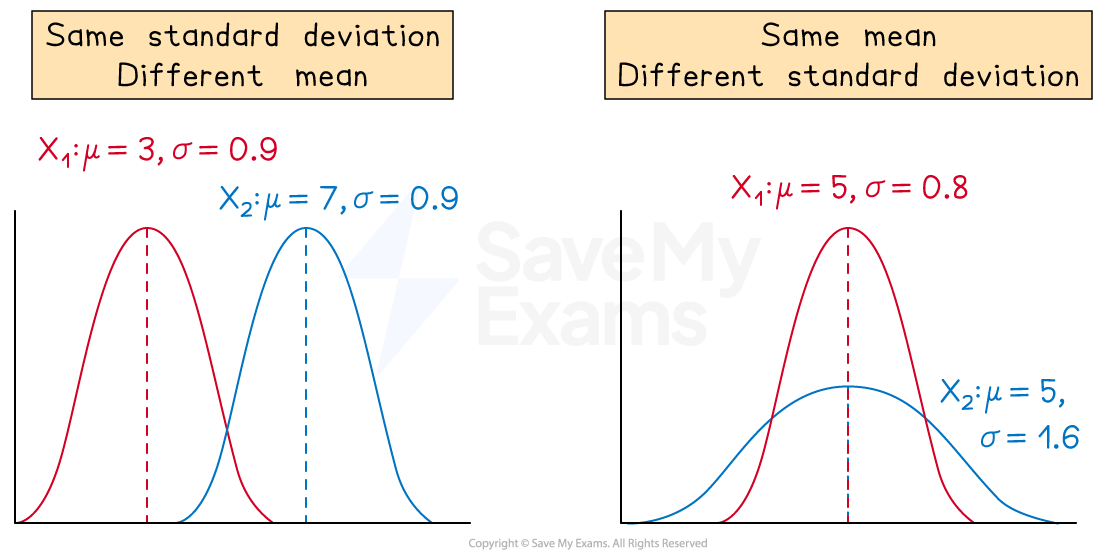
Two normal distributions can be compared by examining their parameters
the mean,
and the standard deviation,
Two normal distributions with the same mean but different standard deviations will lie in the same position but have different shapes
The distribution with the smaller standard deviation will be taller and steeper
The distribution with the greater standard deviation will be shorter and wider
Two normal distributions with the same standard deviation but different means will have the same shape but lie in different positions
The distribution with the smaller mean will be positioned to the left
The distribution with the greater mean will be positioned to the right

Worked Example
Factory A manufactures batteries with a mean battery life of 4.1 hours and standard deviation of 0.3 hours. Factory B manufactures a different brand of batteries with a mean battery life of 3.7 hours and standard deviation of 0.2 hours. Compare the different brands of batteries that are manufactured in the two factories.
Answer:
Compare the mean battery life for the batteries manufactured in each factory
Compare the standard deviation of the battery life for the batteries manufactured in each factory
Compare the two parameters using the context of the question
The mean battery life of the batteries manufactured in factory A (4.1 hours) is greater than the mean battery life of those manufactured in factory B (3.7 hours)
This means that on average the batteries from factory A will last longer
The standard deviation of the battery life of the batteries manufactured in factory A (0.3 hours) is also greater than the standard deviation of the battery life of those manufactured in factory B (0.2 hours)
This means that there is a greater variation in the battery life of those batteries manufacture in factory A than those from factory B
Comparing z-scores
Two values can be compared by examining their
-scores
The
-score indicates the number of standard deviations that a data point lies from the mean of its distribution
When comparing two values within the same data set
the data point with the greater absolute value
-score lies further from the mean
When comparing two values in different data sets
the data point with the greater absolute value
-score has a greater relative position from its mean than the other data point has from its mean
Worked Example
A math major at college decided to complete a study on the recovery time after completing different types of exercise. She measured the time taken in minutes for the heart rate of an individual student to return to its resting rate after completing 10 mins of swimming. She then repeated this measurement on the same student after they completed 10 minutes of running on another day. This study was completed for a large sample of students.
The summary statistics for the study are as follows:
Activity | Mean | Standard Deviation |
Swimming | 3.7 | 0.8 |
Running | 4.2 | 1.1 |
Kenzie had a recovery time of 3.2 minutes after swimming and 3.6 minutes after running.
For which activity did she recover relatively quicker from?
Answer:
Kenzie recovered from both activities in less than the mean time but as the distributions are different the -scores must be compared
Find the -score for each activity using
Compare absolute values of the two -scores
The absolute value of the -score for swimming is greater than the value for running, so the recovery time after swimming is a greater number of standard deviations from the mean
As both actual -scores are negative, they are both below the mean, so the lower value for swimming means that the recovery time is further below the mean than the value for running
Kenzie recovers relatively quicker from swimming than from running

Unlock more, it's free!
Did this page help you?