Skewness of Data (College Board AP® Statistics): Study Guide

Skewness of data
What is skewness?
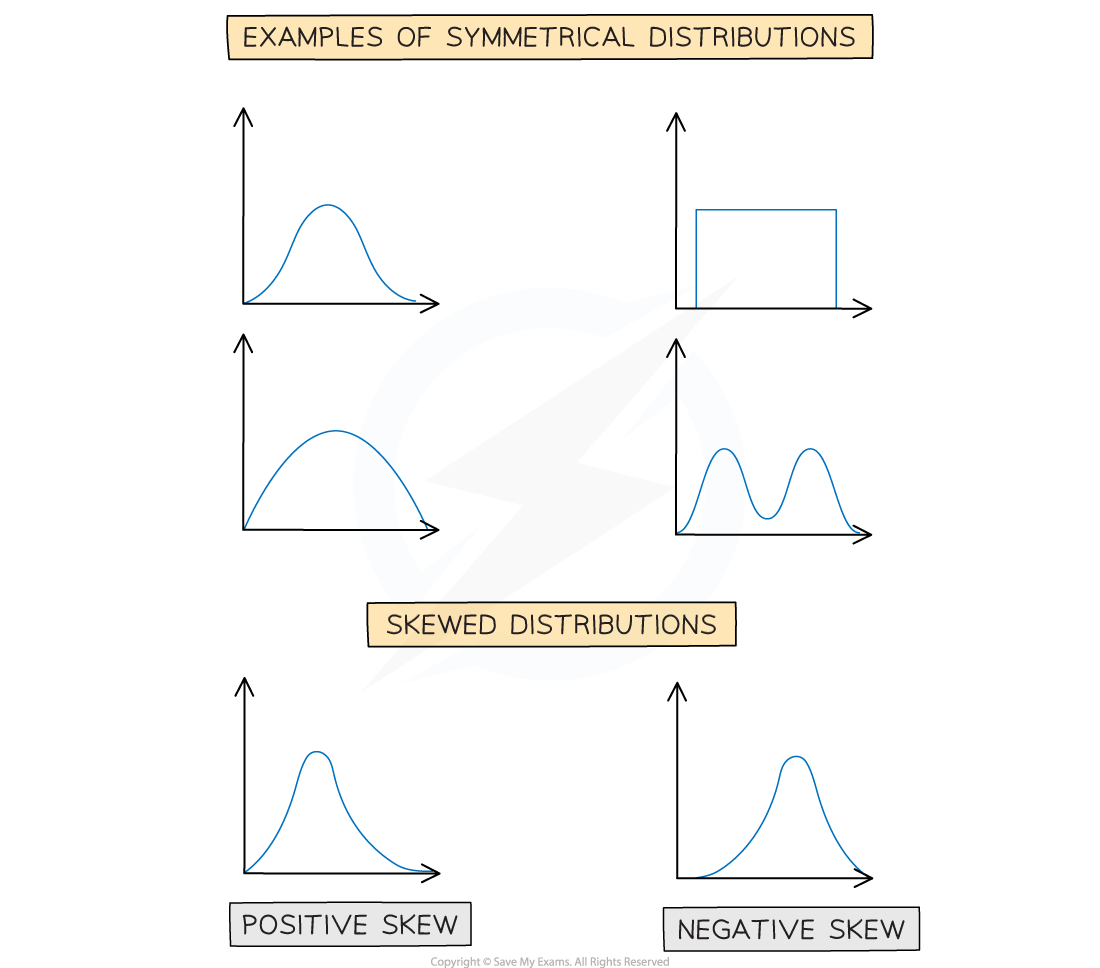
When a set of data is plotted on a graph, the shape of the distribution of the data can be seen
The shape of the distribution can be
symmetrical
or non-symmetrical
There are many different shapes that non-symmetrical distributions can take
Skewness describes the direction in which a non-symmetrical distribution of data is leaning
A distribution that has its tail on the right side has positive skew
A distribution that has its tail on the left side has negative skew
Examiner Tips and Tricks
It is a common mistake for students to look at the peaks of the distributions and get the skewness the wrong way round!
How do I find the skewness from a boxplot?
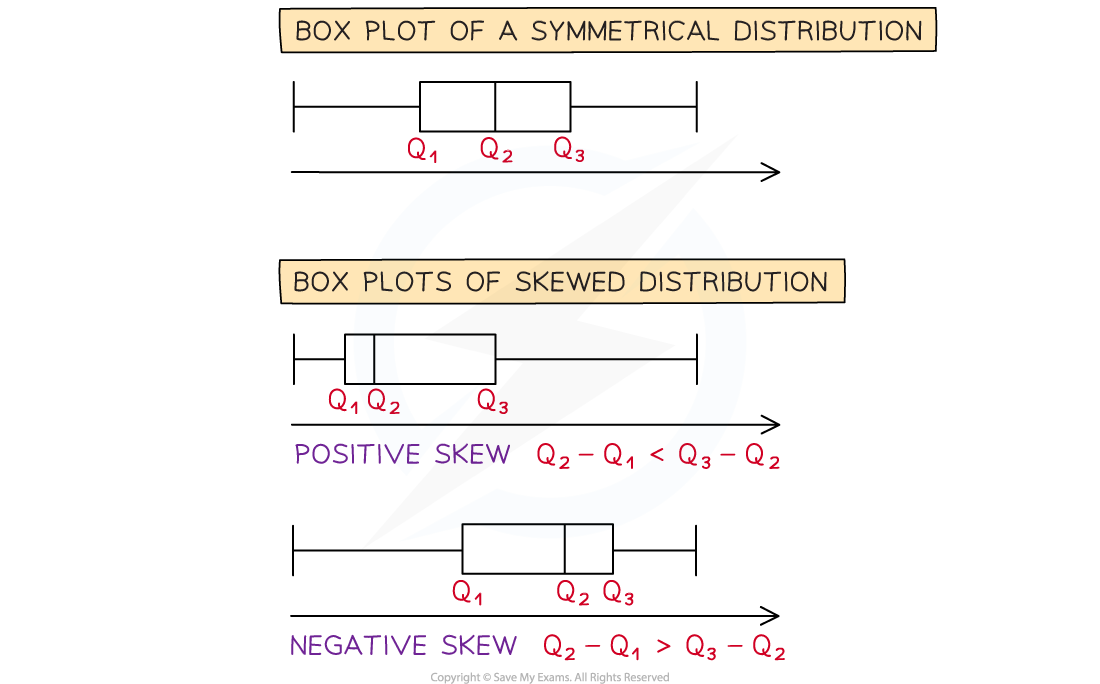
If a set of data is shown on a boxplot then looking at the differences between the quartiles can help to decide how it is skewed
If the median is roughly in the middle of the first and third quartiles, then the distribution is approximately symmetric
Q3 - Q2
format('truetype')%3Bfont-weight%3Anormal%3Bfont-style%3Anormal%3B%7D%3C%2Fstyle%3E%3C%2Fdefs%3E%3Ctext%20font-family%3D%22math1e551d3ddbf87bddac369765bd5%22%20font-size%3D%2216%22%20text-anchor%3D%22middle%22%20x%3D%228.5%22%20y%3D%2216%22%3E%26%23x2248%3B%3C%2Ftext%3E%3C%2Fsvg%3E) Q2- Q1
Q2- Q1
If the median is closer to the first quartile, then the distribution has positive skew
Q3 - Q2 > Q2- Q1
If the median is closer to the third quartile then the distribution has negative skew
Q3 - Q2 < Q2- Q1
How do I find the skewness from the median and the mean?
It is possible to find the skewness if given the median and the mean of a data set
In a symmetric distribution
the median and the mean are roughly the same
median
mean
In a positively skewed distribution
median < mean
In a negatively skewed distribution
mean < median

Unlock more, it's free!
Join the 100,000+ Students that ❤️ Save My Exams
the (exam) results speak for themselves:

Was this revision note helpful?
