Five-Number Summary & Boxplots (College Board AP® Statistics): Revision Note

Five-number summary
What is a five-number summary?
A five-number summary is the collection of the following five values from a data set:
the minimum data value
the first quartile (Q1)
the median (Q2)
the third quartile (Q3)
the maximum data value
It is a concise way to summarize a set of data without showing all the data values
What can I calculate from a five-number summary?
From a five-number summary, you can:
find a measure of the center of the data
The median
find a measure of the spread (variability) of the data
Either the range (maximum - minimum)
or the interquartile range (Q3 - Q1)
find the shape of the distribution of the data
by comparing the difference Q2 - Q1 with the difference Q3 - Q2
Boxplots
What is a boxplot?
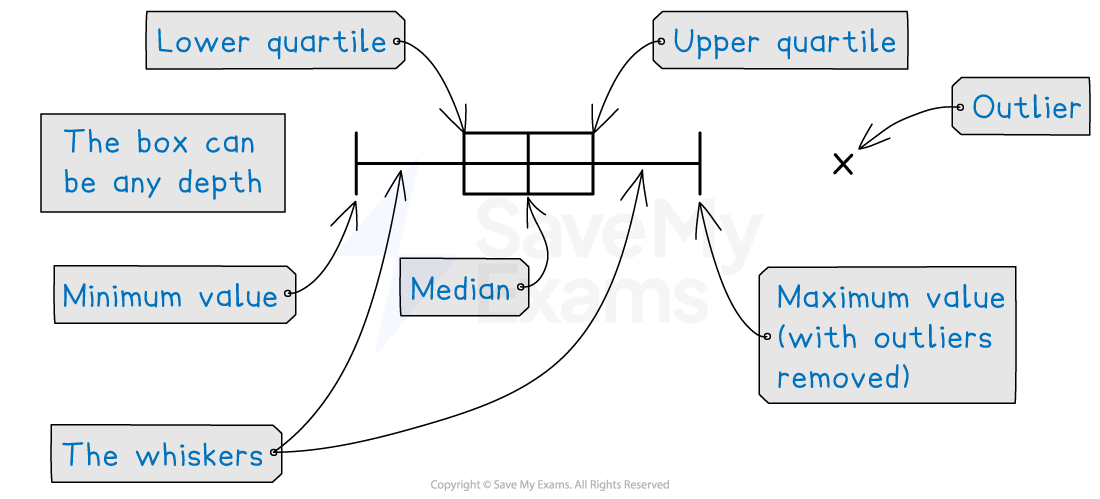
A boxplot is a graph that shows the five-number summary
The minimum data value, first quartile, median, third quartile and maximum data value of a set of data
A box is used to represent the middle 50% of the data
The width of the box is the interquartile range
The difference between the first and third quartile (also known as the lower and upper quartiles)
Two whiskers (horizontal lines) are extended from either side of the box to the minimum data value and the maximum data value
The median is shown by a vertical line inside the box
This is not necessarily in the center of the box
Outliers (extreme values) are represented with a cross and are outside of the whiskers
The maximum and minimum data values do not include outliers
The whisker ends at the most extreme non-outlier
Worked Example
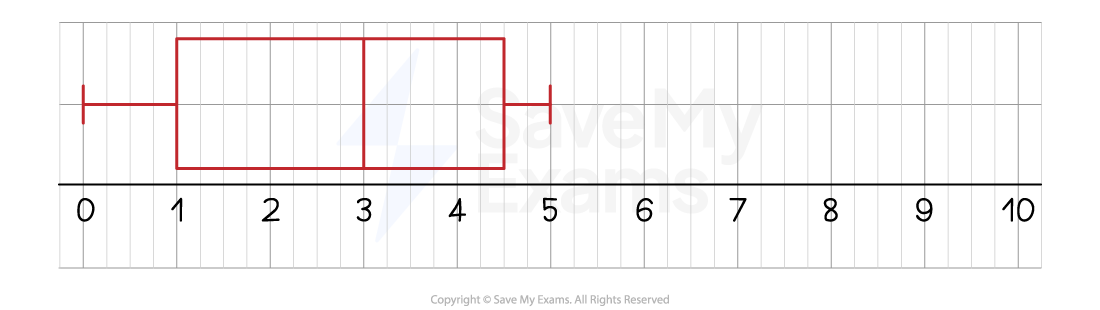
The box plot below shows the number of goals scored per game by Albion Rovers during a soccer season.
The information below shows the number of goals scored per game by Union Athletic during the same soccer season.
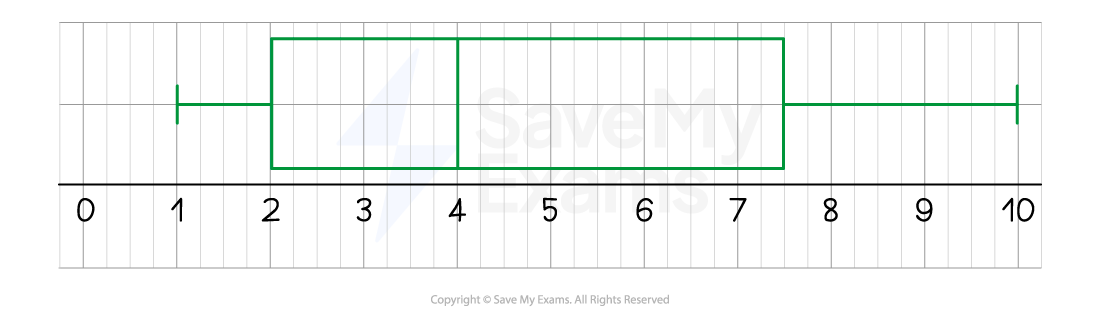
Median number of goals per game | 4 |
Lower quartile | 2 |
Upper quartile | 7.5 |
Lowest number of goals per game | 1 |
Highest number of goals per game | 10 |
(a) Draw a box plot for the Union Athletic data.
(b) Compare the number of goals scored per game by the two teams.
Answer:
(a)
Draw the box plot by first plotting all five points as vertical lines
Draw a box around the middle three and then draw whiskers out to the outer two
(b)
Your first comment should be about averages - do it in two sentences
Your first sentence should be just about the numbers involved
The second should be about what it means
The median number of goals per game is higher for Union Athletic (4 goals) than Albion Rovers (3 goals)
This means that on average, Union Athletic scored more goals per game than Albion Rovers
Your second comment should be about spread - do it in two sentences
Your first sentence should be just about the numbers involved
The second should be about what it means
The interquartile range (IQR) is higher for Union Athletic (5.5) than Albion Rovers (3.5)
This means that Albion Rovers were more consistent regarding the number of goals they scored per game

Unlock more, it's free!
Join the 100,000+ Students that ❤️ Save My Exams
the (exam) results speak for themselves:

Was this revision note helpful?
Build on this topic
