Comparing Data using Summary Statistics (College Board AP® Statistics): Study Guide

Comparing data using summary statistics
Any of the numerical summaries (e.g., mean, standard deviation, relative frequency, etc.)
can be used to compare two or more independent samples
How do I compare two data sets?
You may be given two sets of data that relate to a context
To compare data sets, you need to
compare their measures of center
Mode, median or mean
compare their measures of spread
Range, interquartile range or standard deviation
comment on the shape of the distribution of the data
Skew, symmetry
comment on any unusual features
Outliers (extreme values), gaps, clusters (groupings of data values), multiple peaks in the shape of the distribution
How do I write a conclusion when comparing two data sets?
When comparing features, you need to
compare numerical values or calculate summary statistics
describe (interpret) what this means in real life
For example, some good ways to describe a measure of spread (variability) are:
"A smaller spread of scores means...
scores are closer together"
scores are more consistent"
there is less variation in the scores"
Examiner Tips and Tricks
When comparing data sets, always remember to relate any numerical values to the context in the question. You may need to copy the exact wording from the question a few times.
What restrictions are there when drawing conclusions?
The data sets may be too small to be truly representative
Measuring the heights of only 5 pupils in a whole school is not enough to talk about averages and spreads
The data sets may be biased
Measuring the heights of just the older year groups in a school will make the average appear too high
The conclusions might be influenced by who is presenting them
A politician might select the specific type of average that helps to strengthen their argument!
You may need to choose which measure of center or measure of spread to compare
Check for outliers (extreme values) in the data
If there are outliers, avoid using the mean, standard deviation and range as they are affected by extreme values!
Worked Example
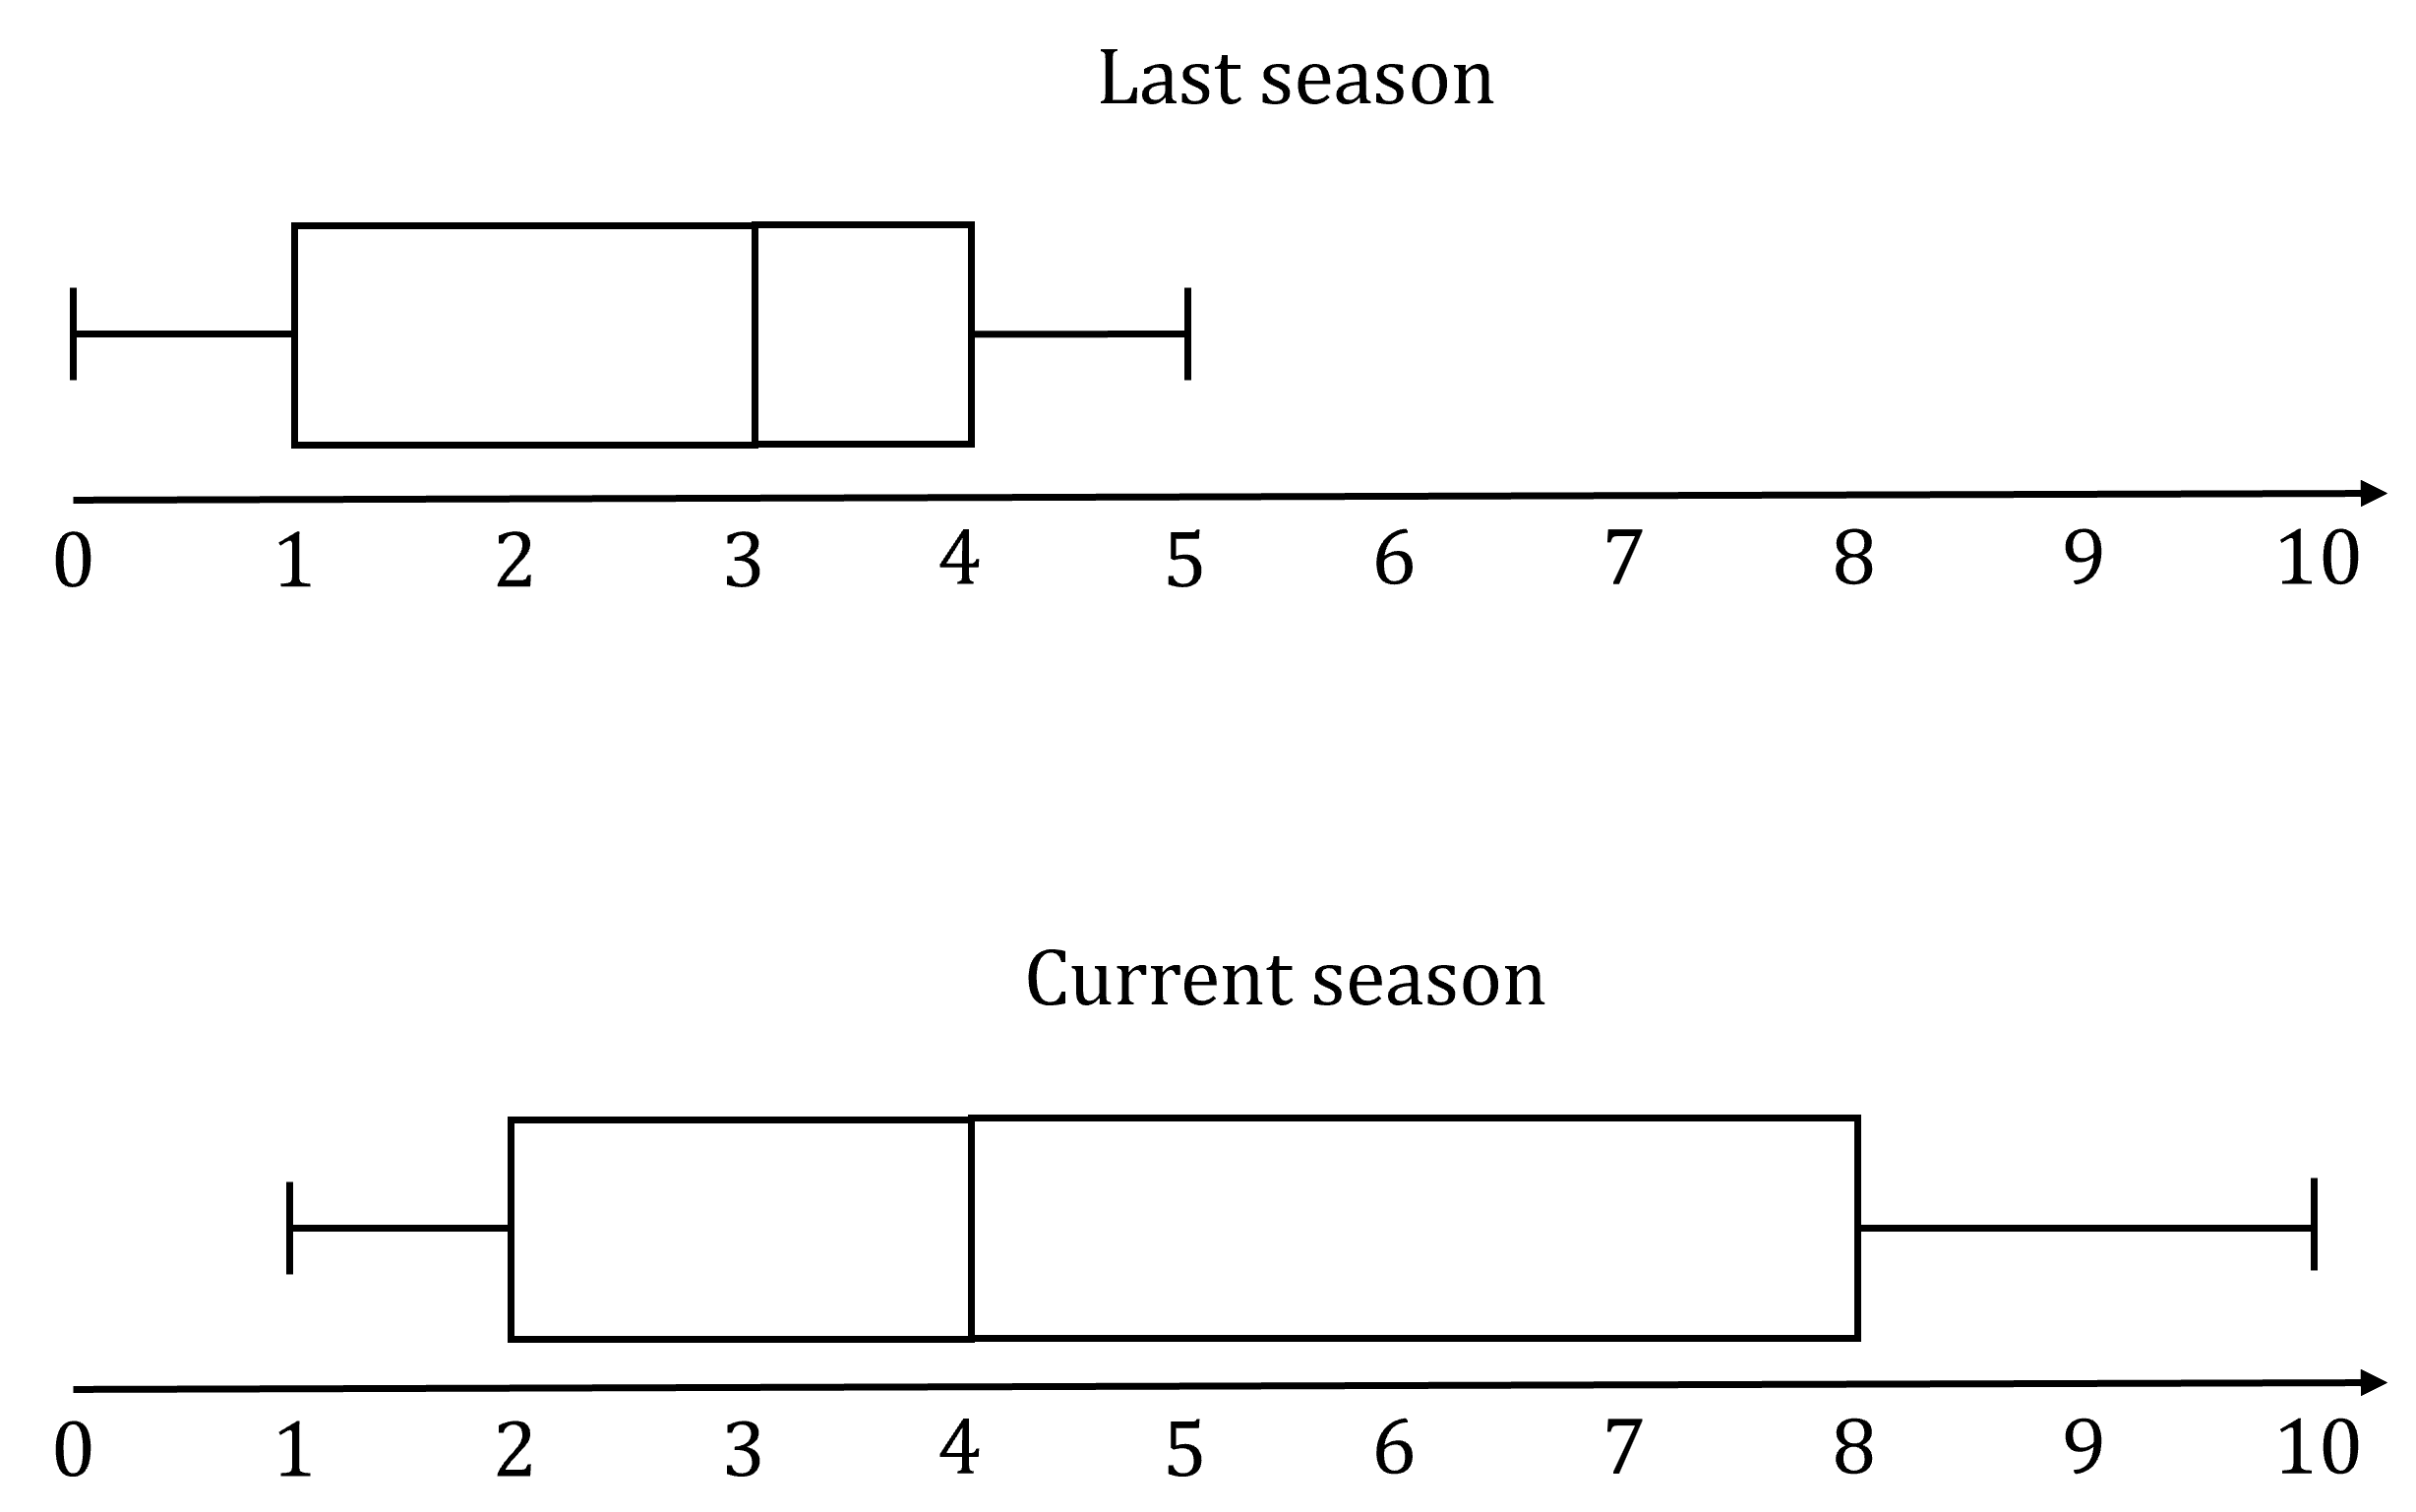
The number of goals scored per game by a soccer team throughout the soccer season is recorded. The results from the last season and the results from the current season are shown in the boxplots below. Compare the performance of the team last season with the performance of the team this season.
Answer:
You need to compare
a measure of the centers of the data sets (the medians)
the spread of the data (either the range or the interquartile range)
the shape of the distributions (skew or symmetry)
and any unusual features (e.g. outliers)
The median of goals scored per game last season is 3 goals per game
This is less than the median of goals scored per game this season, 4 goals per game
So, on average, the number of goals scored per game has increased
This suggests the team has improved
The interquartile range of goals scored per game last season is 4 − 1 = 3 goals
This is less than the interquartile range of goals scored per game this season, 8 − 2 = 6 goals
So, the number of goals scored per game this season is more spread out compared to last season
This suggests the team were playing more consistently last season than this season
For last season, the median is closer to the third quartile, giving a negative (left) skew of goals scores per game
This season, the median is closer to the first quartile, giving a positive skew of goals scores per game
There were no outliers or unusual features last season and there are no outliers or unusual features this season

Unlock more, it's free!
Join the 100,000+ Students that ❤️ Save My Exams
the (exam) results speak for themselves:

Was this revision note helpful?
