Linear Momentum & Impulse (College Board AP® Physics 1: Algebra-Based): Exam Questions

2 hours30 questions
1a
Sme Calculator
1 mark

Define the term linear momentum.

1b
Sme Calculator
3 marks
Diagram of a circle labelled "m" with an arrow pointing right, indicating initial velocity "v₀"; an x-y axis is on the left side.

Figure 1

An object of mass m moves with speed v subscript 0, as shown in Figure 1.

i) Determine an expression for the magnitude of the object's momentum.

ii) Indicate the direction of the object's momentum. Justify your answer.

1c
Sme Calculator
4 marks
Diagram of a circle with mass "m" moving at 6 m/s at a 30° angle to the horizontal. X and Y axes are shown for direction reference.

Figure 2

The mass of the object is 2 space kg. A force is exerted on the object and changes its direction, as shown in Figure 2.

i) Calculate the x-component of the object's momentum.

ii) Calculate the y-component of the object's momentum.

1d
Sme Calculator
2 marks

Before the force is applied, the speed of the object is v subscript 0 space equals space 6 space straight m divided by straight s.

i) Determine the change in the x-component of the object's momentum.

ii) Determine the change in the y-component of the object's momentum.

Did this page help you?

2a
Sme Calculator
1 mark

Define the term impulse.

2b
Sme Calculator
3 marks
Diagram showing a 2 kg block moving right with velocity 'v' at t=0 and '2v' at t=3.0 s, on a horizontal surface.

Figure 1

A block of mass 2 space kg slides on a frictionless surface with initial velocity v. At time t space equals space 0, a constant force is applied to the block. At time t space equals space 3.0 space straight s, the velocity of the block is 2 v, as shown in Figure 1.

Determine an expression for the net force exerted on the block in terms of v.

2c
Sme Calculator
4 marks

i) Indicate the direction of the net force exerted on the block. Justify your answer.

ii) Indicate the direction of the impulse exerted on the block. Justify your answer.

Did this page help you?

3a
Sme Calculator
1 mark

State the impulse-momentum theorem.

3b
Sme Calculator
2 marks

A car of mass 2500 space kg is traveling at a speed of 10 space straight m divided by straight s before it crashes into a wall. The car is brought to rest in 0.5 space straight s.

Using the impulse-momentum theorem, determine the magnitude of the average force exerted on the car by the wall during the crash.

3c
Sme Calculator
3 marks
Graph with force on the vertical axis and time on the horizontal. A triangle peaks at 100,000 N at 0.25 seconds and returns to 0 N by 0.5 seconds.

Figure 1

The graph in Figure 1 shows the force F exerted on the car by the wall as a function of time t.

Does the data from the graph in Figure 1 agree with your calculation from part b)? Justify your answer.

3d
Sme Calculator
2 marks

The car in part b) is designed to include a crumple zone. The crumple zone collapses the front section of the car upon impact with the wall. An identical car designed without this feature is tested under the same conditions.

Indicate whether the average force exerted on the car without the crumple zone is greater than, equal to, or less than the average force calculated in part b). Justify your answer.

Did this page help you?

4a
Sme Calculator
4 marks
Graph showing a linear increase of momentum from -10 to 15 kg·m/s over 5 seconds, with labelled axes: Momentum (kg·m/s) and Time (s).

Figure 1

A cart of mass 2.5 space kg is moving along a frictionless horizontal surface. At t space equals space 0 the cart is subjected to a net horizontal force. Figure 1 shows the momentum of the cart as a function of time.

i) Using the graph in Figure 1, determine the impulse delivered to the cart after 5 space straight s.

ii) Using the graph in Figure 1, determine the net force exerted on the cart.

4b
Sme Calculator
2 marks

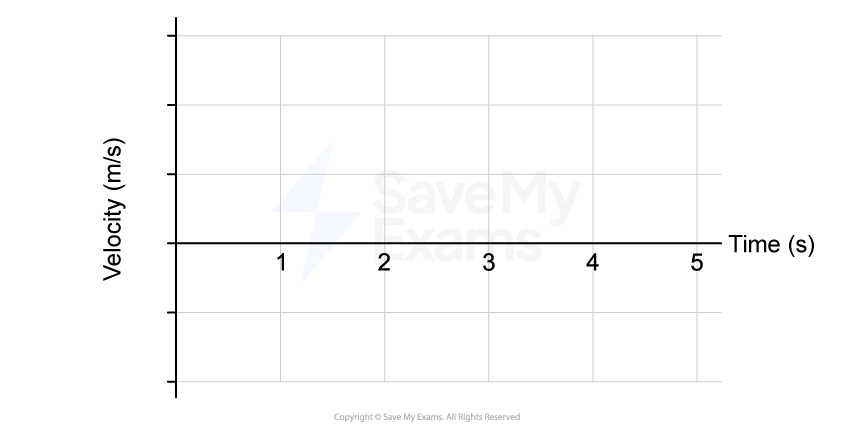
On the axes provided in Figure 2, sketch a graph of the velocity of the cart as a function of time. Clearly scale the vertical axis.

Graph showing velocity in metres per second on the y-axis and time in seconds on the x-axis, with values ranging from 0 to 5 for each axis.

Figure 2

4c
Sme Calculator
2 marks

On the axes provided in Figure 3, sketch a graph of the force exerted on the cart as a function of time. Clearly scale the vertical axis.

Graph showing force in newtons (N) on the y-axis and time in seconds (s) on the x-axis, ranging from 0 to 5. The graph is marked with grid lines.

Figure 3

Did this page help you?

5a
Sme Calculator
3 marks
A block with mass "m" moves right with velocity "v" towards a wall with a coiled spring attached, on a horizontal surface.

Figure 1

A block of mass m slides across a frictionless surface with a speed of v. The block collides with a spring which is attached to a wall, as shown in Figure 1. After the collision, the block moves away from the spring with the same speed.

Taking the initial velocity of the block as the positive direction, derive an expression for the impulse exerted on the block by the spring, in terms of m and v. Begin your derivation by writing a fundamental physics principle or an equation from the reference information.

5b
Sme Calculator
2 marks
Diagram of a spring connecting two blocks; left block labelled "m" and right block labelled "2m", resting horizontally.

Figure 2

Block 1, of mass m, is attached to one end of the spring and Block 2, of mass 2 m, is attached to the other end, as shown in Figure 2. The blocks are pushed together so that the spring is compressed and then released from rest.

Indicate whether the impulse exerted on Block 1 is greater than, equal to, or less than the impulse exerted on Block 2 after they are released. Justify your reasoning.

Did this page help you?

1a
Sme Calculator
2 marks
Two experiments: A rubber ball hits a block on a table in Experiment A; a clay ball hits a block on a table in Experiment B.

Figure 1

A student conducts an experiment using a rubber ball of mass m and a clay ball of the same mass. At time t space equals space 0, each ball is thrown horizontally with speed v subscript 0 toward two identical blocks that are fixed in place, as shown in Figure 1. At time t space equals space t subscript 0, the balls collide with their respective blocks. The forces exerted by the blocks on the balls last for the same amount of time. In Experiment A, the rubber ball bounces off of the block and rebounds with the same speed. In Experiment B, the clay ball sticks to the block.

The arrow in Figure 2 represents the momentum of the rubber ball immediately before the collision in Experiment A.

An 8 by 8 grid with dashed lines with a dot at the center and an arrow of 2 units in length pointing right.

Figure 2

The dots in Figure 3 represent the rubber ball in Experiment A and the clay ball in Experiment B respectively.

Two grids, labeled Experiment A (left) and Experiment B (right), each with a black dot at the center.

Figure 3

On the dots in Figure 3, draw arrows to represent the momentum of the rubber ball and the clay ball immediately after their respective collisions.

  • If the momentum is zero, write “zero” next to the dot.

  • The momentum, if it is not zero, must be represented by an arrow starting on, and pointing away from, the dot.

  • The length of the arrows, if not zero, should reflect the magnitude of the momentum relative to the arrow in Figure 2.

1b
Sme Calculator
3 marks

i) Derive an expression for the magnitude of the impulse exerted by the block on the rubber ball in terms of m and v subscript 0. Begin your derivation by writing a fundamental physics principle or an equation from the reference book.

ii) Determine an expression for the magnitude of the impulse exerted by the block on the clay ball in terms of m and v subscript 0.

1c
Sme Calculator
4 marks

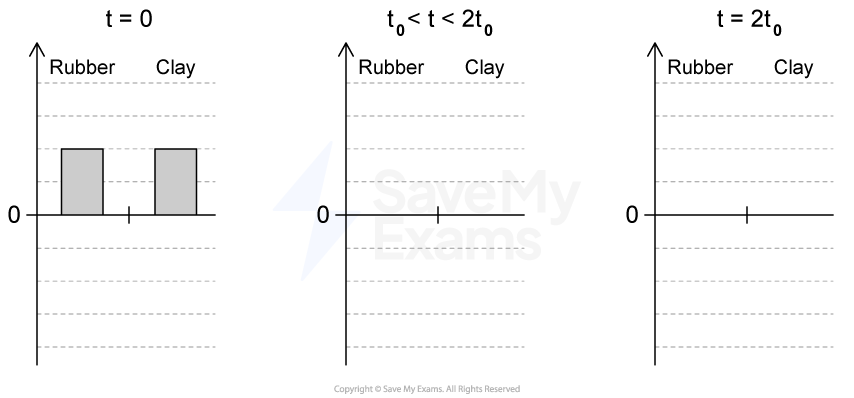
The momentum bar charts in Figure 4 represent the momentum of the rubber ball and clay ball before the collision at time t space equals space 0, during the collision in the time interval between t space equals space t subscript 0 and t space equals space 2 t subscript 0, and after the collision at time t space equals space 2 t subscript 0. The bar chart at t space equals space 0 is complete. Draw shaded rectangles to complete the momentum bar charts in Figure 4 in the time interval t subscript 0 space less than space t space less than space 2 t subscript 0 and at time t space equals space 2 t subscript 0.

  • Positive values of momentum are above the zero line (“0”), and negative values of momentum are below the zero line.

  • Shaded regions should start at the dashed line representing zero momentum.

  • Represent any momentum that is equal to zero with a distinct line on the zero line.

  • The relative height of each shaded region should reflect the magnitude of the respective momentum consistent with the scale shown.

Three graphs showing a signal over time. Left: two bars for rubber and clay at t=0. Middle: no bars for rubber or clay at t<2t0. Right: identical to middle.

Figure 4

1d
Sme Calculator
3 marks
Two free-body diagrams on 6 by 6 grids. Both show forces Ff (length 2 units) acting up and Fg (length 2 units) acting down. Experiment A (left): force FA is 1.5 units in length and acts to the left. Experiment B (right): force FB is 3 units in length and acts to the left.

Figure 5

A student sketches the free-body diagrams in Figure 5, and makes the following claim:

“The free-body diagrams show the average forces exerted on each ball during the time interval t subscript 0 space less than space t space less than space 2 t subscript 0”.

Justify why the student’s sketch (Figure 5) and claim are or are not consistent with the momentum bar charts you drew in part c).

Did this page help you?

2a
Sme Calculator
2 marks
Diagram of a force sensor pushing a spring attached to a cart. A motion detector is positioned further along the path of the cart.

Figure 1

A cart of mass m is attached to an ideal spring, whose other end is fixed to a force sensor which is attached to a wall. The student places a motion detector to the right of the cart, as shown in Figure 1, and pulls the cart to the right a small distance so that the spring is stretched. The student releases the cart from rest, and the cart-spring system oscillates with period t subscript 0. While the cart is oscillating, it has a maximum speed v subscript m a x end subscript.

Estimate the total impulse exerted on the cart by the spring over one full oscillation cycle. Justify your estimate using qualitative reasoning beyond referencing equations.

2b
Sme Calculator
3 marks

The student determines the mass of the cart is m space equals space 0.25 space kg. The graphs in Figure 2 show the velocity v of the cart and the force F exerted on the cart by the spring as functions of time t.

Top graph shows velocity vs time with a sine wave pattern. Bottom graph shows force vs time, also sine wave, inverse to velocity at phase.

Figure 2

Does the data from the graphs in Figure 2 agree with your estimate from part a)? Justify your answer.

Did this page help you?

3a
Sme Calculator
4 marks

Ball 1 has mass m and moves horizontally with speed v towards a wall. During the collision, Ball 1 is in contact with the wall for time increment t. After the collision, Ball 1 rebounds at half its initial speed.

i) Determine an expression for the impulse exerted by the wall on Ball 1 in terms of m and v.

ii) Derive an expression for the average force exerted by the wall on Ball 1 in terms of m, v and increment t. Begin your derivation by writing a fundamental physics principle or an equation from the reference information.

3b
Sme Calculator
3 marks

A different ball, Ball 2, moves horizontally towards the wall. Ball 2 has the same mass and initial speed as Ball 1. During the collision, Ball 2 is in contact with the wall for a shorter time than Ball 1. After the collision, Ball 2 rebounds with speed v subscript 2. The average force exerted by the wall is the same in both collisions.

Two grids labelled Ball 1 and Ball 2, each with a central black dot. Grids comprise horizontal and vertical lines forming equal squares.

Figure 1

On the dots in Figure 1, draw arrows to represent the impulses exerted on Ball 1 and Ball 2 by the wall during their respective collisions.

  • If the impulse is zero, write “zero” next to the dot.

  • The impulse, if it is not zero, must be represented by an arrow starting on, and pointing away from, the dot.

  • The length of the vectors, if not zero, should reflect the relative magnitude of the impulses exerted on each ball.

3c
Sme Calculator
3 marks

Indicate whether the final speed v subscript 2 of Ball 2 is greater than, equal to, or less than the final speed v subscript 1 of Ball 1.

⎽⎽⎽⎽⎽⎽⎽⎽⎽⎽ v subscript 2 space greater than space v subscript 1‎ ‎ ‎ ‎ ‎ ‎ ‎ ‎ ‎ ‎ ⎽⎽⎽⎽⎽⎽⎽⎽⎽⎽ v subscript 2 space equals space v subscript 1 ‎ ‎ ‎‎ ‎ ‎ ‎ ‎ ‎ ‎ ⎽⎽⎽⎽⎽⎽⎽⎽⎽⎽ v subscript 2 space less than space v subscript 1

Justify your reasoning using your answer to part b).

Did this page help you?

4a
Sme Calculator
4 marks
Diagram of a launching device releasing a projectile, with an arrow showing horizontal velocity labelled "Vx" pointing right.

Figure 1

A projectile of mass M subscript p is fired horizontally from a launching device, exiting with a speed v subscript x, as shown in Figure 1. While the projectile is in the launching device, the impulse given to it is space J subscript p, and the average force exerted on it is F subscript a v g end subscript. Assume the force becomes zero just as the projectile reaches the end of the launching device.

i) Determine an expression for the time required for the projectile to travel the length of the launching device, in terms ofspace J subscript p and F subscript a v g end subscript.

ii) Determine an expression for the mass of the projectile, in terms of space J subscript p and v subscript x.

4b
Sme Calculator
3 marks

The mass of the projectile is 30 space straight g. The graph in Figure 2 shows the force F exerted on the projectile by the launcher as a function of time t.

Graph showing force in newtons versus time in seconds. Force rises to 200N by 0.04s, stays constant until 0.06s, then drops back to zero at 0.10s.

Figure 2

i) Using the graph in Figure 2, calculate the impulse space J subscript p given to the projectile.

ii) Calculate the launch speed v subscript x of the projectile.

Did this page help you?

5a
Sme Calculator
2 marks

A groups of students have a cart of unknown mass M and a straight horizontal track. The students are asked to take measurements to create a graph that could be used to determine the mass of the cart. The students have access to a force sensor, a motion detector, and other standard laboratory equipment. They do not have access to a scale.

Describe an experimental procedure the students could use to collect data needed to determine the mass of the cart. Include any steps necessary to reduce experimental uncertainty. If needed, you may include a simple diagram of the setup with your procedure.

5b
Sme Calculator
2 marks

Describe how the data collected in part a) could be plotted to create a linear graph and how that graph would be analyzed to determine the mass M of the cart.

Did this page help you?

1a
Sme Calculator
2 marks
Diagram showing two scenarios: At t=0, mass m1 attached to a compressed spring; at t>tc, m1 moves right, colliding with mass m2 on a frictionless surface.

Figure 1

Block 1 of mass m subscript 1 is held at rest while an ideal spring of spring constant k is compressed by increment x. Block 2 has mass m subscript 2 where m subscript 2 space less than space m subscript 1. At time t space equals space 0, Block 1 is released. At time t space equals space t subscript C , the spring is no longer compressed and Block 1 immediately collides with and sticks to Block 2. The two-block system moves with constant speed v, as shown in Figure 1. Friction between the blocks and the surface is negligible.

The impulse on Block 1 from the spring during the time interval 0 thin space less than space t space less than space t subscript C is space J subscript S. The impulse on Block 1 from Block 2 during the collision is space J subscript 2.

Indicate whether the magnitude ofspace J subscript S is greater than, less than, or equal to the magnitude ofspace J subscript 2.

⎽⎽⎽⎽⎽⎽⎽⎽⎽⎽ space J subscript S space greater than space J subscript 2‎ ‎ ‎ ‎ ‎ ‎ ‎ ‎ ‎ ‎ ⎽⎽⎽⎽⎽⎽⎽⎽⎽⎽ space J subscript S space equals space J subscript 2 ‎ ‎ ‎‎ ‎ ‎ ‎ ‎ ‎ ‎ ⎽⎽⎽⎽⎽⎽⎽⎽⎽⎽ space J subscript S space less than space J subscript 2

Justify your reasoning.

1b
Sme Calculator
3 marks

On the axes provided in Figure 2, sketch graphs of the magnitude of the momentum of each block as functions of time from t space equals space 0 to after t space equals space t subscript C. The collision occurs in a negligible amount of time. The grid lines on each graph are drawn to the same scale.

Two line graphs showing momentum vs time for Block 1 and Block 2, both labelled from 0 to t_c on the time axis.

Figure 2

Did this page help you?

2a
Sme Calculator
2 marks

A student has a rubber ball of known mass m which they release from rest from height h. The student is asked to verify the relationship between the impulse exerted on the ball upon impact with the ground and the change in its momentum. The student has access to a force sensor, a motion sensor, and other standard laboratory equipment.

Describe an experimental procedure the student could use to collect data that would allow them to verify the relationship between impulse and change in momentum. Include any steps necessary to reduce experimental uncertainty. If needed, you may include a simple diagram of the setup with your procedure.

2b
Sme Calculator
2 marks

Describe how the collected data should be analyzed to verify the relationship between impulse and change in momentum.

2c
Sme Calculator
4 marks

The experiment is repeated using a clay ball of mass 50 g which is dropped from different heights above the ground. The clay ball sticks to the force sensor on the ground upon impact. The student's measurements are shown in Table 1.

Drop height

h space open parentheses straight m close parentheses

Average
Impact Force

F subscript a v g end subscript space open parentheses straight N close parentheses

Impact Time

increment t space open parentheses straight s close parentheses

‎ ‎ ‎ ‎ ‎ ‎ ‎ ‎ ‎ ‎ ‎ ‎ ‎ ‎ ‎ ‎ ‎ ‎

‎ ‎ ‎ ‎ ‎ ‎ ‎ ‎ ‎ ‎ ‎ ‎ ‎ ‎ ‎ ‎ ‎ ‎

0.15

4.0

0.023

‎ ‎ ‎ ‎ ‎ ‎ ‎ ‎ ‎ ‎ ‎ ‎ ‎ ‎ ‎ ‎ ‎ ‎

‎ ‎ ‎ ‎ ‎ ‎ ‎ ‎ ‎ ‎ ‎ ‎ ‎ ‎ ‎ ‎ ‎ ‎

0.30

5.7

0.021

‎ ‎ ‎ ‎ ‎ ‎ ‎ ‎ ‎ ‎ ‎ ‎ ‎ ‎ ‎ ‎ ‎ ‎

‎ ‎ ‎ ‎ ‎ ‎ ‎ ‎ ‎ ‎ ‎ ‎ ‎ ‎ ‎ ‎ ‎ ‎

0.45

7.9

0.019

‎ ‎ ‎ ‎ ‎ ‎ ‎ ‎ ‎ ‎ ‎ ‎ ‎ ‎ ‎ ‎ ‎ ‎

‎ ‎ ‎ ‎ ‎ ‎ ‎ ‎ ‎ ‎ ‎ ‎ ‎ ‎ ‎ ‎ ‎ ‎

0.60

10.0

0.017

‎ ‎ ‎ ‎ ‎ ‎ ‎ ‎ ‎ ‎ ‎ ‎ ‎ ‎ ‎ ‎ ‎ ‎

‎ ‎ ‎ ‎ ‎ ‎ ‎ ‎ ‎ ‎ ‎ ‎ ‎ ‎ ‎ ‎ ‎ ‎

0.75

12.6

0.015

‎ ‎ ‎ ‎ ‎ ‎ ‎ ‎ ‎ ‎ ‎ ‎ ‎ ‎ ‎ ‎ ‎ ‎

‎ ‎ ‎ ‎ ‎ ‎ ‎ ‎ ‎ ‎ ‎ ‎ ‎ ‎ ‎ ‎ ‎ ‎

0.90

17.5

0.012

‎ ‎ ‎ ‎ ‎ ‎ ‎ ‎ ‎ ‎ ‎ ‎ ‎ ‎ ‎ ‎ ‎ ‎

‎ ‎ ‎ ‎ ‎ ‎ ‎ ‎ ‎ ‎ ‎ ‎ ‎ ‎ ‎ ‎ ‎ ‎

Table 1

i) Indicate two quantities that when graphed produce a straight line that could be used to calculate an experimental value for the acceleration due to gravity. You may use the blank columns in the table for any quantities you graph other than the given data. Use the blank columns in the table to list any calculated quantities (including units) you will graph other than the data provided.

Vertical Axis: ⎽⎽⎽⎽⎽⎽⎽⎽⎽⎽⎽⎽⎽⎽⎽⎽⎽⎽⎽⎽ ‎ ‎ ‎ ‎ ‎ ‎ ‎ ‎ ‎ Horizontal Axis: ⎽⎽⎽⎽⎽⎽⎽⎽⎽⎽⎽⎽⎽⎽⎽⎽⎽⎽⎽⎽

ii) Plot the data points for the quantities indicated in part c)i) on the following graph. Clearly scale and label all axes, including units.

Rectangular grid with small squares, divided into larger sections by thicker lines, resembling graph paper for mathematical or design purposes.

iii) Draw a best fit line to the data graphed in part c)(ii).

2d
Sme Calculator
2 marks

Calculate an experimental value for the acceleration due to gravity using the best-fit line that you drew in part c)iii).

Did this page help you?
33 marks
Plunger moves from position A to position F with a block at A and E; textured section between C and D.

Figure 1

Blocks 1 and 2, each of mass m, are placed on a horizontal surface at points A and E, respectively, as shown in Figure 1. The surface is frictionless except for the region between points C and D.

In the time interval t space equals space t subscript A to t space equals space t subscript B, a mechanical plunger pushes Block 1 with a constant horizontal force of magnitude F subscript p. At point B, Block 1 loses contact with the plunger and continues moving to the right with speed v subscript B. In the time interval t space equals space t subscript C to t space equals space t subscript D, Block 1 moves over the rough surface where the coefficient of kinetic friction between the block and the surface is mu. At point D, Block 1 is moving to the right with speed v subscript D.

The magnitude of the impulse exerted on Block 1 as it moves over the rough surface is equal to half the magnitude of the impulse exerted on it by the plunger.

i) Determine an expression for the magnitude of the force F subscript p exerted on Block 1 by the plunger, in terms of mu, m, t subscript A, t subscript B, t subscript C, t subscript D, and physical constants as appropriate.

ii) Derive an expression for the speed v subscript D of Block 1 in terms of v subscript B. Begin your derivation by writing a fundamental physics principle or an equation from the reference information.

Did this page help you?

4a
Sme Calculator
3 marks
Diagram showing Cart 1 on a slope at height x labeled m1, and Cart 2 labeled m2 connected to a spring. Positions A-G marked on a horizontal plane.

Figure 1

Carts 1 and 2 are placed on a track at positions A and G, respectively, as shown in Figure 1. Each point on the track is separated by a distance x. Cart 1 of mass M subscript 1 is held at rest a vertical distance equal to x above the bottom of an incline. Cart 2 of mass M subscript 2 is held at rest while compressing an ideal spring of spring constant k by an amount x. At time t space equals space 0, both carts are released. At time t space equals space t subscript 0, Cart 1 reaches point B at the bottom of the incline, and Cart 2 reaches point F, at which point the spring is no longer compressed. Friction between the carts and the track is negligible.

During the time interval 0 thin space less than space t space less than space t subscript 0, the magnitudes of the average forces on Cart 1 and Cart 2 are equal.

If Cart 2 is more massive than Cart 1 open parentheses M subscript 2 space greater than space M subscript 1 close parentheses, predict the approximate position along the track where the two carts meet. Justify your prediction using qualitative reasoning beyond referencing equations.

4b
Sme Calculator
3 marks

Derive the relationship between M subscript 1 and M subscript 2 to show that M subscript 1 space equals space square root of fraction numerator k x M subscript 2 over denominator 2 g end fraction end root. Begin your derivation by writing a fundamental physics principle or an equation from the reference material.

Did this page help you?

5a
Sme Calculator
3 marks
Two diagrams show carts A and B moving right towards force sensors on tracks, with velocities vA and vB indicated by arrows.

Figure 1

Two identical carts A and B, each of mass m, are moving along a frictionless horizontal track. A force sensor is positioned to record the motion of the carts along the track, as shown in Figure 1. The carts travel toward the force sensor and collide with it. Before the collision, Cart A travels at speed v subscript A and Cart B travels at speed v subscript B space equals space 2 v subscript A. The graphs in Figure 2 show the forces exerted on the carts during the collisions as functions of time.

Two line graphs compare force over time for Cart A and Cart B. Each graph shows a peak force of 40 N at 0.05 seconds, returning to 0 N at 0.1 seconds.

Figure 2

i) Using the data from the graphs in Figure 2, determine the ratio of the change in Cart A's momentum to the change in Cart B's momentum.

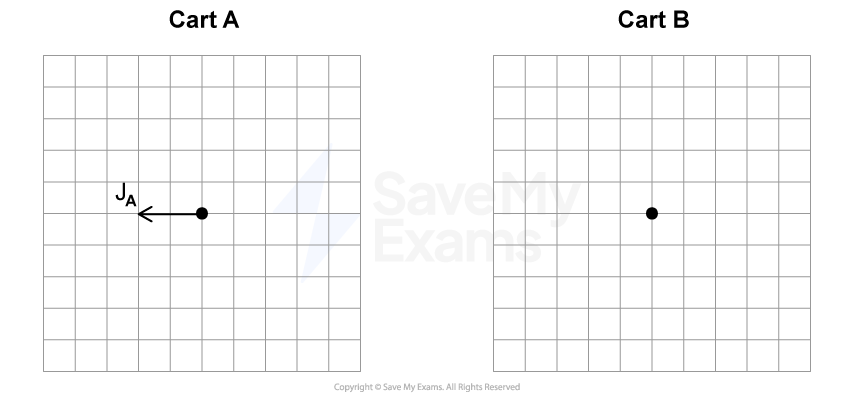
The dots in Figure 3 represent Cart A and B respectively. The arrow labeled space J subscript A represents the impulse exerted on Cart A.

Grid diagram with two labelled sections, Cart A and Cart B. Cart A has an arrow pointing left from a central dot, labelled 'J_A'. Cart B shows a central dot only.

Figure 3

ii) On the dot in Figure 3 representing Cart B, draw an arrow to represent the impulse exerted on Cart B.

  • The impulse must be represented by a distinct arrow starting on, and pointing away from, the dot.

  • The length of the arrow should reflect the relative magnitude of the impulse exerted on Cart A.

5b
Sme Calculator
3 marks

After the collision, Cart A rebounds with the same speed.

Derive an expression for the final speed of Cart B in terms of v subscript B.

5c
Sme Calculator
4 marks

On the axes provided in Figure 4, sketch a graph of the momentum of the carts as a function of time.

Two graphs compare momentum over time for Cart A and Cart B. Both axes are labelled, with momentum on the y-axis and time on the x-axis.

Figure 4

5d
Sme Calculator
2 marks

A spring is attached to the force sensor and the experiment is repeated. The carts collide with the spring, with both Cart A and Cart B having the same initial and final velocities as in the first collision. In the original collision without the spring, the magnitude of the average net force exerted on the carts is F subscript 0. In the collision with the spring, the magnitude of the average net force exerted on the carts is F subscript S.

Indicate whether the magnitude of F subscript S is greater than, less than, or equal to the magnitude of F subscript 0.

⎽⎽⎽⎽⎽⎽⎽⎽⎽⎽ F subscript S space greater than space F subscript 0‎ ‎ ‎ ‎ ‎ ‎ ‎ ‎ ‎ ‎ ⎽⎽⎽⎽⎽⎽⎽⎽⎽⎽ F subscript S space equals space F subscript 0 ‎ ‎ ‎‎ ‎ ‎ ‎ ‎ ‎ ‎ ⎽⎽⎽⎽⎽⎽⎽⎽⎽⎽ F subscript S space less than space F subscript 0

Justify your reasoning.

Did this page help you?