Graphical Representation of SHM (College Board AP® Physics 1: Algebra-Based)

Study Guide

Dan Mitchell-Garnett

Written by: Dan Mitchell-Garnett

Reviewed by: Caroline Carroll

Updated on

Graphical representation of SHM

  • Displacement, velocity and acceleration all vary throughout each cycle in SHM

  • This can be shown graphically

  • The graphs of each quantity look different, depending on the start position of the system in SHM:

    • The system may start at the amplitude position (i.e. maximum displacement)

    • The system may start at the equilibrium position

Quantities in SHM starting from maximum displacement
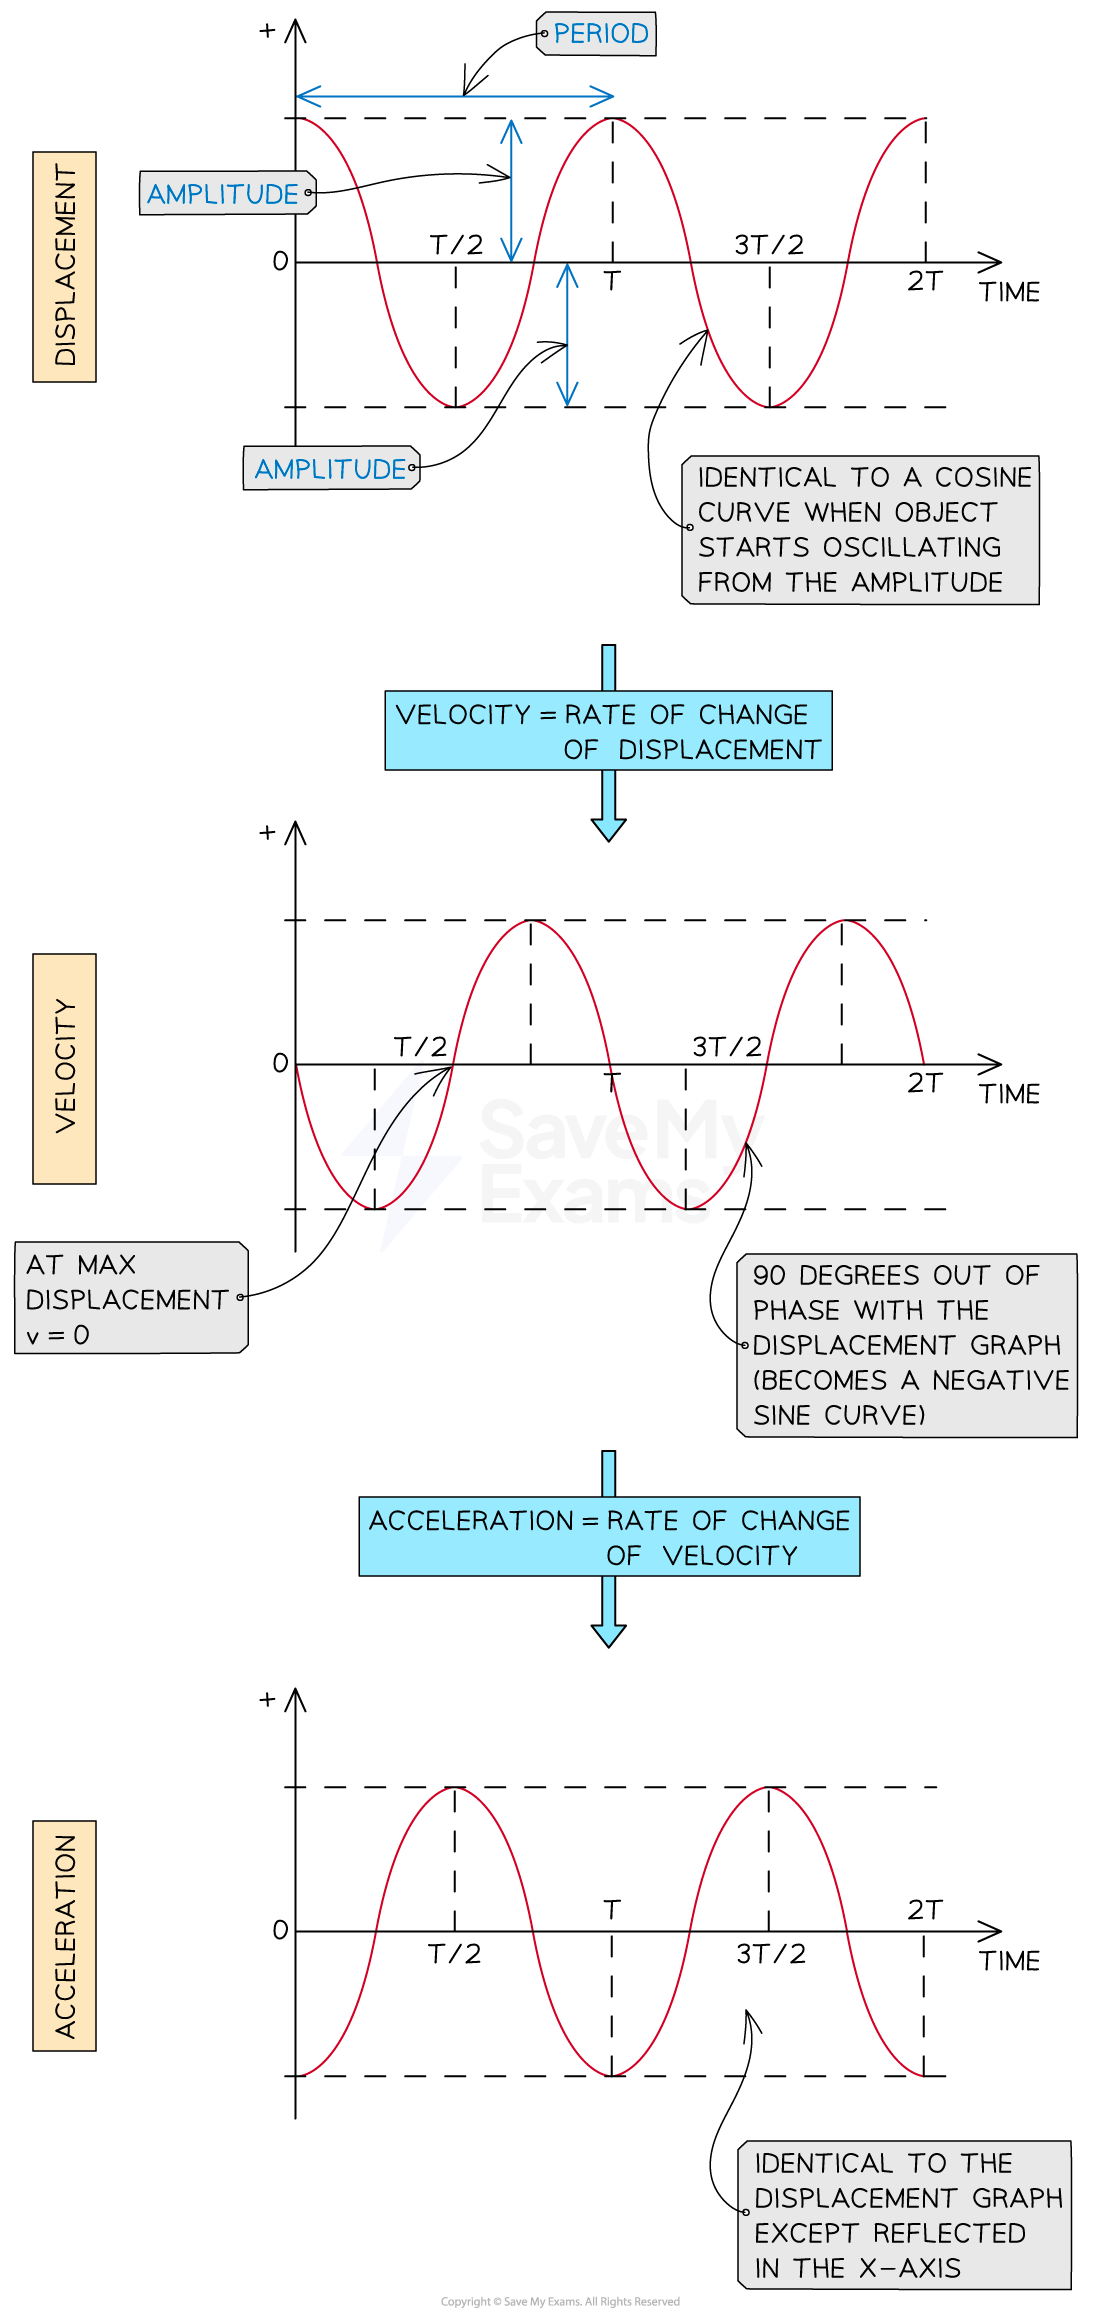
Three sinusoidal graphs showing the variation of displacement, velocity and acceleration in SHM. Displacement forms a cosine curve, velocity forms a negative sine curve and acceleration forms a negative cosine curve.
The displacement begins at a maximum. Consequently, the velocity starts at zero and acceleration starts at a minimum.
  • In the above graphs starting from the positive amplitude position:

    • Displacement begins with a maximum value and then oscillates

    • Velocity begins at zero and then oscillates

    • Acceleration begins with a minimum value and then oscillates

    • All oscillate with the same frequency

Quantities in SHM starting from equilibrium
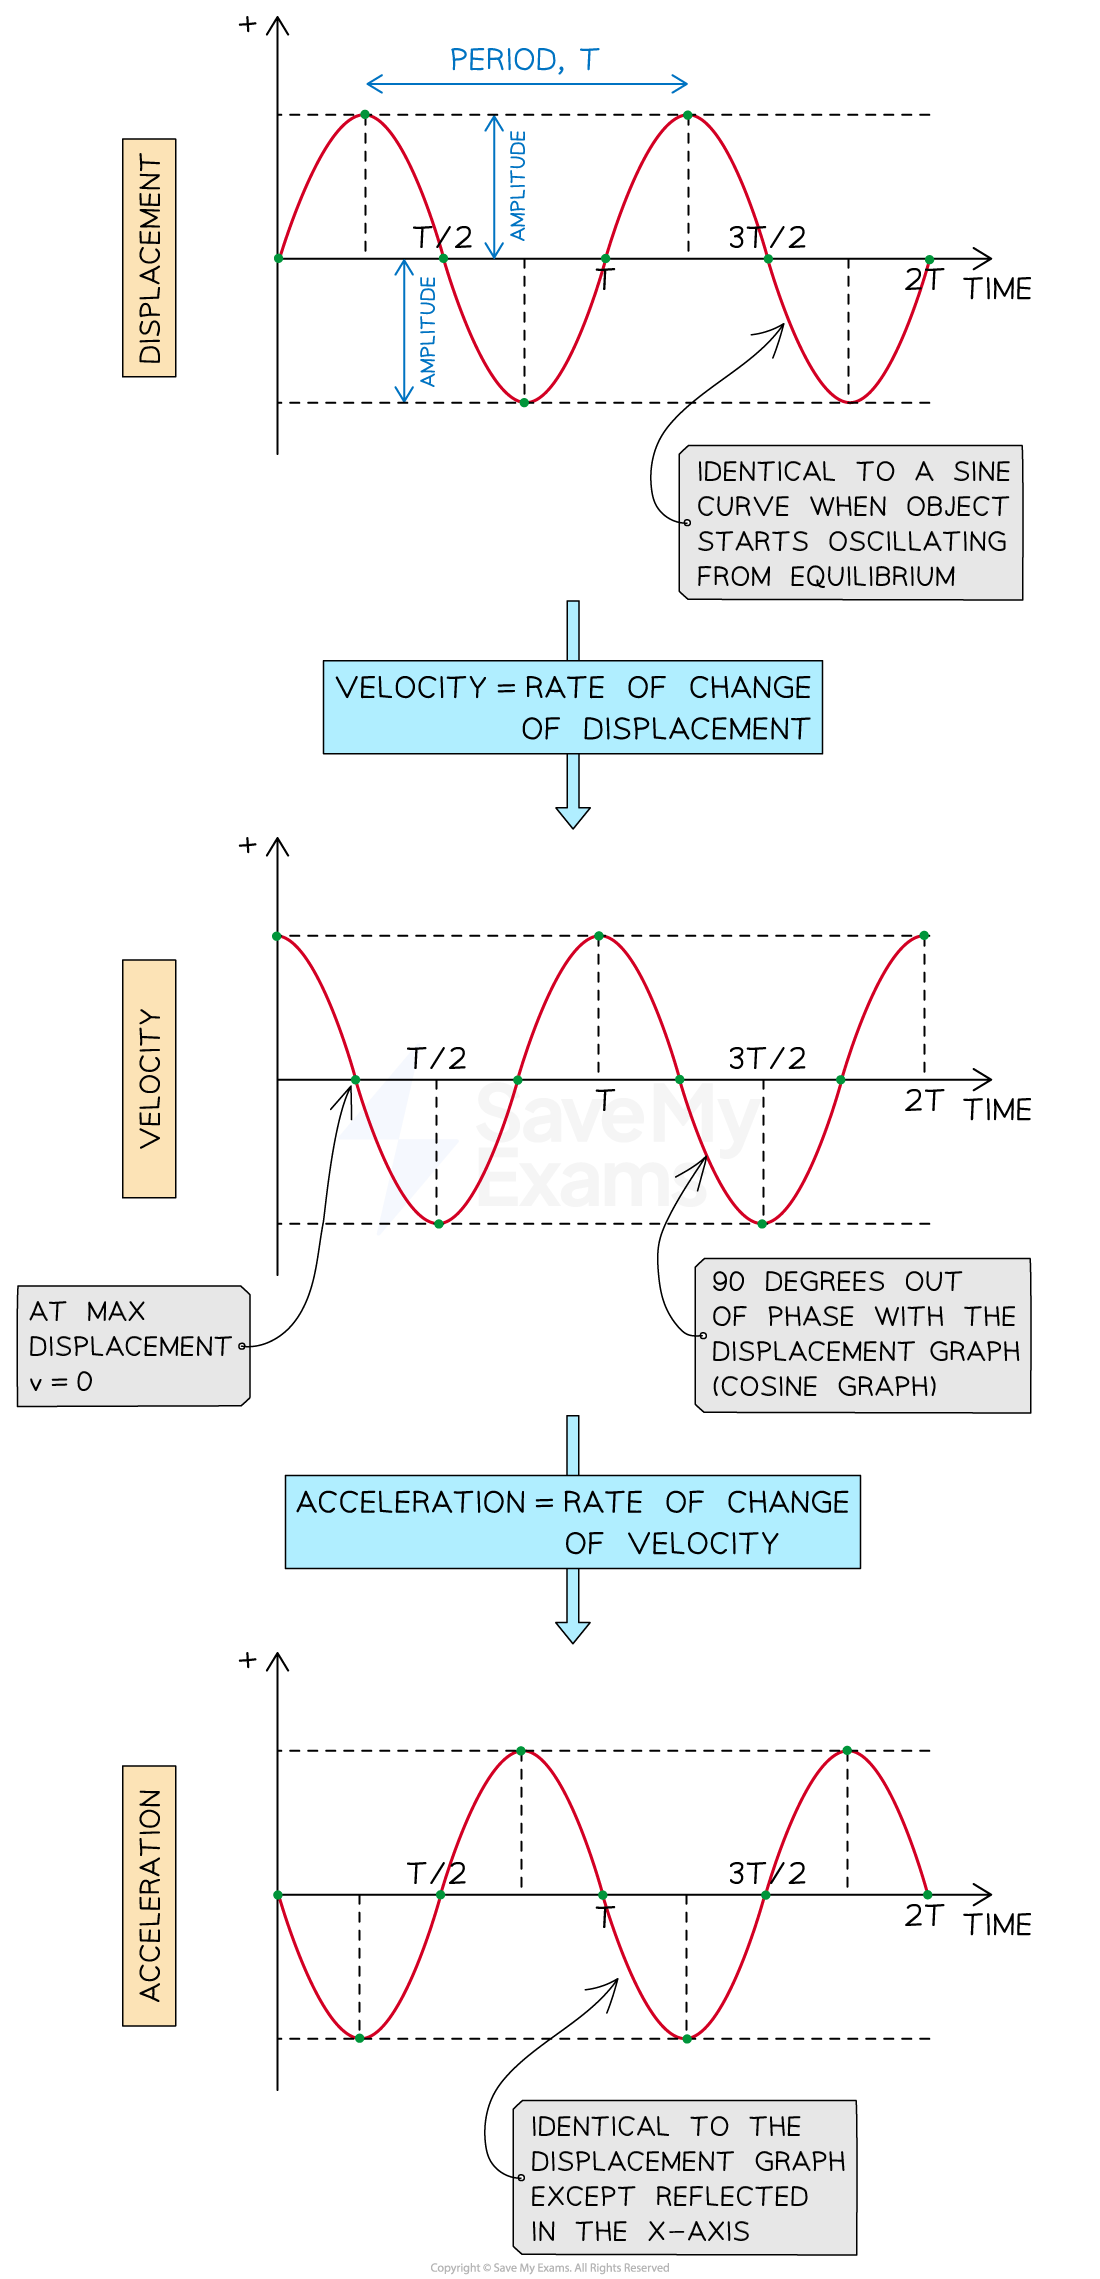
Graphical representation of displacement, velocity, and acceleration in oscillatory motion. Displacement is a sine wave; velocity is a cosine wave; acceleration is inverted displacement.
The displacement begins at zero. Consequently, the velocity starts at a maximum and acceleration starts at zero.
  • In the above graphs starting from the equilibrium:

    • Displacement begins at zero and then oscillates

    • Velocity begins at a maximum value and then oscillates

    • Acceleration begins at zero and then oscillates

    • All oscillate with the same frequency

Translating between graphs

  • Recall that velocity is the rate of change of displacement

    • On a displacement-time graph, the rate of change of displacement is represented by the gradient

  • The velocity-time graph for an object in SHM can also be produced by plotting the gradient of a displacement-time graph against time

    • Just plotting the zeroes, maxima and minima gives enough information to plot the graph

  • The same can be done to a velocity-time graph to produce an acceleration graph

Gradient of a displacement graph

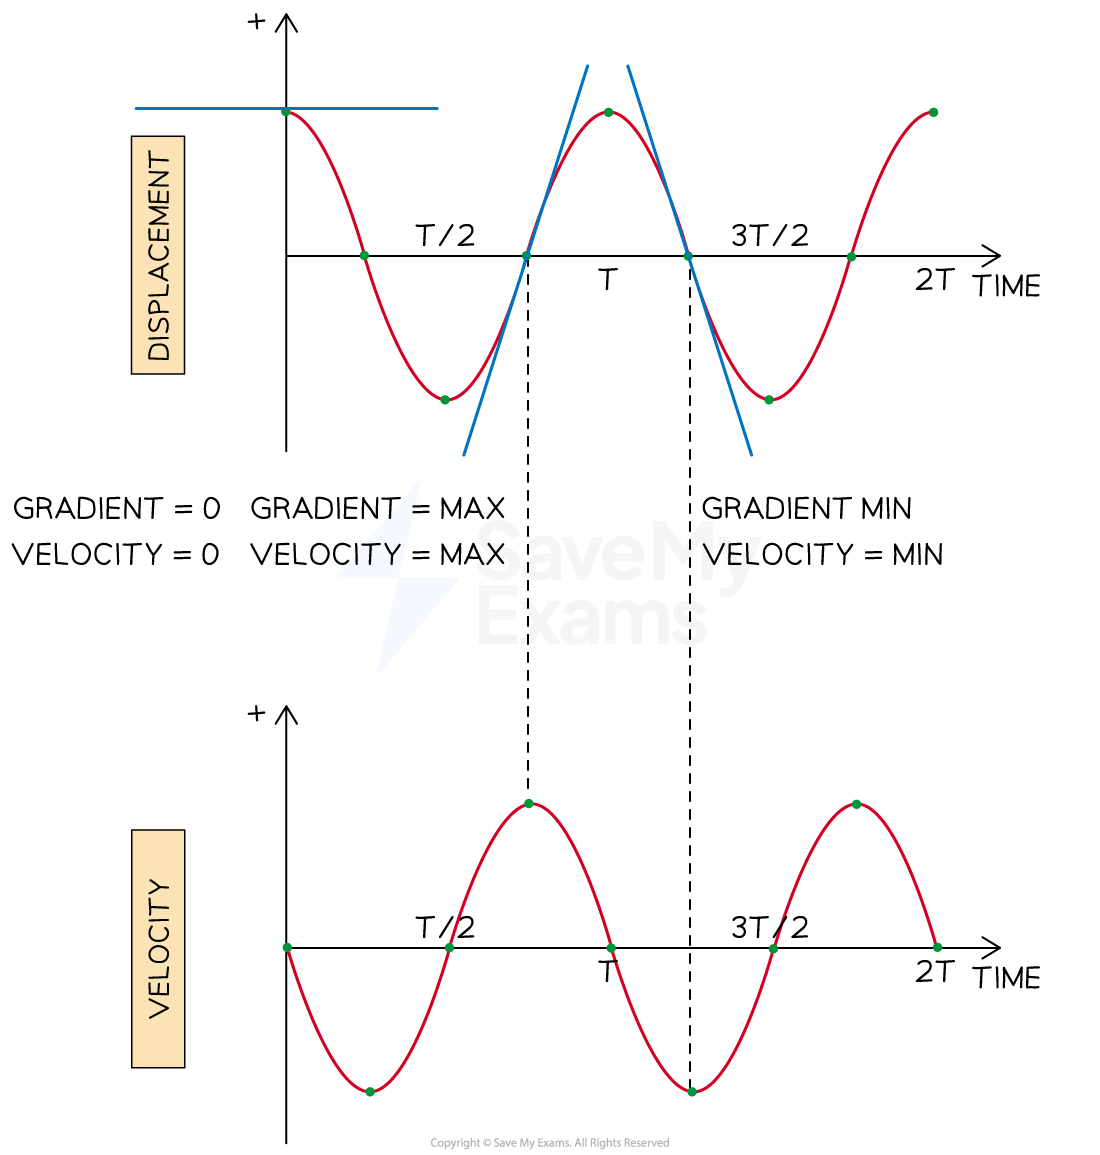
Graph showing displacement and velocity over time for harmonic motion. Where displacement has a gradient of zero, velocity has a value of zero. Where displacement has maximum or minimum gradient, velocity is maximum or minimum.
Take the instantaneous gradient of a displacement graph by finding the tangent to the line and finding the tangent's gradient. Plotting this gives the velocity graph.

Gradient of a velocity graph

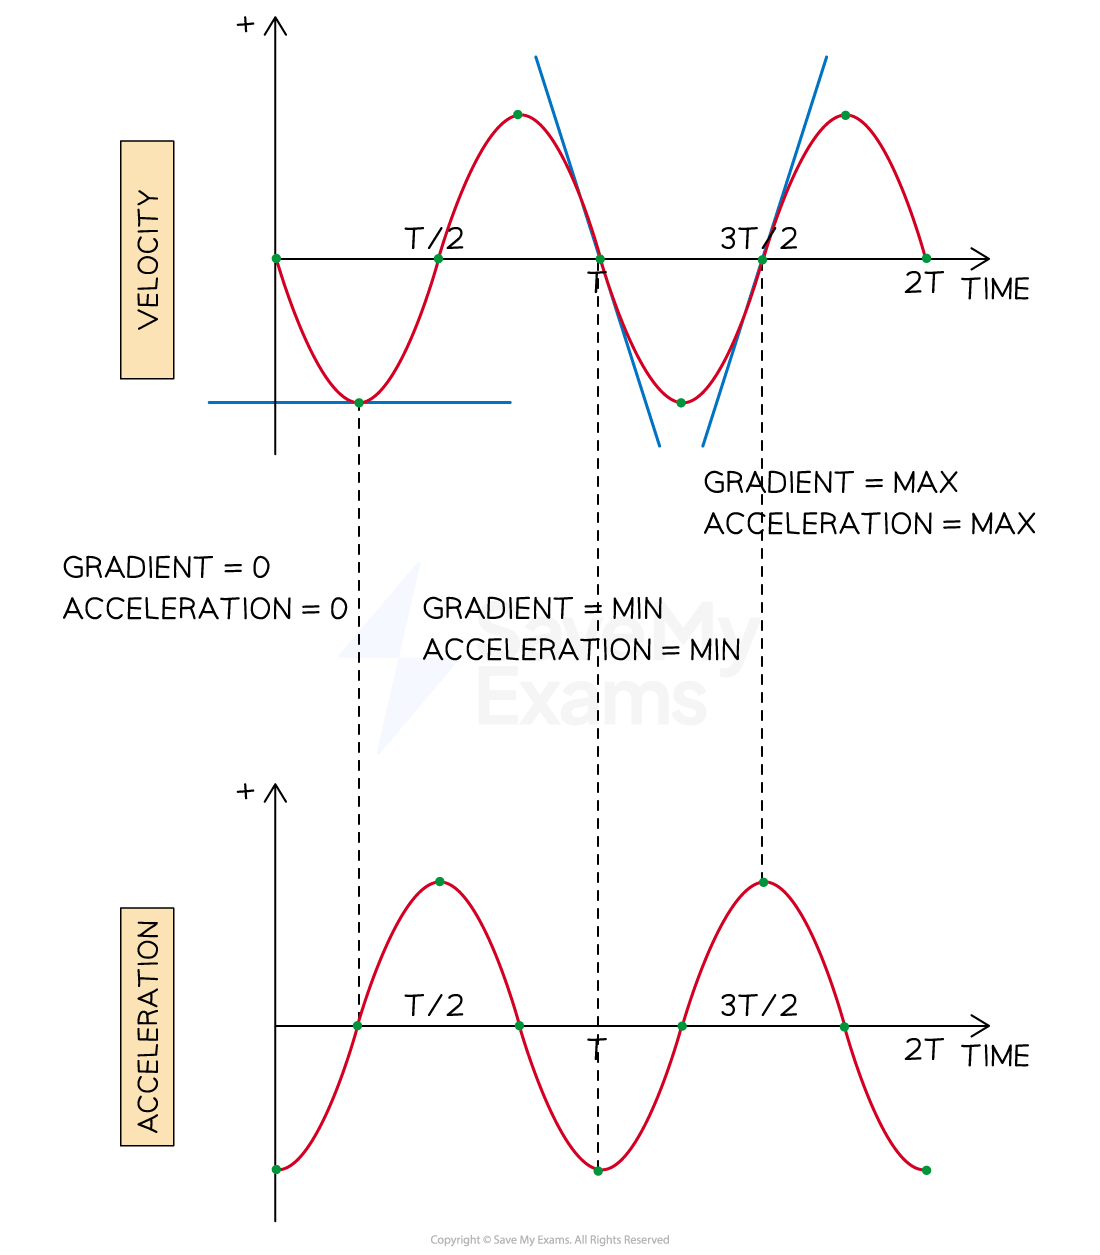
Graphs showing velocity and acceleration over time for harmonic motion. Where velocity has a gradient of zero, acceleration has a value of zero. Where velocity has maximum or minimum gradient, acceleration is maximum or minimum.
Take the instantaneous gradient of a velocity graph by finding the tangent to the line and finding the tangent's gradient. Plotting this gives the acceleration graph.

Worked Example

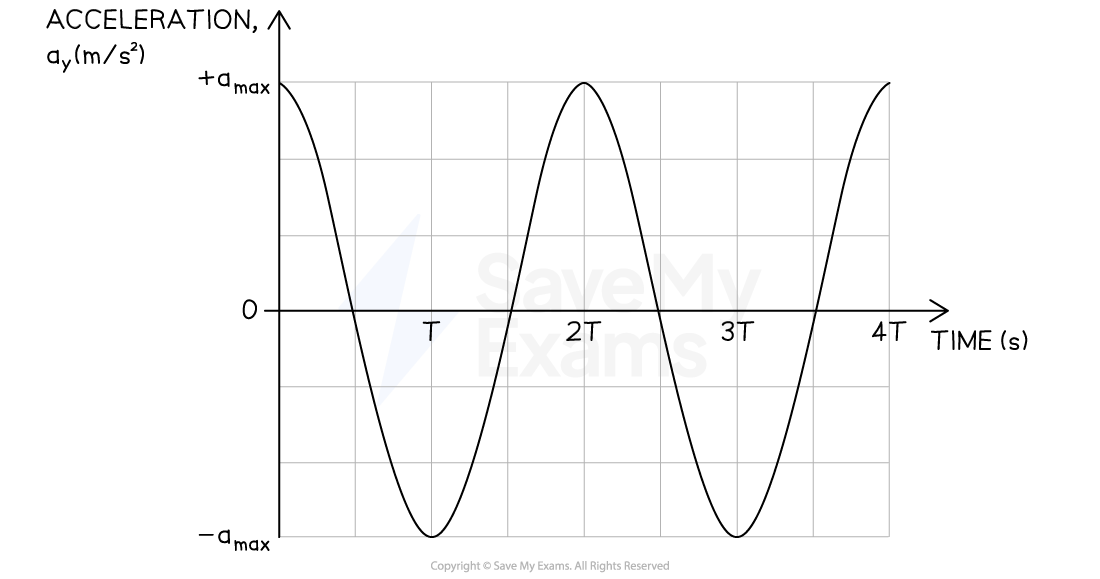
A sinusoidal graph of acceleration against time. It begins at a maximum of a_max, and drops to a minimum of minus a_max at time T. It then rises back up to a_max at time 2T and continues in this fashion.

A system features a vertical spring of spring constant k. An object of mass mis suspended from the spring and oscillates in simple harmonic motion with amplitude A.

Describe the starting position of the object if upwards is defined as the positive direction in the system. Justify your answer.

Answer:

Step 1: Analyze the scenario

  • From the acceleration graph, the system begins with acceleration at a maximum

Step 2: Apply the specific conditions

  • The system is in SHM

    • Recall that the condition for SHM is that acceleration is proportional to displacement but in the opposite direction

  • Upwards is the positive direction, so displacement below equilibrium will be negative and displacement above will be positive

Step 3: Describe the starting position

  • The object will be a distance A below the equilibrium position

Step 4: Justify the answer

  • If initial acceleration is at its greatest magnitude and positive, initial displacement will be at its greatest magnitude but negative

    • Displacement will be at a minimum

  • Negative displacement is below equilibrium position

Sign up now. It’s free!

Join the 100,000+ Students that ❤️ Save My Exams

the (exam) results speak for themselves:

Did this page help you?

Dan Mitchell-Garnett

Author: Dan Mitchell-Garnett

Expertise: Physics Content Creator

Dan graduated with a First-class Masters degree in Physics at Durham University, specialising in cell membrane biophysics. After being awarded an Institute of Physics Teacher Training Scholarship, Dan taught physics in secondary schools in the North of England before moving to Save My Exams. Here, he carries on his passion for writing challenging physics questions and helping young people learn to love physics.

Caroline Carroll

Author: Caroline Carroll

Expertise: Physics Subject Lead

Caroline graduated from the University of Nottingham with a degree in Chemistry and Molecular Physics. She spent several years working as an Industrial Chemist in the automotive industry before retraining to teach. Caroline has over 12 years of experience teaching GCSE and A-level chemistry and physics. She is passionate about creating high-quality resources to help students achieve their full potential.