Impulse Graphs (College Board AP® Physics 1: Algebra-Based): Study Guide

Force-time graph
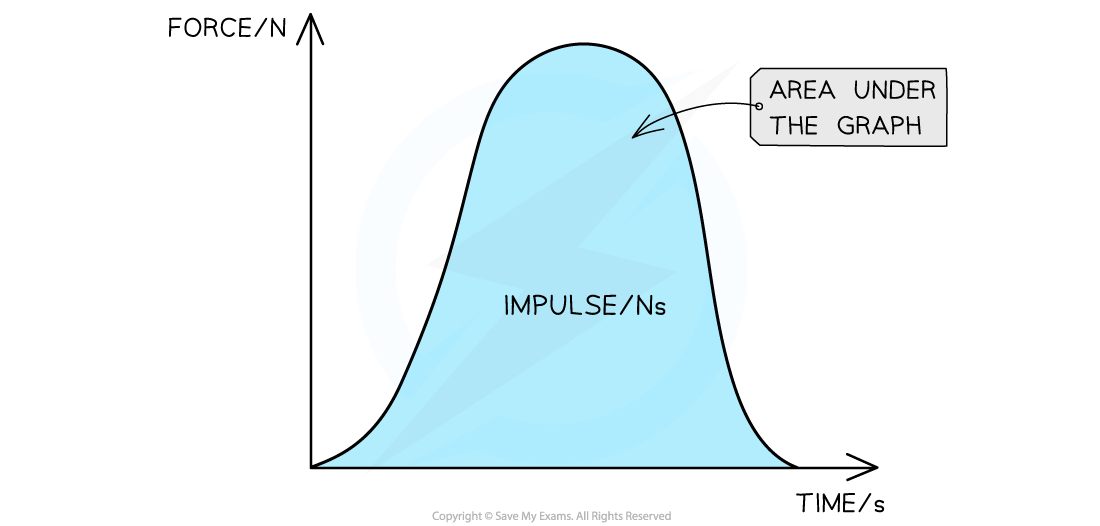
In real-life scenarios, forces are often not constant and will vary over time
A changing force can be plotted as a function of time
The impulse delivered to a system is equal to the product of force and time
Therefore, the area under the force-time graph is equal to
impulse
change in momentum
![]()
Determining impulse from a force-time graph
Comparing impulse using force-time graphs
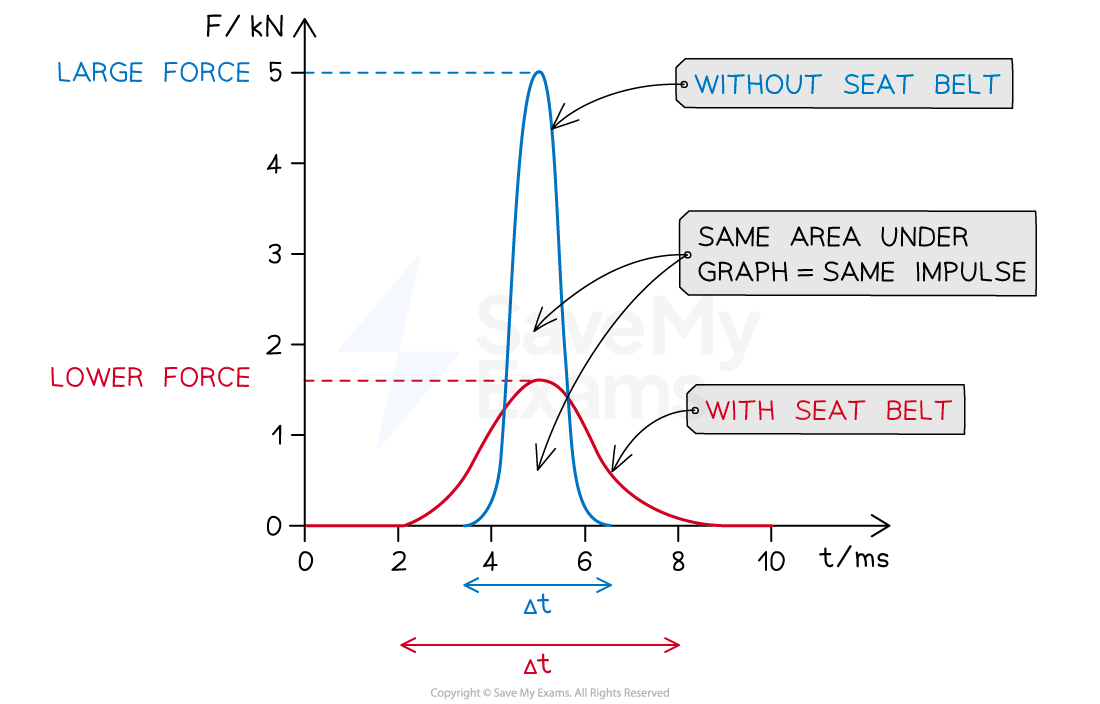
In a collision, the force of an impact can be reduced by increasing the contact time over which the collision occurs
For example, cars include seatbelts which are able to stretch and increase the collision time
In a vehicle collision, if the passenger is not wearing a seat belt, they will experience
a larger maximum force
a shorter collision time
If the passenger is wearing a seat belt, they will experience
a lower maximum force
a longer collision time
On a force-time graph:
the case of a passenger not wearing a seat belt is represented by a higher peak and narrower base
the case of a passenger wearing a seat belt is represented by a lower peak and wider base
Since the change in momentum (impulse) is the same for both cases, the area under the curves is the same
Force-time graphs for a vehicle collision
Worked Example
The graph shows the force applied to an object of mass ![]() as a function of time. The object has an initial velocity of
as a function of time. The object has an initial velocity of ![]() at t = 0.
at t = 0.
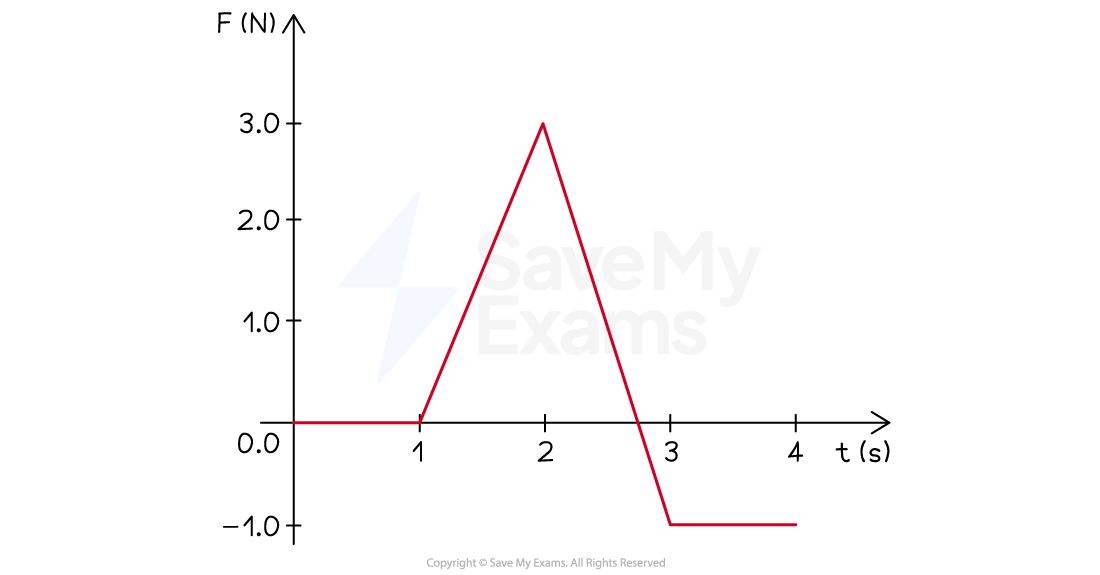
(A) What is the impulse delivered to the object from t = 1 to t = 3 s?
(B) What is the velocity of the object at t = 4 s?
Answer:
Part (A)
Step 1: Analyze the scenario
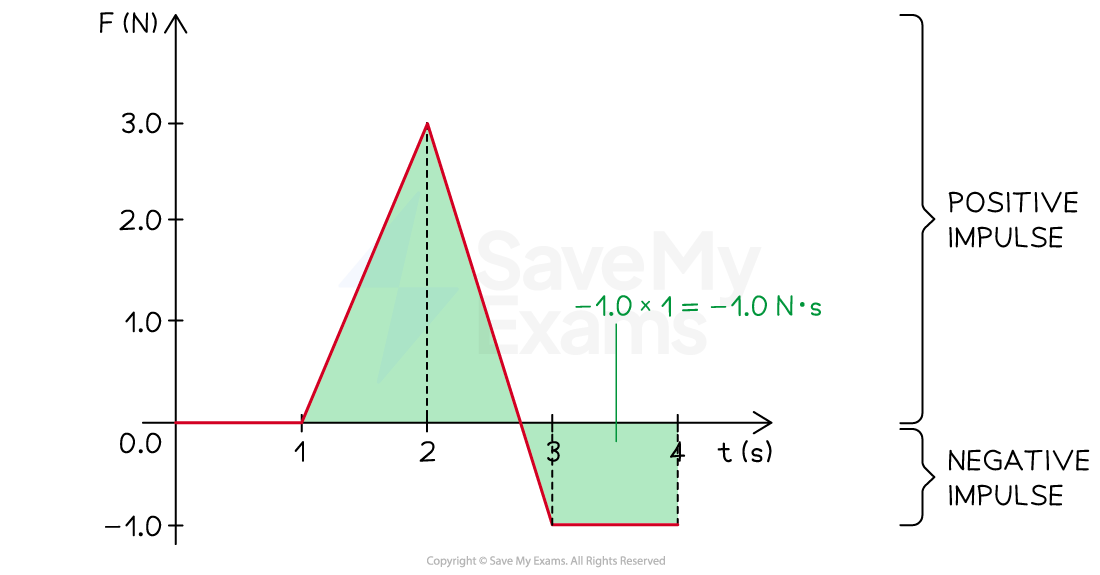
From t = 1 to t = 2 s, the force increases to a maximum of 3.0 N and then, from t = 2 s to t = 3 s decreases to a minimum of -1.0 N
At approximately t = 2.7 s, the direction of the applied force changes
The impulse delivered to the object from t = 1 to t = 3 s is equal to the area under the graph between these times
Step 2: Determine the impulse delivered between t = 1 to t = 3 s
The impulse is the area under the graph. The graph can be split up into three right-angled triangles
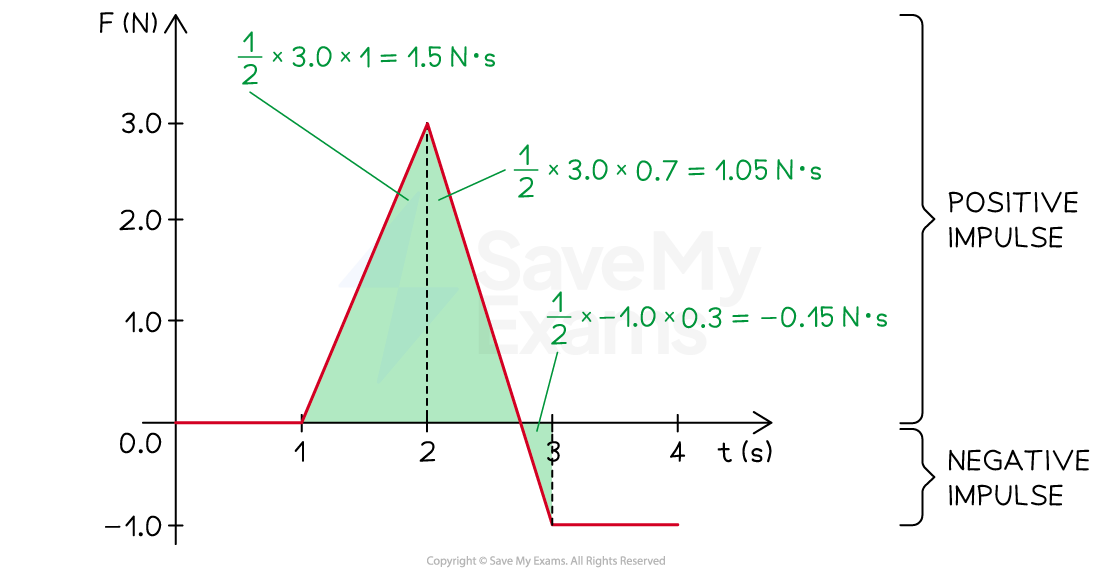
Remember that when the graph is negative, the area is also negative
![]()
![]()
Part (B)
Step 1: Analyze the scenario
The impulse delivered to the object over the 4 s interval changes its momentum
From t = 0 to t = 1 s, no forces act, hence no impulse is delivered, so the velocity at t = 1 s is still +2.5 m/s
From t = 1 to t = 3 s, the impulse delivered to the object is 2.4 N⋅s
From t = 3 to t = 4 s, the impulse delivered to the object is equal to the area under the graph in this interval
Step 2: Determine the total impulse delivered over the 4 s interval
The impulse delivered between t = 3 to t = 4 s is the area under the graph
The total impulse delivered between t = 0 and t = 4 s is:
![]()
Step 3: Determine the final velocity of the object
The impulse changes the momentum and velocity of the object
![]()
Where
 = 2 kg and
 format('truetype')%3Bfont-weight%3Anormal%3Bfont-style%3Anormal%3B%7D%3C%2Fstyle%3E%3C%2Fdefs%3E%3Ctext%20font-family%3D%22math12bba9f4124283edd644799e0ce%22%20font-size%3D%2212%22%20text-anchor%3D%22middle%22%20x%3D%226.5%22%20y%3D%2210%22%3E%26%23x2192%3B%3C%2Ftext%3E%3Ctext%20font-family%3D%22Times%20New%20Roman%22%20font-size%3D%2218%22%20font-style%3D%22italic%22%20text-anchor%3D%22middle%22%20x%3D%225.5%22%20y%3D%2218%22%3Ev%3C%2Ftext%3E%3Ctext%20font-family%3D%22Times%20New%20Roman%22%20font-size%3D%2213%22%20text-anchor%3D%22middle%22%20x%3D%2215.5%22%20y%3D%2226%22%3E0%3C%2Ftext%3E%3C%2Fsvg%3E) = +2.5 m/s, therefore, at t = 4 s:
= +2.5 m/s, therefore, at t = 4 s:
![]()
![]()
Worked Example
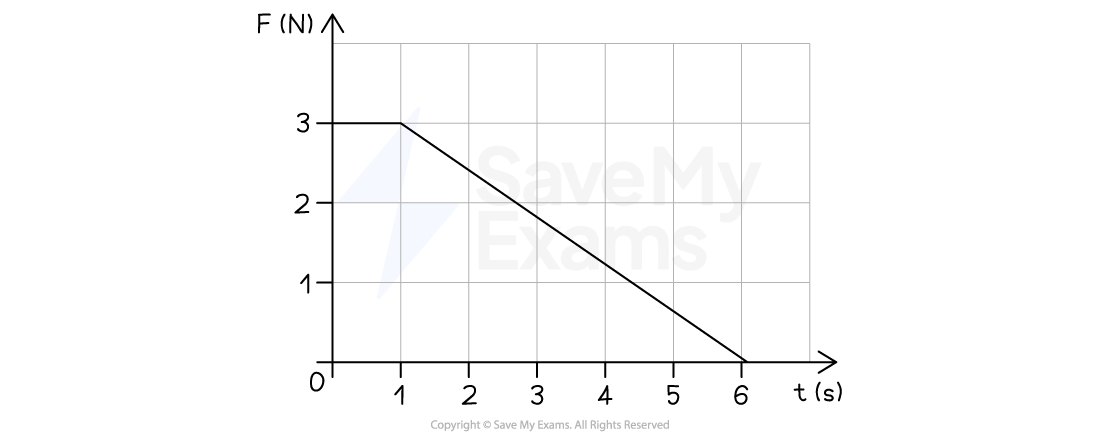
A horizontal force is applied to a 5 kg box which is initially at rest. The box begins to move along a frictionless horizontal surface. The graph shows the magnitude of the force as a function of time.
(A) In which 1-second interval is the impulse applied to the box the greatest? Explain your reasoning.
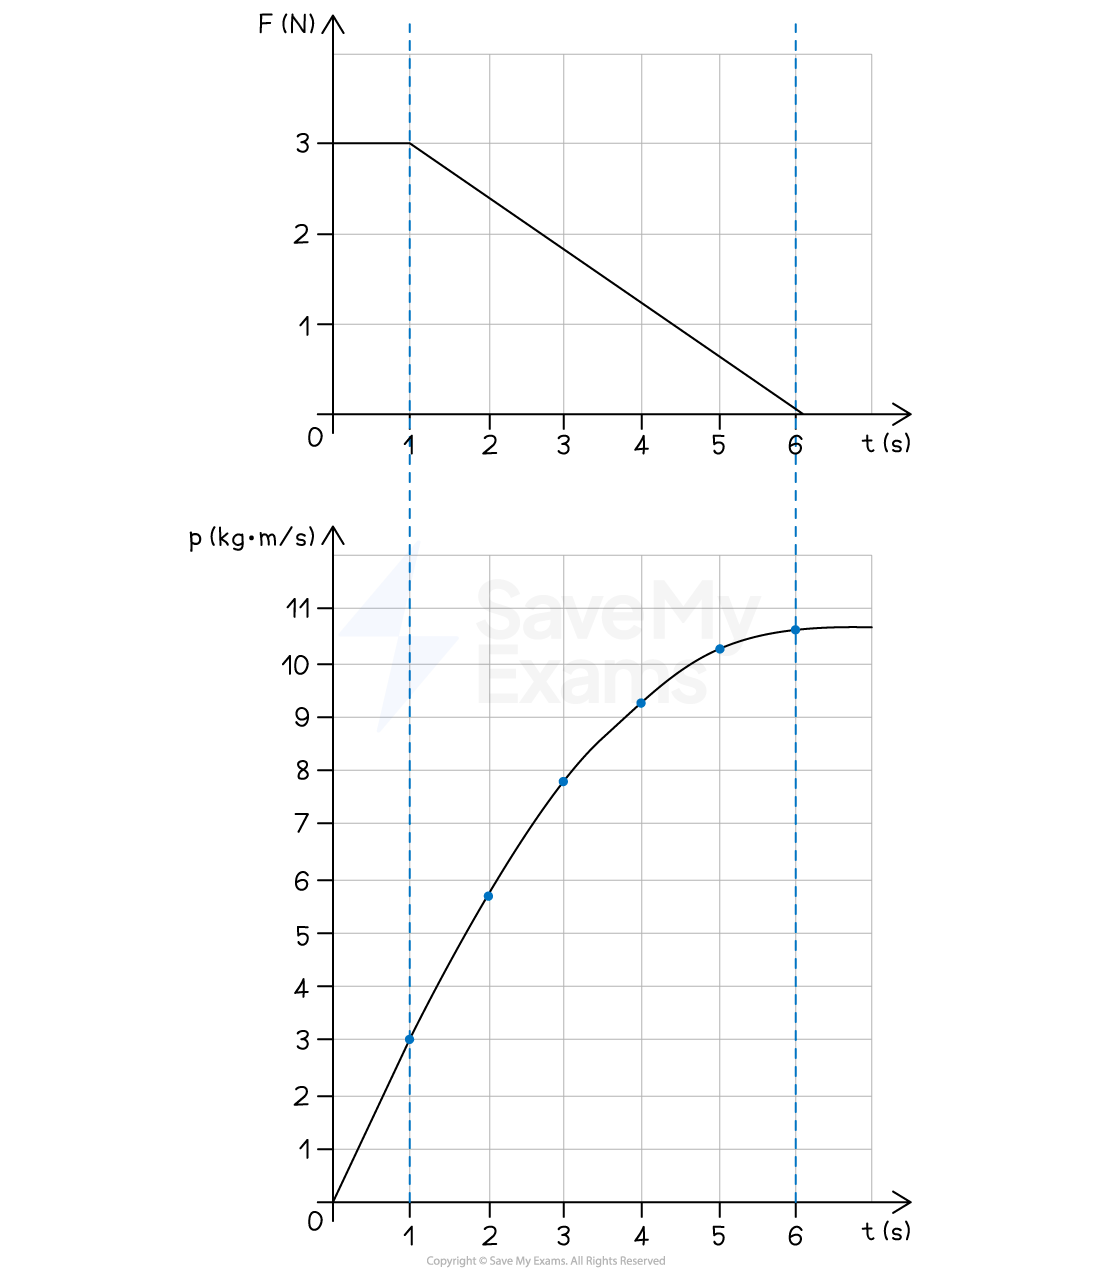
(B) Using the graph, plot the momentum as a function of time.
(C) Calculate the velocity of the box after 6 seconds.
Answer:
Part (A)
Step 1: Identify the interval the impulse has the greatest magnitude
The impulse has the greatest magnitude during the interval t = 0 to t = 1 s
Step 2: Give a justification for your answer
Impulse is equal to the area under the force-time graph
Therefore, the larger the area, the greater the magnitude of the impulse
Part (B)
Step 1: Analyze the scenario
The force applied to the box has a constant value of 3 N in the interval t = 0 s to t = 1 s
During this time, momentum increases at a constant rate
The force then decreases linearly from 3 N to 0 N in the interval t = 1 s to t = 6 s
During this time, momentum continues to increase at a decreasing rate
Step 2: Determine the change in momentum in each interval
Impulse, or change in momentum, is equal to the area under the force-time graph
![]()
The box is initially at rest, so the momentum is initially zero
Time (s) | Change in momentum (kg∙m/s) | Momentum (kg∙m/s) |
|---|---|---|
0 | 0 | 0 |
1 | 3.0 | 3.0 |
2 | 2.7 | 5.7 |
3 | 2.1 | 7.8 |
4 | 1.5 | 9.3 |
5 | 0.9 | 10.2 |
6 | 0.3 | 10.5 |
Step 3: Plot the momentum-time graph
Part (C)
Step 1: List the known quantities
Mass of the box,
format('truetype')%3Bfont-weight%3Anormal%3Bfont-style%3Anormal%3B%7D%3C%2Fstyle%3E%3C%2Fdefs%3E%3Ctext%20font-family%3D%22Times%20New%20Roman%22%20font-size%3D%2218%22%20font-style%3D%22italic%22%20text-anchor%3D%22middle%22%20x%3D%227.5%22%20y%3D%2216%22%3Em%3C%2Ftext%3E%3Ctext%20font-family%3D%22math17f39f8317fbdb1988ef4c628eb%22%20font-size%3D%2216%22%20text-anchor%3D%22middle%22%20x%3D%2227.5%22%20y%3D%2216%22%3E%3D%3C%2Ftext%3E%3Ctext%20font-family%3D%22Times%20New%20Roman%22%20font-size%3D%2218%22%20text-anchor%3D%22middle%22%20x%3D%2244.5%22%20y%3D%2216%22%3E5%3C%2Ftext%3E%3Ctext%20font-family%3D%22Times%20New%20Roman%22%20font-size%3D%2218%22%20text-anchor%3D%22middle%22%20x%3D%2262.5%22%20y%3D%2216%22%3Ekg%3C%2Ftext%3E%3C%2Fsvg%3E)
Initial velocity,
format('truetype')%3Bfont-weight%3Anormal%3Bfont-style%3Anormal%3B%7D%3C%2Fstyle%3E%3C%2Fdefs%3E%3Ctext%20font-family%3D%22math170e5bff8283fd82802572136e2%22%20font-size%3D%2212%22%20text-anchor%3D%22middle%22%20x%3D%226.5%22%20y%3D%2210%22%3E%26%23x2192%3B%3C%2Ftext%3E%3Ctext%20font-family%3D%22Times%20New%20Roman%22%20font-size%3D%2218%22%20font-style%3D%22italic%22%20text-anchor%3D%22middle%22%20x%3D%225.5%22%20y%3D%2218%22%3Ev%3C%2Ftext%3E%3Ctext%20font-family%3D%22Times%20New%20Roman%22%20font-size%3D%2213%22%20text-anchor%3D%22middle%22%20x%3D%2215.5%22%20y%3D%2226%22%3E0%3C%2Ftext%3E%3Ctext%20font-family%3D%22math170e5bff8283fd82802572136e2%22%20font-size%3D%2216%22%20text-anchor%3D%22middle%22%20x%3D%2231.5%22%20y%3D%2218%22%3E%3D%3C%2Ftext%3E%3Ctext%20font-family%3D%22Times%20New%20Roman%22%20font-size%3D%2218%22%20text-anchor%3D%22middle%22%20x%3D%2248.5%22%20y%3D%2218%22%3E0%3C%2Ftext%3E%3C%2Fsvg%3E)
From the graph, the change in momentum (between t = 0 and t = 6 s) is equal to
format('truetype')%3Bfont-weight%3Anormal%3Bfont-style%3Anormal%3B%7D%3C%2Fstyle%3E%3C%2Fdefs%3E%3Ctext%20font-family%3D%22math17a5701497eda309d696aa5a440%22%20font-size%3D%2216%22%20text-anchor%3D%22middle%22%20x%3D%227.5%22%20y%3D%2218%22%3E%26%23x2206%3B%3C%2Ftext%3E%3Ctext%20font-family%3D%22math17a5701497eda309d696aa5a440%22%20font-size%3D%2212%22%20text-anchor%3D%22middle%22%20x%3D%2221.5%22%20y%3D%2210%22%3E%26%23x2192%3B%3C%2Ftext%3E%3Ctext%20font-family%3D%22Times%20New%20Roman%22%20font-size%3D%2218%22%20font-style%3D%22italic%22%20text-anchor%3D%22middle%22%20x%3D%2220.5%22%20y%3D%2218%22%3Ep%3C%2Ftext%3E%3Ctext%20font-family%3D%22math17a5701497eda309d696aa5a440%22%20font-size%3D%2216%22%20text-anchor%3D%22middle%22%20x%3D%2239.5%22%20y%3D%2218%22%3E%3D%3C%2Ftext%3E%3Ctext%20font-family%3D%22Times%20New%20Roman%22%20font-size%3D%2218%22%20text-anchor%3D%22middle%22%20x%3D%2261.5%22%20y%3D%2218%22%3E10%3C%2Ftext%3E%3Ctext%20font-family%3D%22math17a5701497eda309d696aa5a440%22%20font-size%3D%2216%22%20text-anchor%3D%22middle%22%20x%3D%2272.5%22%20y%3D%2218%22%3E.%3C%2Ftext%3E%3Ctext%20font-family%3D%22Times%20New%20Roman%22%20font-size%3D%2218%22%20text-anchor%3D%22middle%22%20x%3D%2279.5%22%20y%3D%2218%22%3E5%3C%2Ftext%3E%3Ctext%20font-family%3D%22Times%20New%20Roman%22%20font-size%3D%2218%22%20text-anchor%3D%22middle%22%20x%3D%2297.5%22%20y%3D%2218%22%3Ekg%3C%2Ftext%3E%3Ctext%20font-family%3D%22math17a5701497eda309d696aa5a440%22%20font-size%3D%2216%22%20text-anchor%3D%22middle%22%20x%3D%22111.5%22%20y%3D%2218%22%3E%26%23xB7%3B%3C%2Ftext%3E%3Ctext%20font-family%3D%22Times%20New%20Roman%22%20font-size%3D%2218%22%20text-anchor%3D%22middle%22%20x%3D%22123.5%22%20y%3D%2218%22%3Em%3C%2Ftext%3E%3Ctext%20font-family%3D%22math17a5701497eda309d696aa5a440%22%20font-size%3D%2216%22%20text-anchor%3D%22middle%22%20x%3D%22135.5%22%20y%3D%2218%22%3E%2F%3C%2Ftext%3E%3Ctext%20font-family%3D%22Times%20New%20Roman%22%20font-size%3D%2218%22%20text-anchor%3D%22middle%22%20x%3D%22144.5%22%20y%3D%2218%22%3Es%3C%2Ftext%3E%3C%2Fsvg%3E)
Step 2: Write an expression for the change in momentum
The change in momentum is equal to the product of the mass and the change in velocity
![]()
Step 3: Determine the final velocity of the object
![]()
![]()
Examiner Tips and Tricks
The shape of a force-time graph may be curved or straight
If the graph is a curve, the area can be found by counting the squares or approximating the areas using basic shapes
If the graph is made up of straight lines, split the graph into sections. The total area is the sum of the areas of each section
Momentum-time graph
A changing momentum can be plotted as a function of time
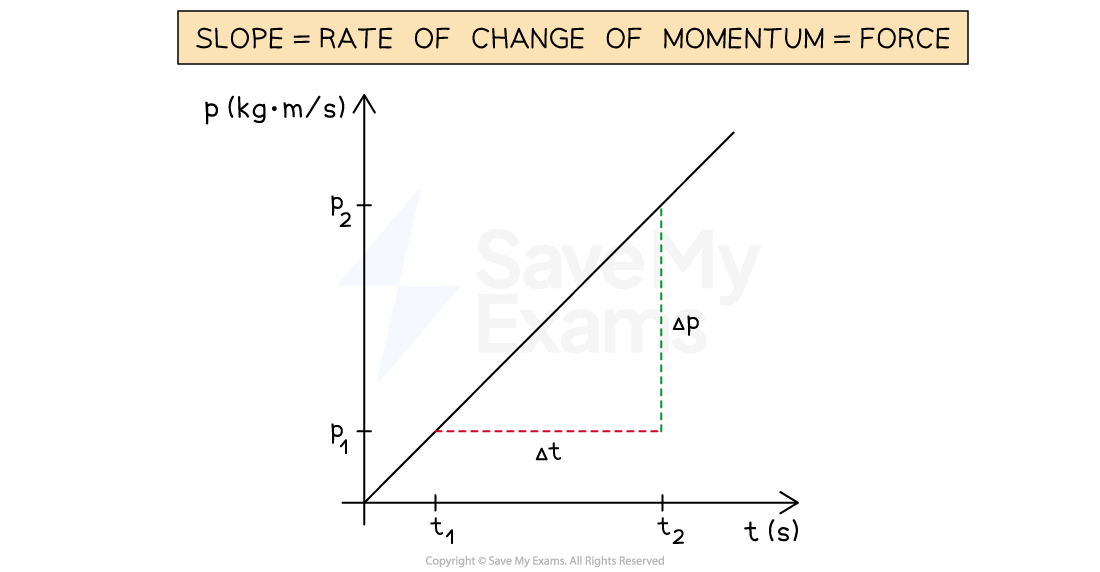
The net external force exerted on a system is equal to the rate of change of momentum
Therefore, force is equal to the slope of a momentum-time graph
format('truetype')%3Bfont-weight%3Anormal%3Bfont-style%3Anormal%3B%7D%3C%2Fstyle%3E%3C%2Fdefs%3E%3Ctext%20font-family%3D%22Times%20New%20Roman%22%20font-size%3D%2218%22%20text-anchor%3D%22middle%22%20x%3D%2219.5%22%20y%3D%2238%22%3Eslope%3C%2Ftext%3E%3Ctext%20font-family%3D%22math14c1bfa2a1a3fd3b0bed084f927%22%20font-size%3D%2216%22%20text-anchor%3D%22middle%22%20x%3D%2250.5%22%20y%3D%2238%22%3E%3D%3C%2Ftext%3E%3Cline%20stroke%3D%22%23000000%22%20stroke-linecap%3D%22square%22%20stroke-width%3D%221%22%20x1%3D%2265.5%22%20x2%3D%22131.5%22%20y1%3D%2231.5%22%20y2%3D%2231.5%22%2F%3E%3Ctext%20font-family%3D%22math14c1bfa2a1a3fd3b0bed084f927%22%20font-size%3D%2212%22%20text-anchor%3D%22middle%22%20x%3D%2273.5%22%20y%3D%2210%22%3E%26%23x2192%3B%3C%2Ftext%3E%3Ctext%20font-family%3D%22Times%20New%20Roman%22%20font-size%3D%2218%22%20font-style%3D%22italic%22%20text-anchor%3D%22middle%22%20x%3D%2272.5%22%20y%3D%2218%22%3Ep%3C%2Ftext%3E%3Ctext%20font-family%3D%22Times%20New%20Roman%22%20font-size%3D%2213%22%20text-anchor%3D%22middle%22%20x%3D%2282.5%22%20y%3D%2226%22%3E2%3C%2Ftext%3E%3Ctext%20font-family%3D%22math14c1bfa2a1a3fd3b0bed084f927%22%20font-size%3D%2216%22%20text-anchor%3D%22middle%22%20x%3D%2298.5%22%20y%3D%2218%22%3E%26%23x2212%3B%3C%2Ftext%3E%3Ctext%20font-family%3D%22math14c1bfa2a1a3fd3b0bed084f927%22%20font-size%3D%2212%22%20text-anchor%3D%22middle%22%20x%3D%22117.5%22%20y%3D%2210%22%3E%26%23x2192%3B%3C%2Ftext%3E%3Ctext%20font-family%3D%22Times%20New%20Roman%22%20font-size%3D%2218%22%20font-style%3D%22italic%22%20text-anchor%3D%22middle%22%20x%3D%22116.5%22%20y%3D%2218%22%3Ep%3C%2Ftext%3E%3Ctext%20font-family%3D%22Times%20New%20Roman%22%20font-size%3D%2213%22%20text-anchor%3D%22middle%22%20x%3D%22126.5%22%20y%3D%2226%22%3E1%3C%2Ftext%3E%3Ctext%20font-family%3D%22Times%20New%20Roman%22%20font-size%3D%2218%22%20font-style%3D%22italic%22%20text-anchor%3D%22middle%22%20x%3D%2275.5%22%20y%3D%2249%22%3Et%3C%2Ftext%3E%3Ctext%20font-family%3D%22Times%20New%20Roman%22%20font-size%3D%2213%22%20text-anchor%3D%22middle%22%20x%3D%2282.5%22%20y%3D%2257%22%3E2%3C%2Ftext%3E%3Ctext%20font-family%3D%22math14c1bfa2a1a3fd3b0bed084f927%22%20font-size%3D%2216%22%20text-anchor%3D%22middle%22%20x%3D%2298.5%22%20y%3D%2249%22%3E%26%23x2212%3B%3C%2Ftext%3E%3Ctext%20font-family%3D%22Times%20New%20Roman%22%20font-size%3D%2218%22%20font-style%3D%22italic%22%20text-anchor%3D%22middle%22%20x%3D%22113.5%22%20y%3D%2249%22%3Et%3C%2Ftext%3E%3Ctext%20font-family%3D%22Times%20New%20Roman%22%20font-size%3D%2213%22%20text-anchor%3D%22middle%22%20x%3D%22120.5%22%20y%3D%2257%22%3E1%3C%2Ftext%3E%3Ctext%20font-family%3D%22math14c1bfa2a1a3fd3b0bed084f927%22%20font-size%3D%2216%22%20text-anchor%3D%22middle%22%20x%3D%22146.5%22%20y%3D%2238%22%3E%3D%3C%2Ftext%3E%3Cline%20stroke%3D%22%23000000%22%20stroke-linecap%3D%22square%22%20stroke-width%3D%221%22%20x1%3D%22161.5%22%20x2%3D%22191.5%22%20y1%3D%2231.5%22%20y2%3D%2231.5%22%2F%3E%3Ctext%20font-family%3D%22math14c1bfa2a1a3fd3b0bed084f927%22%20font-size%3D%2216%22%20text-anchor%3D%22middle%22%20x%3D%22170.5%22%20y%3D%2224%22%3E%26%23x2206%3B%3C%2Ftext%3E%3Ctext%20font-family%3D%22math14c1bfa2a1a3fd3b0bed084f927%22%20font-size%3D%2212%22%20text-anchor%3D%22middle%22%20x%3D%22184.5%22%20y%3D%2216%22%3E%26%23x2192%3B%3C%2Ftext%3E%3Ctext%20font-family%3D%22Times%20New%20Roman%22%20font-size%3D%2218%22%20font-style%3D%22italic%22%20text-anchor%3D%22middle%22%20x%3D%22183.5%22%20y%3D%2224%22%3Ep%3C%2Ftext%3E%3Ctext%20font-family%3D%22math14c1bfa2a1a3fd3b0bed084f927%22%20font-size%3D%2216%22%20text-anchor%3D%22middle%22%20x%3D%22173.5%22%20y%3D%2249%22%3E%26%23x2206%3B%3C%2Ftext%3E%3Ctext%20font-family%3D%22Times%20New%20Roman%22%20font-size%3D%2218%22%20font-style%3D%22italic%22%20text-anchor%3D%22middle%22%20x%3D%22183.5%22%20y%3D%2249%22%3Et%3C%2Ftext%3E%3Ctext%20font-family%3D%22math14c1bfa2a1a3fd3b0bed084f927%22%20font-size%3D%2216%22%20text-anchor%3D%22middle%22%20x%3D%22206.5%22%20y%3D%2238%22%3E%3D%3C%2Ftext%3E%3Ctext%20font-family%3D%22math14c1bfa2a1a3fd3b0bed084f927%22%20font-size%3D%2212%22%20text-anchor%3D%22middle%22%20x%3D%22225.5%22%20y%3D%2226%22%3E%26%23x2192%3B%3C%2Ftext%3E%3Ctext%20font-family%3D%22Times%20New%20Roman%22%20font-size%3D%2218%22%20font-style%3D%22italic%22%20text-anchor%3D%22middle%22%20x%3D%22224.5%22%20y%3D%2238%22%3EF%3C%2Ftext%3E%3Ctext%20font-family%3D%22Times%20New%20Roman%22%20font-size%3D%2213%22%20font-style%3D%22italic%22%20text-anchor%3D%22middle%22%20x%3D%22234.5%22%20y%3D%2246%22%3En%3C%2Ftext%3E%3Ctext%20font-family%3D%22Times%20New%20Roman%22%20font-size%3D%2213%22%20font-style%3D%22italic%22%20text-anchor%3D%22middle%22%20x%3D%22241.5%22%20y%3D%2246%22%3Ee%3C%2Ftext%3E%3Ctext%20font-family%3D%22Times%20New%20Roman%22%20font-size%3D%2213%22%20font-style%3D%22italic%22%20text-anchor%3D%22middle%22%20x%3D%22246.5%22%20y%3D%2246%22%3Et%3C%2Ftext%3E%3C%2Fsvg%3E)
Determining force from a momentum-time graph
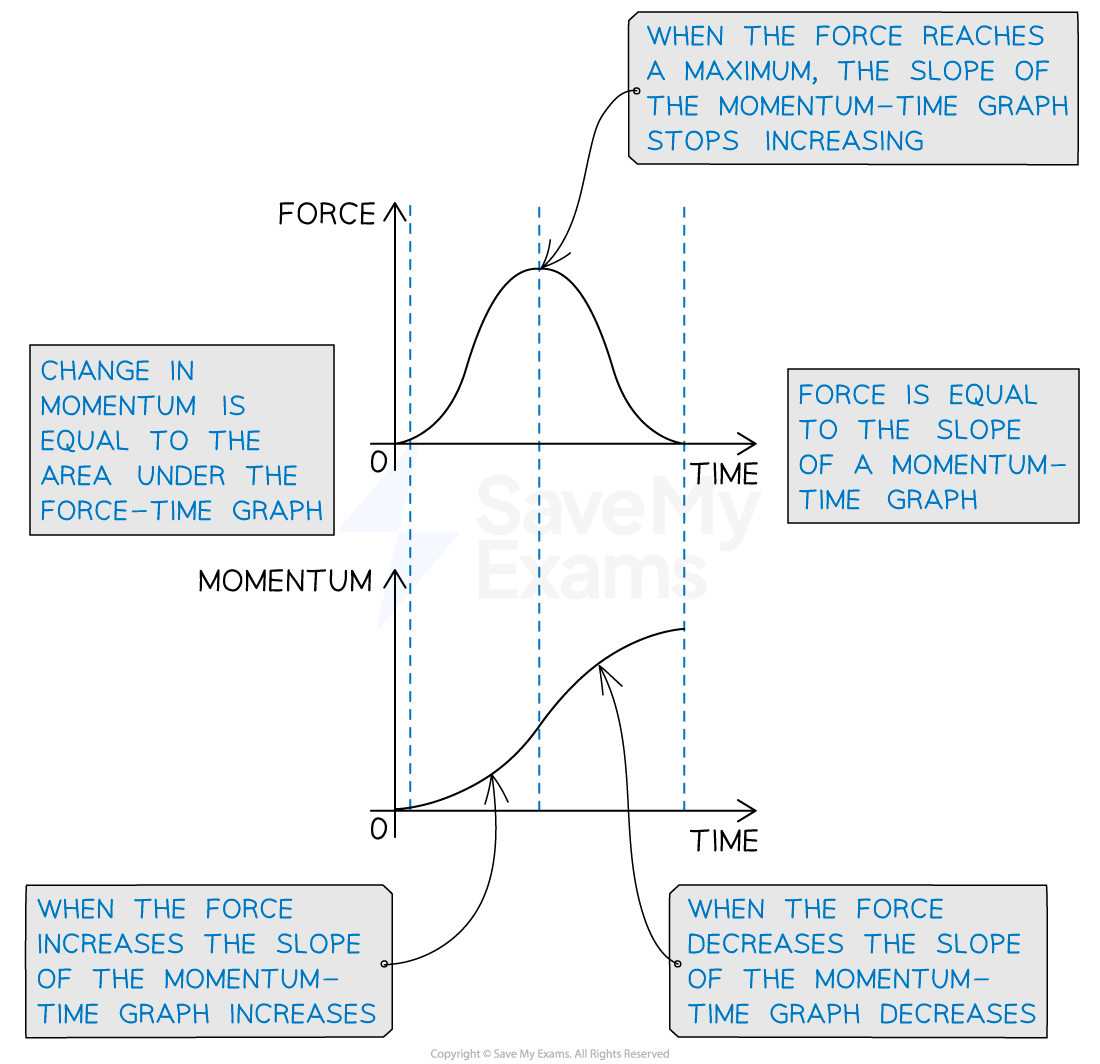
Translating between force and momentum graphs
A momentum-time graph can be plotted from a force-time graph by
splitting the force-time graph up into sections
calculating the area (impulse, or change in momentum) of each section
plotting the values of momentum in each time interval
A force-time graph can be plotted from a momentum-time graph by
splitting the momentum-time graph up into sections
calculating the slope (force) of each section
plotting the values of force in each time interval
Relationship between a force-time graph and a momentum-time graph
Examiner Tips and Tricks
Being able to find the area under a curve, or the slope of a line, and then relating them to physical quantities is an extremely important skill in physics. A more advanced skill is then being able to translate between graphs of related quantities.
Since ![]() and
and ![]() , force and momentum graphs can be translated in the same way as acceleration and velocity graphs. For example, acceleration is equal to the slope of a velocity-time graph
, force and momentum graphs can be translated in the same way as acceleration and velocity graphs. For example, acceleration is equal to the slope of a velocity-time graph
momentum-time graph slope = force | force-time graph area = impulse |
velocity-time graph slope = acceleration | acceleration-time graph area = velocity |

Unlock more, it's free!
Join the 100,000+ Students that ❤️ Save My Exams
the (exam) results speak for themselves:

Was this revision note helpful?
