Motion Graphs (College Board AP® Physics 1: Algebra-Based): Revision Note

Motion graphs
Graphs of position, velocity and acceleration as functions of time can be used to find the relationships between those quantities
When interpreting motion graphs, it is important to understand what information the graph shows
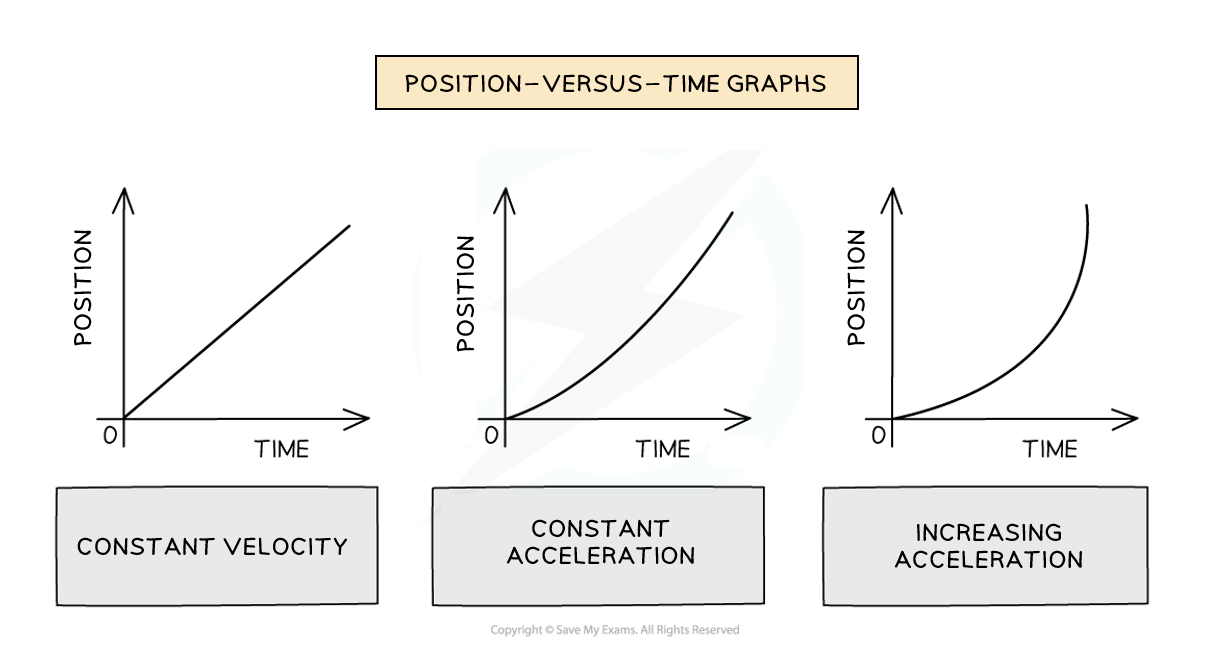
Position-versus-time graphs
Position-versus-time graphs are used to show the change in position or displacement of an object over time
On a position-versus-time graph:
Slope equals instantaneous velocity
The y-intercept equals the initial position
A constant gradient (slope) represents a constant velocity
A curved line represents an acceleration
A positive slope represents motion in the positive direction
A negative slope represents motion in the negative direction
A zero slope (horizontal line) represents a state of rest
The area under the curve means nothing
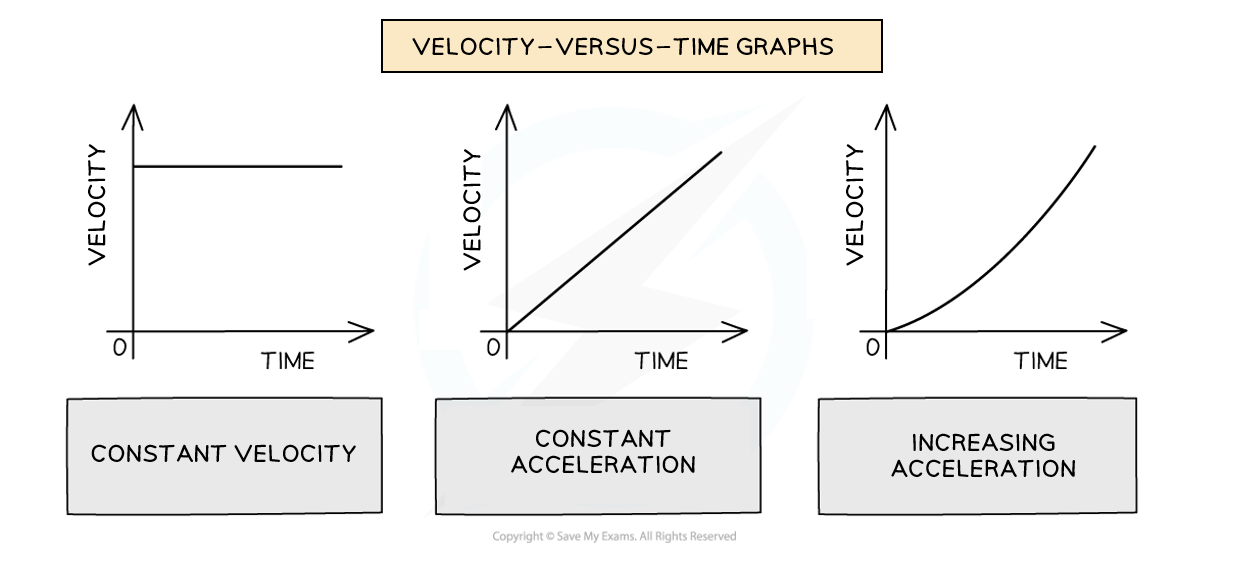
Velocity-versus-time graphs
Velocity-versus-time graphs are used to show the change in velocity of an object over time
On a velocity-versus-time graph:
Slope equals acceleration
The y-intercept equals the initial velocity
A straight slope represents uniform acceleration
A curve represents non-uniform acceleration
A positive slope represents acceleration in the positive direction
A negative slope represents acceleration in the negative direction
A zero slope (horizontal line) represents motion with constant velocity
The area under the curve is equal to the displacement
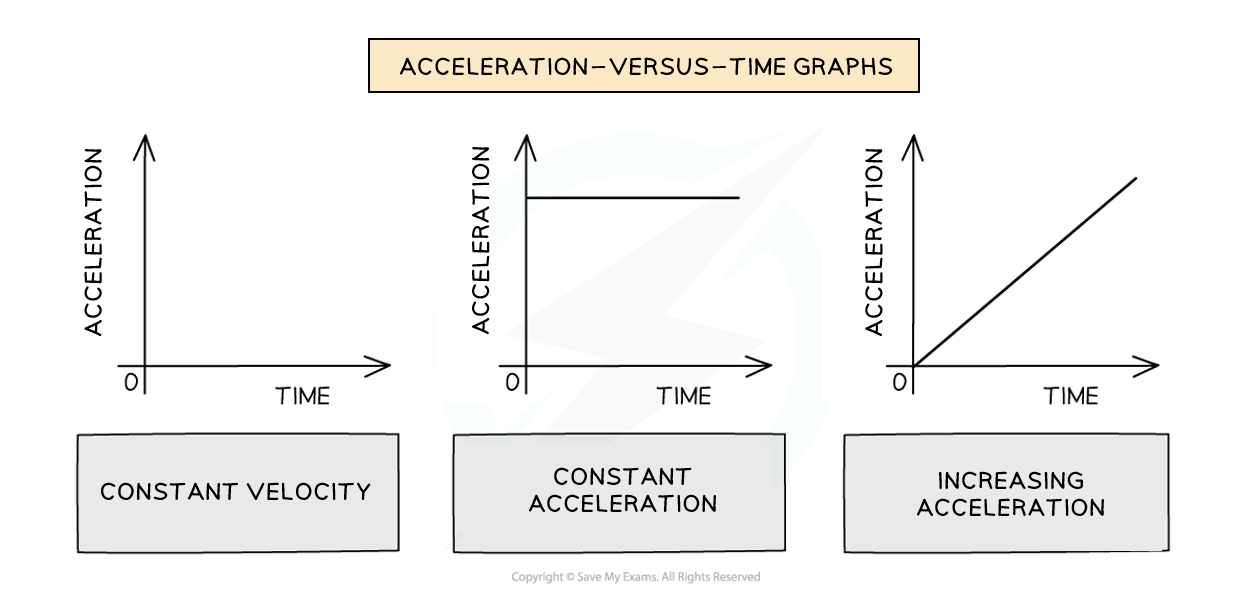
Acceleration-versus-time graphs
Acceleration-versus-time graphs are used to show the change in the acceleration of an object over time
On an acceleration-versus-time graph:
Slope means nothing
The y-intercept equals the initial acceleration
A zero slope (horizontal line) represents constant acceleration
The area under the curve equals the change in velocity
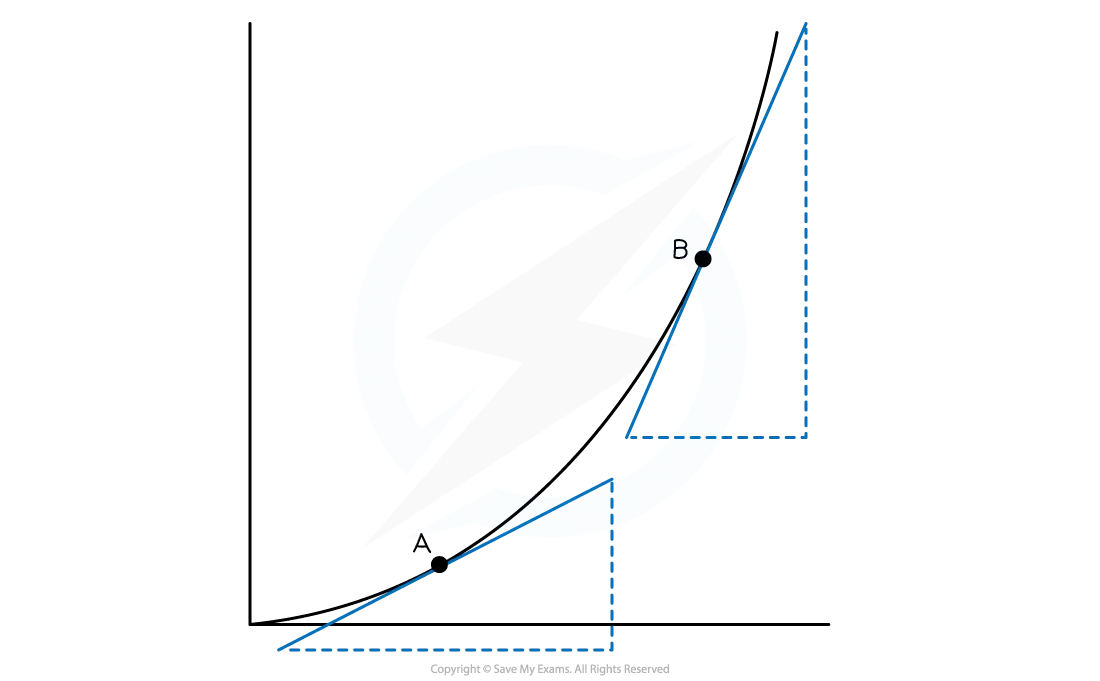
Calculating the slope of a motion graph
The slope of a straight line graph can be calculated using:
![]()

The slope of a curve can be determined by drawing a tangent to a specific point on the curve and calculating the gradient of the tangent
A tangent should be drawn using a sharpened pencil and ruler for maximum accuracy
The slope of the tangent should be equal to the slope of the curve at that specific point
Worked Example
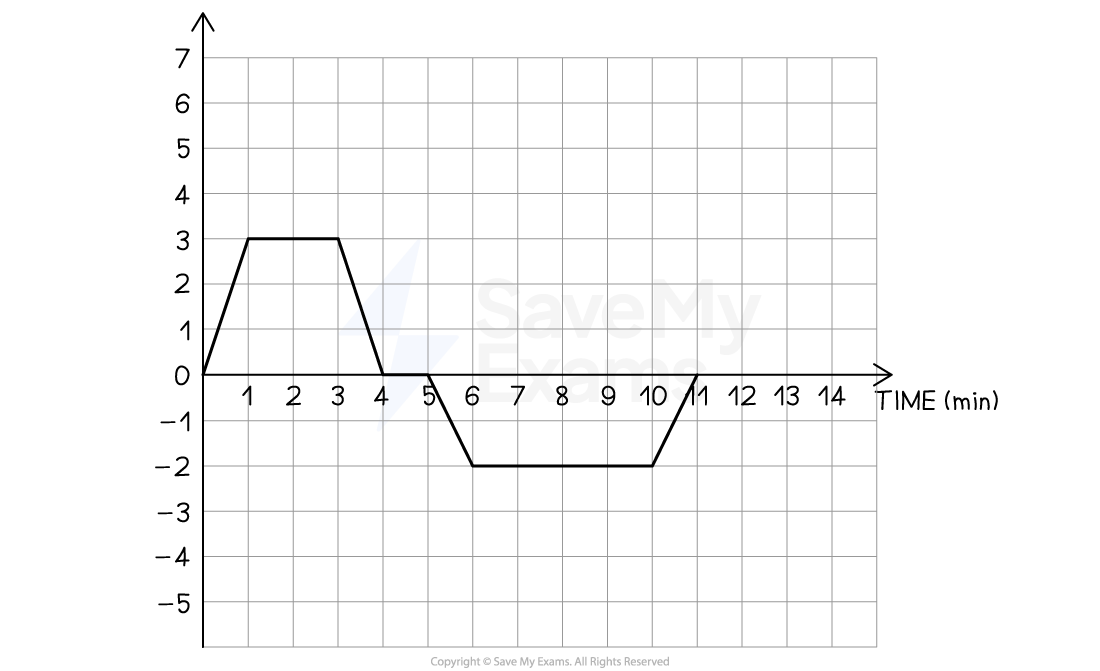
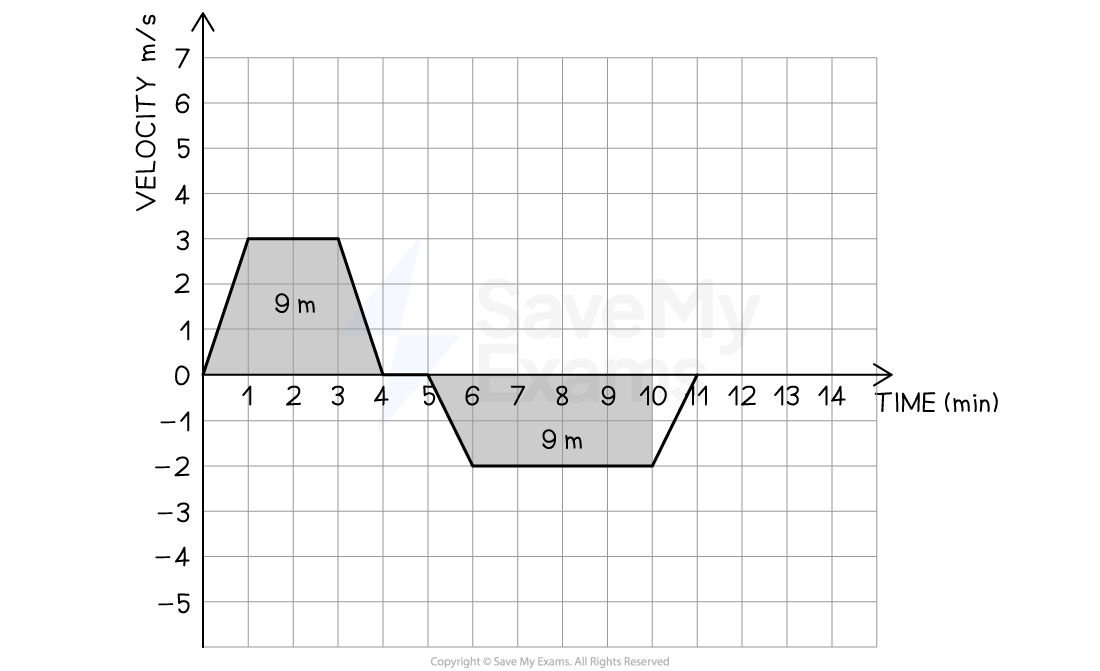
The above graph is a motion graph, which shows the motion of a taxicab. The driver initially turns on to a street at ![]() and drives down the straight road, accelerating to a constant velocity. The driver then slows down, briefly stops, and then reverses some distance at a constant velocity back down the street.
and drives down the straight road, accelerating to a constant velocity. The driver then slows down, briefly stops, and then reverses some distance at a constant velocity back down the street.
(a) State the type of motion graph shown and justify your answer.
(b) Determine the displacement of the taxicab for the period shown in the graph and suggest a suitable unit.
(c) Sketch the other two types of motion graph for the taxicab's movements.
(d) At what time does the taxicab have the same position as when ![]() ?
?
Answer:
Part (a) State the type of motion graph shown and justify your answer
Step 1: Analyze the motion shown in the graph along with the narrative description
Over the first 5 minutes, the graph shows the
 quantity increasing, then remaining constant, then decreasing to zero
This is consistent with a period of acceleration, followed by constant velocity, deceleration and a period of rest on a velocity-versus-time graph
This also matches the narrative description
Over the next 6 minutes, the graph shows the
quantity increasing in the negative direction, then remaining constant, then decreasing to zeroThis is consistent with a period of acceleration in the negative direction, followed by constant velocity in the negative direction, and deceleration to zero on a velocity-versus-time graph
This also matches the narrative description
Step 2: State the type of motion graph
The graph is a velocity-versus-time graph
Step 3: Present evidence to justify your answer
The taxicab accelerates to a constant velocity
0 - 1 min shows acceleration
1 - 3 mins shows constant velocity
The taxicab slows to a stop
3 - 4 mins shows a deceleration
4 - 5 mins shows zero velocity
The taxicab reverses
5 - 6 mins shows acceleration in the negative direction
6 - 10 mins shows constant velocity in the negative direction
Part (b) Determine the displacement of the taxicab for the period shown in the graph and suggest a suitable unit
Calculate the area under the velocity-versus-time graph and give a suitable unit
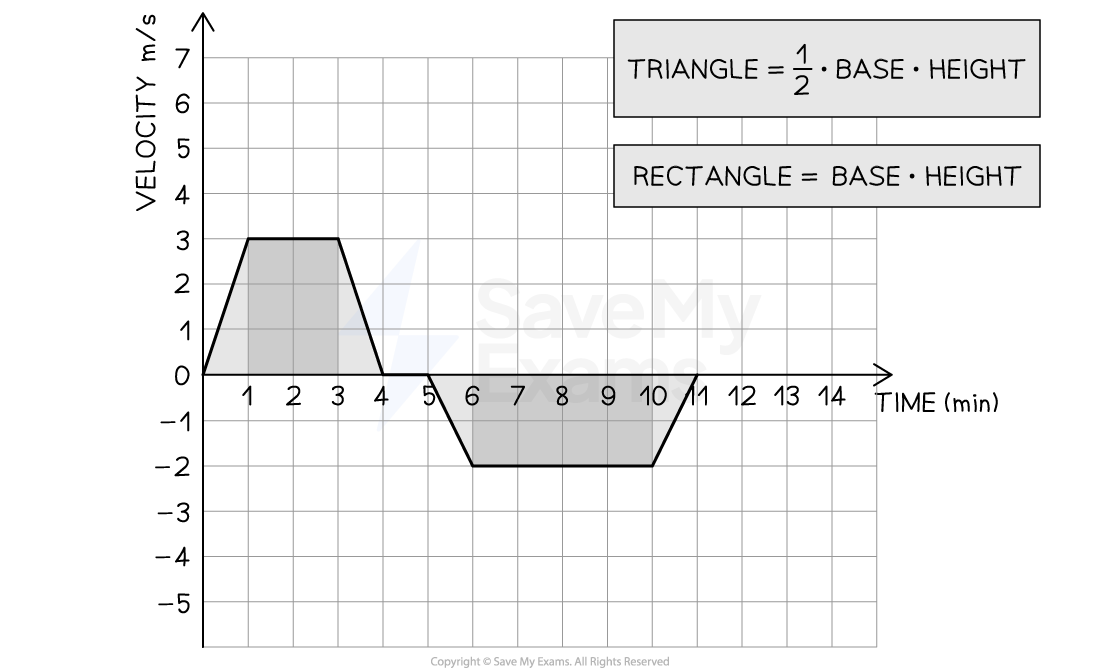
![]()
![]()
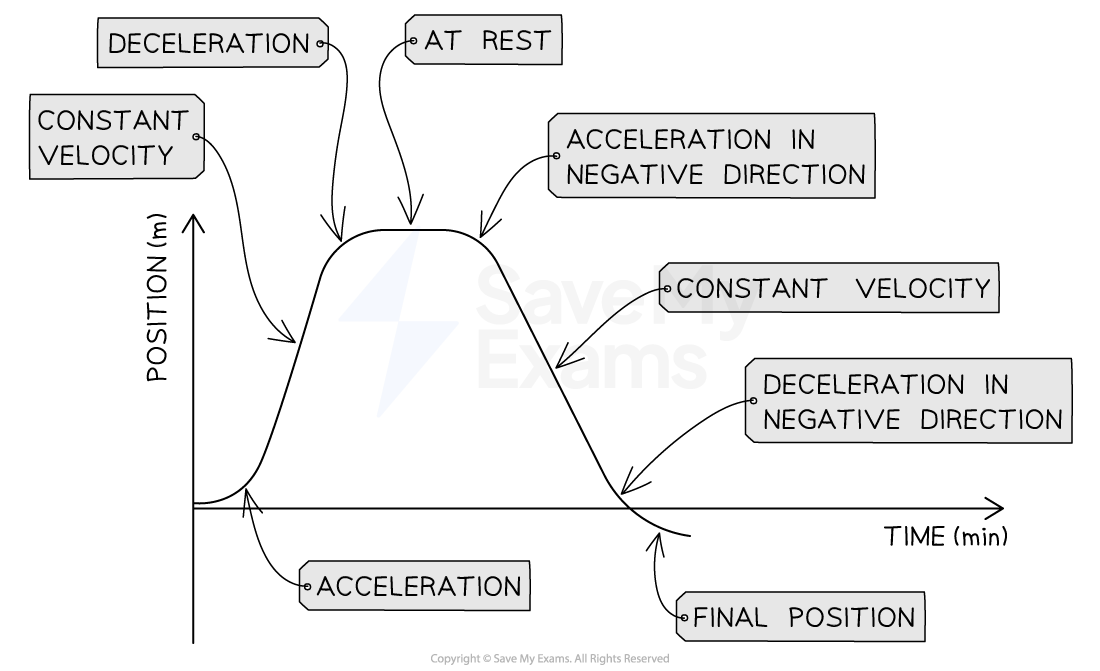
Part (c) Sketch the other two types of motion graph for the taxicab's movements
Step 1: Sketch the displacement-versus-time graph for the taxicab
Include all the changes in motion detailed on the velocity-versus-time graph
Keep the magnitudes proportional and the time roughly to scale
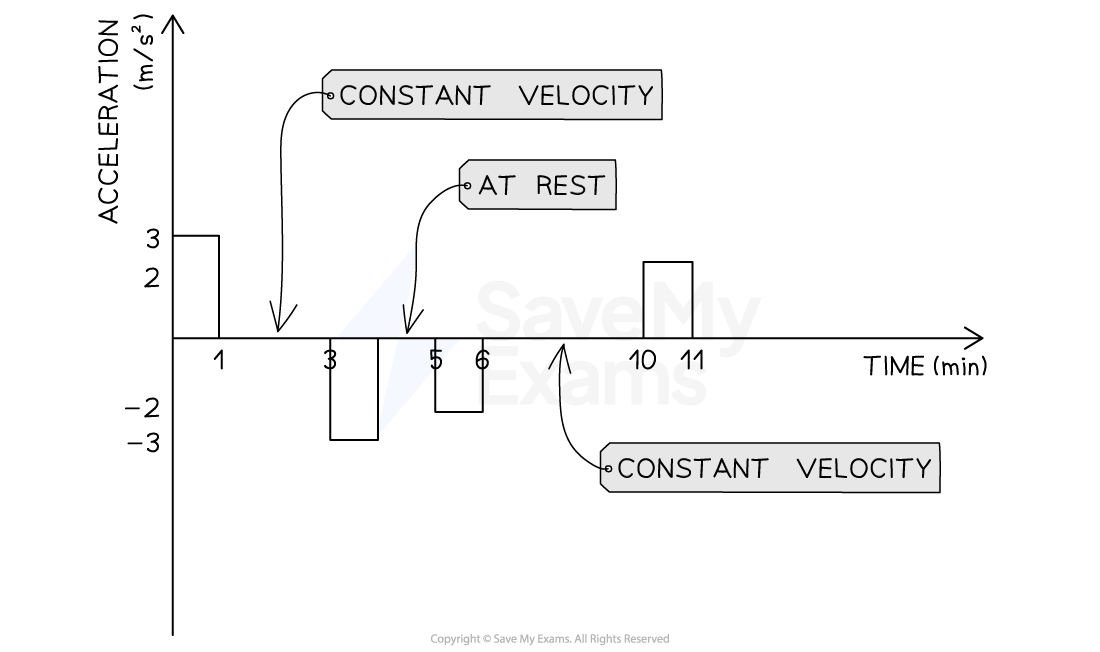
Step 2: Sketch the acceleration-versus-time graph for the taxicab
Include all the changes in motion detailed on the velocity-versus-time graph
Keep the magnitudes proportional and the time roughly to scale
Part (d) At what time does the taxicab have the same position as when ![]() ?
?
Step 1: Determine the displacement of the taxicab in the positive direction
![]()
Step 2: Determine the time at which the taxicab reaches an equal displacement in the negative direction
![]()
The time at which the taxicab has equal displacements in the positive and negative directions occurs at

This is when the taxicab passes its starting position
Examiner Tips and Tricks
When you are asked to justify your answer, you do not need to write in full sentences and paragraphs. Using bullet points is fine and will save you some time in the exam. The examiner will award marks for your reasoning in whatever form this is presented, as long as your logic is clearly expressed.
When asked to sketch a graph, you only need to draw the shape and label the axes. You do not need to annotate them or add specific values.

Unlock more, it's free!
Join the 100,000+ Students that ❤️ Save My Exams
the (exam) results speak for themselves:

Was this revision note helpful?
