Angular Impulse Graphs (College Board AP® Physics 1: Algebra-Based): Study Guide
Torque-time graph
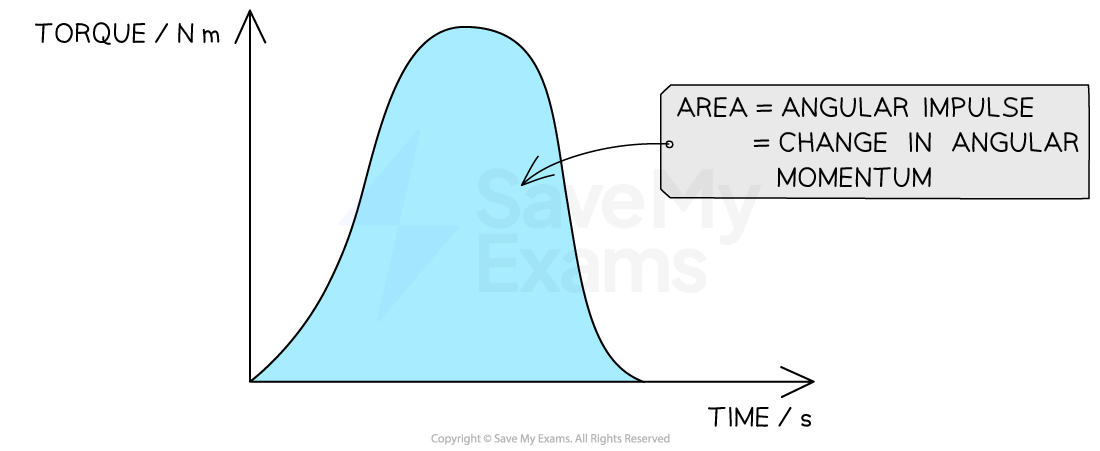
A changing torque can be plotted as a function of time
The angular impulse delivered to an object or rigid system is equal to the product of torque and time
Therefore, the area under the torque-time graph is equal to
angular impulse
change in angular momentum
Determining angular impulse from a torque-time graph

Worked Example
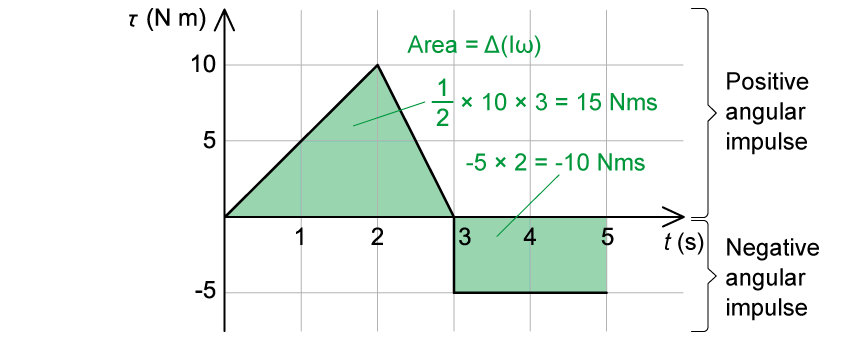
The graph shown represents the torque exerted on an object as a function of time over a 5-second interval.

The object has a rotational inertia of 5.0 kg·m2. At = 0 s, the object has an angular velocity of −2.0 rad/s.
Determine the angular velocity of the object at = 5 s.
Answer:
Step 1: Analyze the scenario
From
= 0 to
= 2 s, the torque increases to a maximum of 10 N·m, and then, from
= 2 s to
= 3 s, the torque decreases back to 0 N·m
At
= 3 s, the direction of the applied torque changes
From
= 3 to
= 5 s, the torque remains at a value of −5 N·m
Overall, the angular impulse delivered to the object:
between
= 0 to
= 3 s is positive, so the angular velocity will increase
between
= 3 to
= 5 s is negative, so the angular velocity will decrease
Step 2: Determine the change in angular momentum over the 5 s interval
The area under a torque-time graph is equal to angular impulse, or the change in angular momentum

Area under the positive curve (triangle) =
Area under the negative curve (rectangle) =
Therefore, the angular impulse, or change in angular momentum is:
Step 3: Determine the final angular velocity of the object
The change in angular momentum is equal to
Where
= 5.0 kg·m2 and
= −2.0 rad/s.
Therefore, when
= 5 s, the angular velocity is:
Angular momentum-time graph
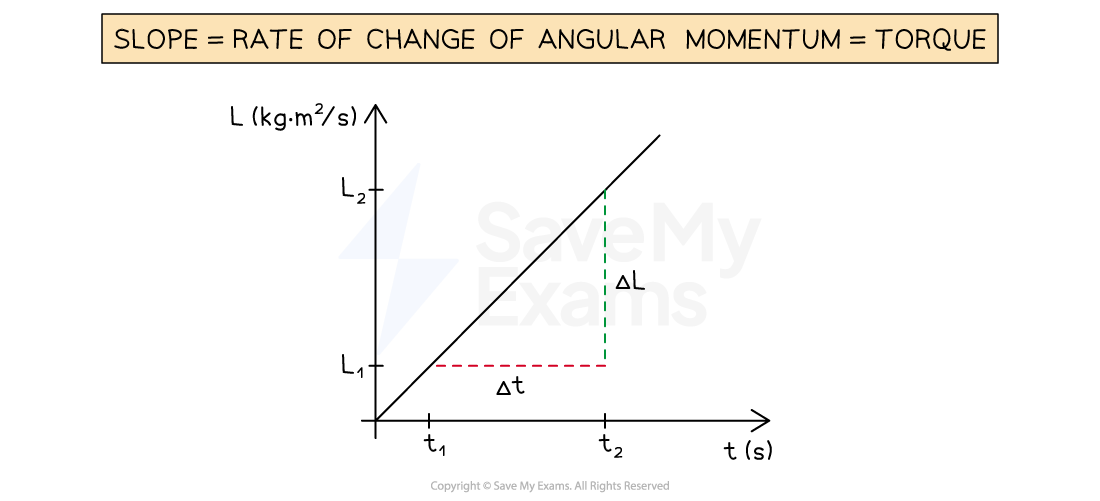
A changing angular momentum can be plotted as a function of time
The net torque exerted on a system is equal to the rate of change of angular momentum
Therefore, torque is equal to the slope of an angular momentum-time graph
Determining torque from an angular momentum-time graph

Worked Example
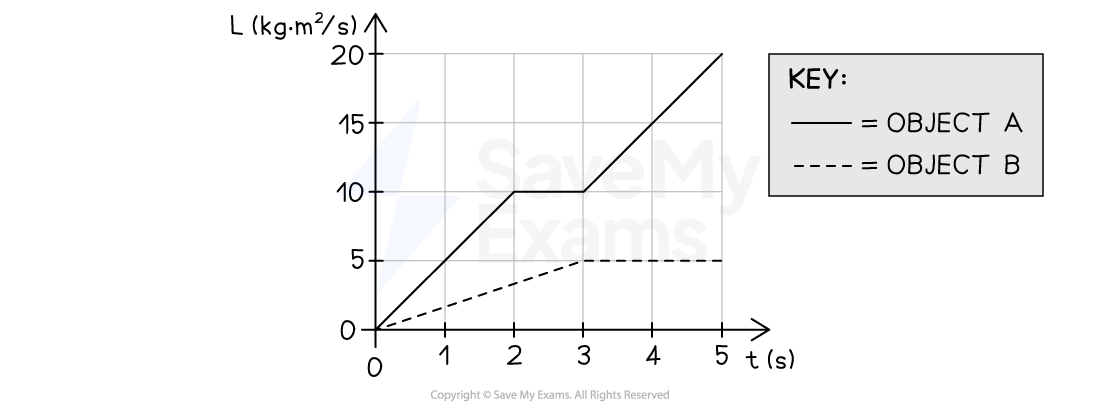
The graph shown represents the angular momentum of the two objects, A and B, as functions of time between time = 0 s and
= 5 s.
The average magnitudes of the net torques on objects A and B from = 0 s to
= 5 s are
and
, respectively.

Which of the following expressions correctly relates the magnitudes of the average torques?
A
B
C
D
The correct answer is D
Answer:
Step 1: Analyze the scenario
Object A and B experience a varying net external torque over the 5 second interval
The average magnitude of the net torque on each object is given by:
Where
is the change in angular momentum from
= 0 s to
= 5 s
Step 2: Determine the change in angular momentum for each object
Both A and B have
= 0 kg·m2/s at
= 0 s
For object A:
angular momentum:
= 20 kg·m2/s at
= 5 s
change in angular momentum:
= 20 kg·m2/s
For object B:
angular momentum:
= 5 kg·m2/s at
= 5 s
change in angular momentum:
= 5 kg·m2/s
Step 3: Determine the average torque on each object
The average torque on object A is:
The average torque on object B is
Step 4: Determine the ratio of the average torques
The ratio of the average torque on object B to object A is
Therefore, the correct option is D

Unlock more, it's free!
Did this page help you?