Accumulation of Change (College Board AP® Calculus BC): Study Guide
Accumulation of change
What is an accumulation of change?
If you know the rate of change of a quantity,
then an accumulation of change is the actual change that occurs to the quantity over a given interval
E.g. if a strawberry harvester gathers 0.5 kilograms of strawberries for each meter of strawberry plants (rate of change = 0.5 kilograms per meter)
then the accumulation of change over 6 meters is
kilograms of strawberries
Note that the accumulation of change does not tell you the total value for the quantity in question
It only tells you the amount that quantity changes by
E.g. after 6 meters we know that the amount of strawberries harvested has increased by 3 kilograms
But not the total amount of strawberries harvested so far
To find a total value for the quantity you need to know a boundary value
This is a value for the quantity at a particular point
E.g. if 23 kilograms of strawberries have been harvested so far
then after another 6 meters of harvesting
there will be a total of 23+6=29 kilograms of strawberries harvested
What is the connection between accumulation of change and graphs?
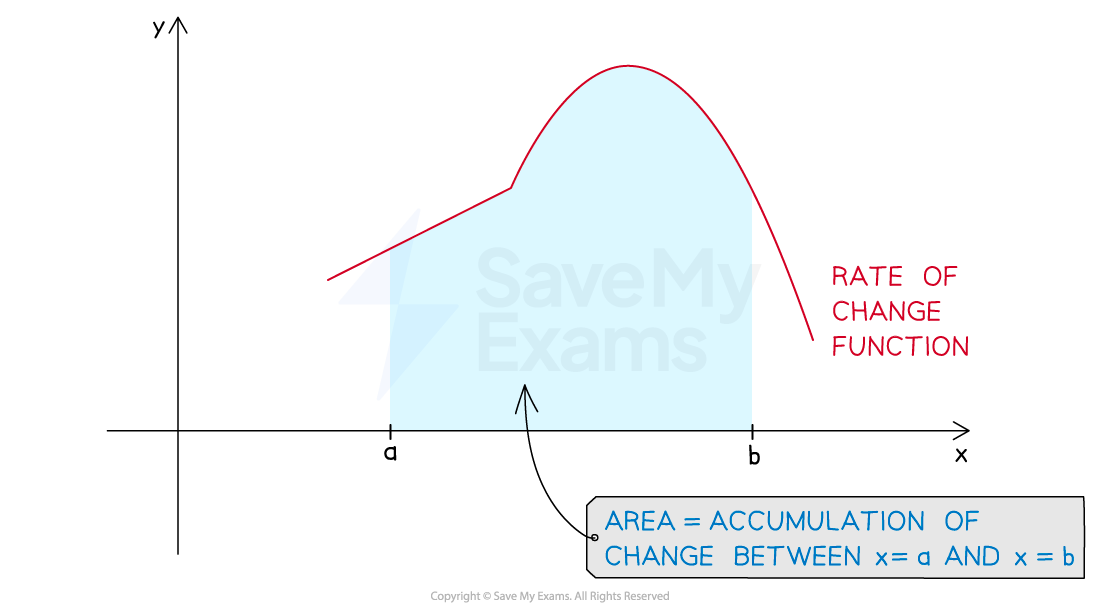
If you have a graph of the rate of change function for a quantity
then the area between the rate of change function and the x-axis over a given interval
is equal to the accumulation of change over that interval

There are different methods available to calculate such areas
Sometimes simple geometry can be used
Areas of rectangles, triangles, trapezoids, semicircles, etc.
See the Worked Example
A definite integral can also be used
This may be necessary if the area is not a simple geometric shape
E.g.
can be used to calculate the area between the x-axis and the graph of
between
and
See the 'Properties of Definite Integrals' study guide
How is the sign of the rate of change connected to the accumulation of change?
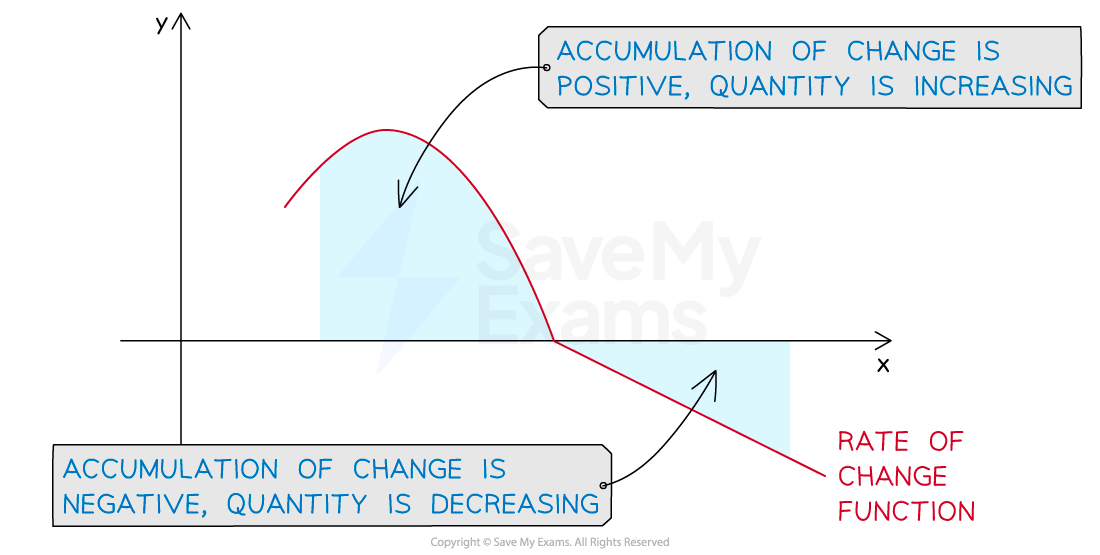
If the rate of change function is positive over a given interval, then :
the graph of the rate of change function will be above the x-axis
the accumulation of change over the interval will be positive
the quantity will be increasing over the interval
If the rate of change function is negative over a given interval, then :
the graph of the rate of change function will be below the x-axis
the accumulation of change over the interval will be negative
the quantity will be decreasing over the interval

What are the units for an accumulation of change?
The units for an accumulation of change will be equal to
the units of the rate of change function
times the units of the independent variable
For example
If the rate of change is in kilograms per meter, and the independent variable is in meters
Then the units of accumulation of change are
If the rate of change is in meters per second per second (i.e. meters per second squared), and the independent variable is in seconds
Then the units of accumulation of change are
Worked Example

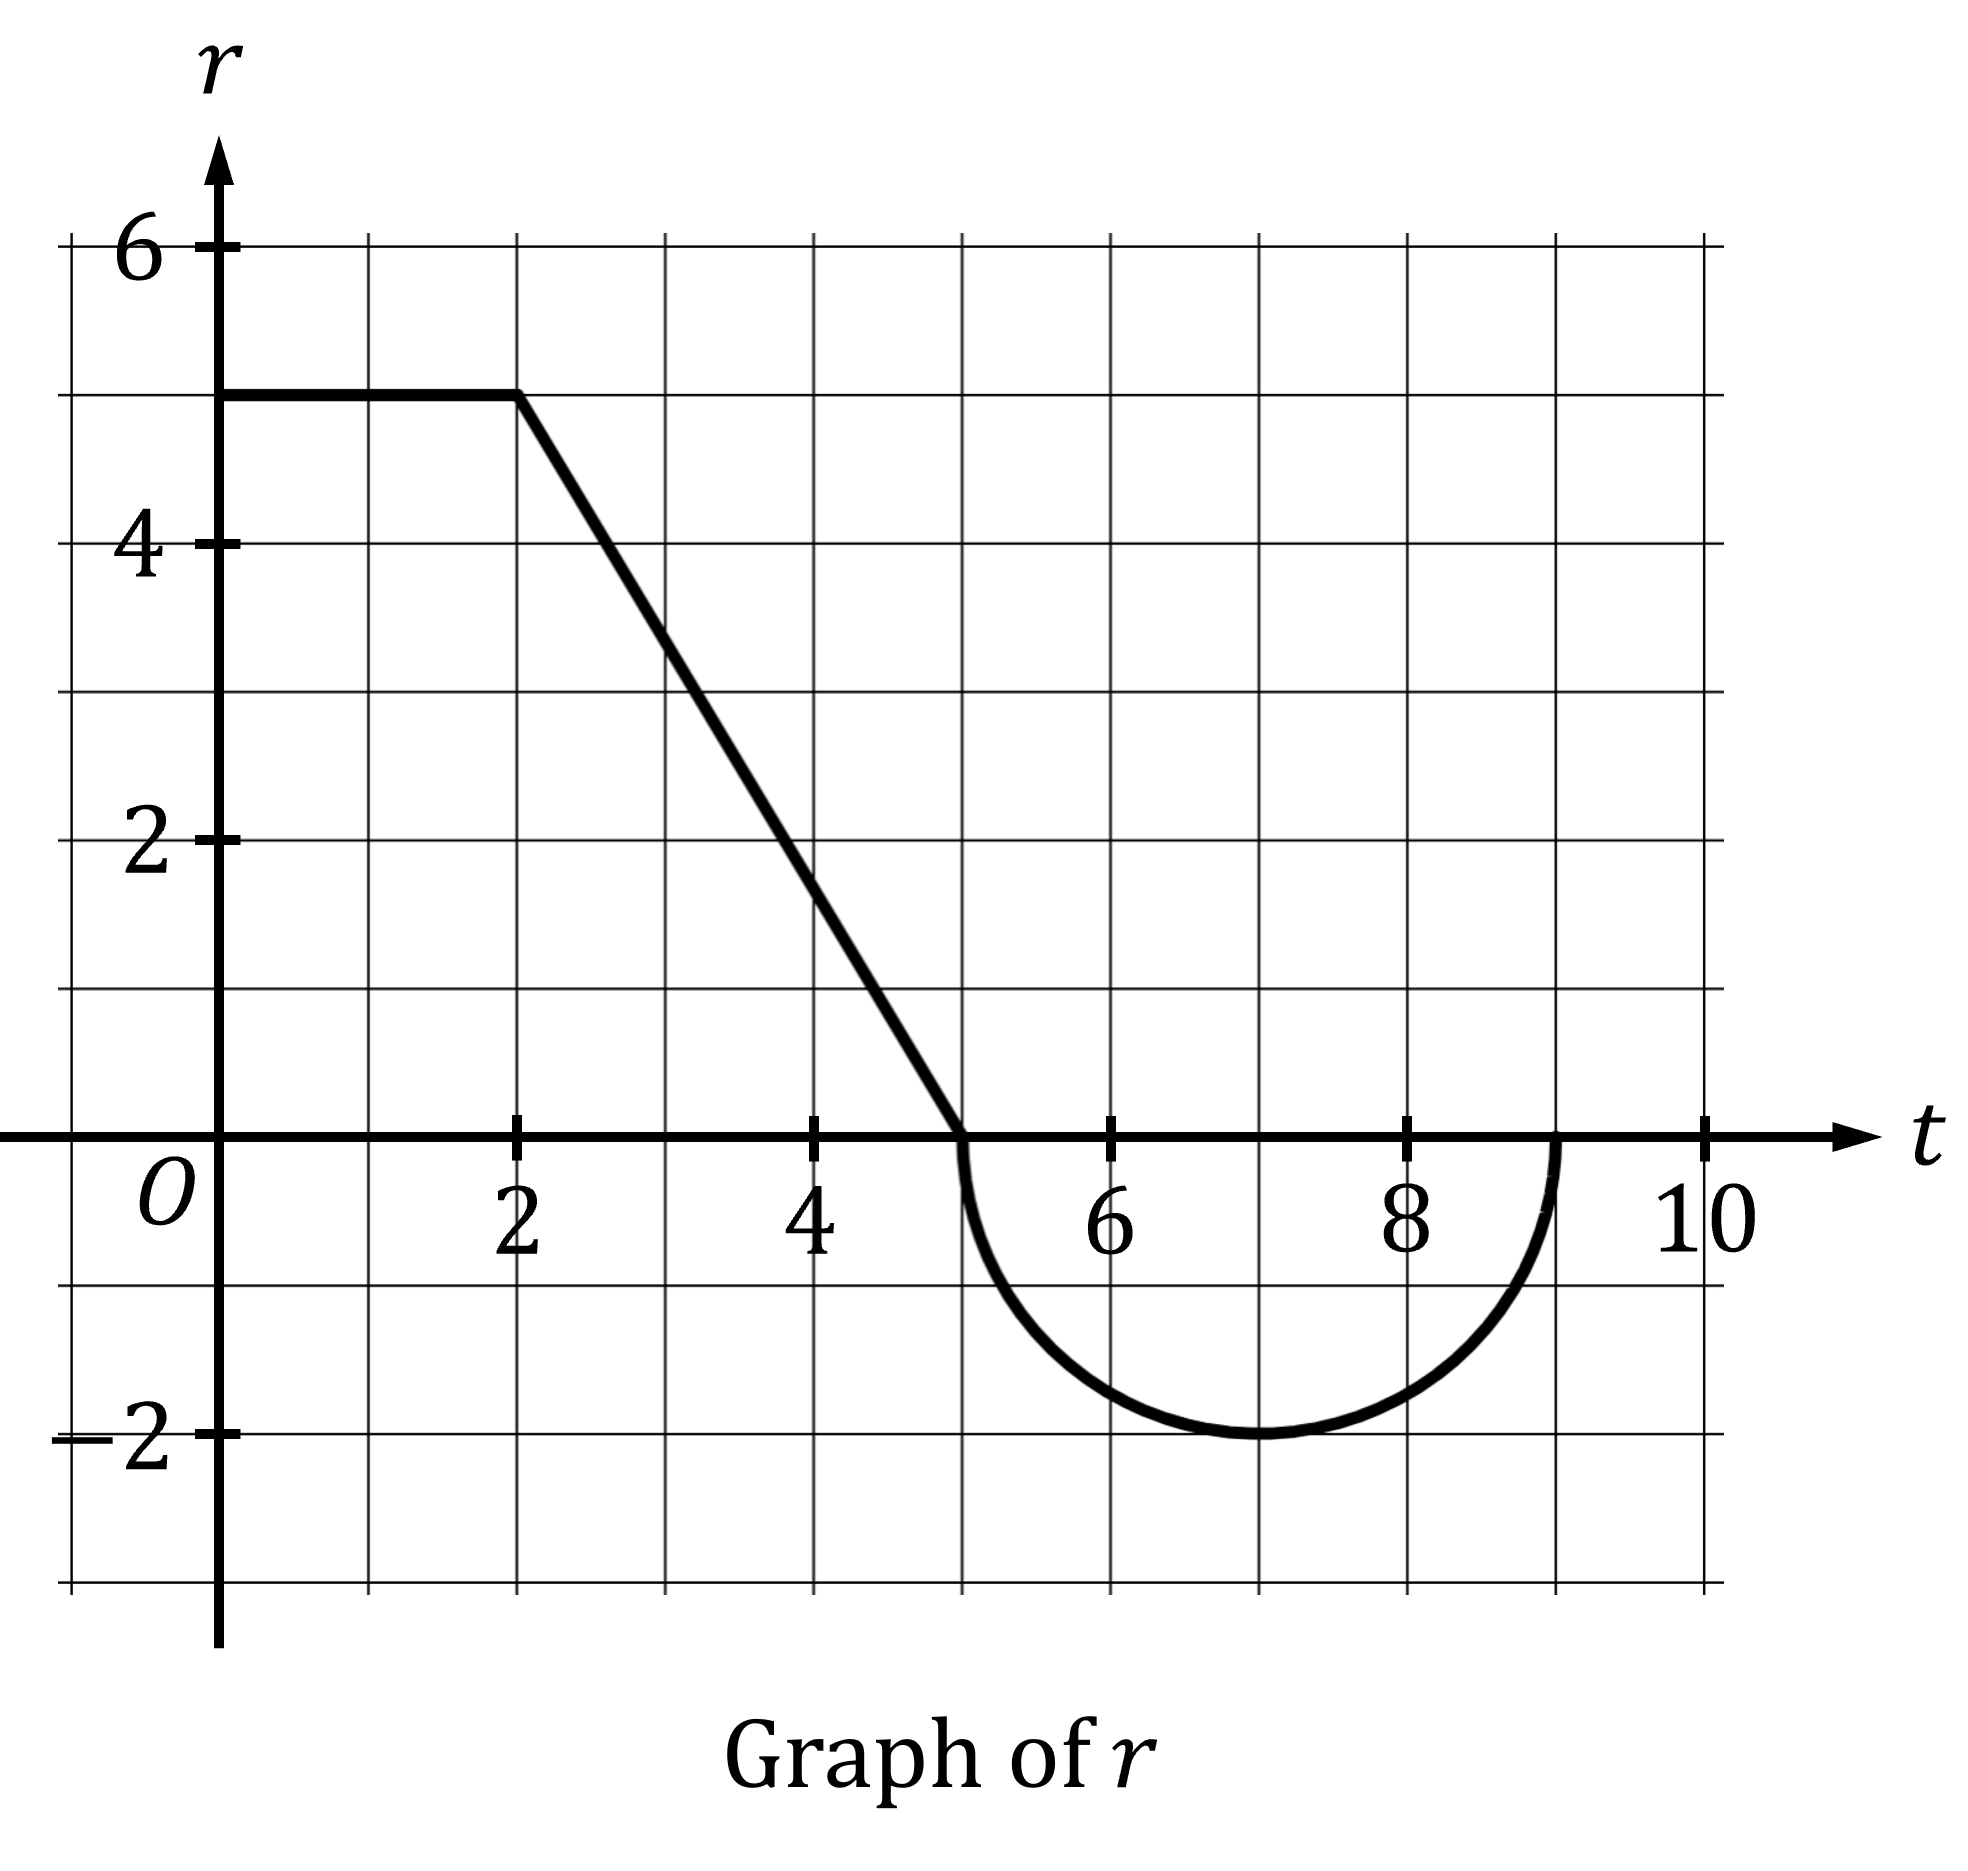
The function is defined on the closed interval
. The graph of
consists of two line segments and a semicircle as shown in the figure.
is used to model the rate of change of the volume of liquid in a tank, with
being measured in gallons per minute and time
being measured in minutes. Initially the tank contains 7 gallons of liquid.
(a) Calculate the accumulation of change between and
.
Answer:
This is equal to the area between the graph of and the
-axis
The area consists of a 5 by 2 rectangle, and a right triangle with base 3 and height 5
This has units of gallons
17.5 gallons
(b) Calculate the accumulation of change between and
.
Answer:
The size of the accumulation of change is equal to the area between the graph of and the
-axis
However for , the function
is negative, so the accumulation of change will also be negative
The area consists of a semicircle of radius 2
So the accumulation of change is -2π
This has units of gallons
-2π gallons
(c) What is the volume of liquid in the tank at ?
Answer:
This will be the initial volume of liquid in the tank, plus the total accumulation of change
18.217 gallons (3 decimal places)

Unlock more, it's free!
Did this page help you?