Increasing & Decreasing Functions (College Board AP® Calculus AB) : Study Guide
Increasing & decreasing functions
How do I find where a function is increasing and decreasing?
The first derivative of a function,
, describes the rate of change of
If the rate of change is positive, the function is increasing
If the rate of change is negative, the function is decreasing
This means you can determine if a function is increasing or decreasing at a point
If
then
is increasing at
If
then
is decreasing at
If
then there is a critical point at
You can also find an interval where a function is increasing or decreasing
To find where the function is increasing,
Solve the inequality
To find where the function is decreasing,
Solve the inequality
Examiner Tips and Tricks
The definitions for where a function is increasing or decreasing include the endpoints, however the scoring guidelines for exam questions often allow the point to still be awarded if the endpoints are not included.
I.e. " is increasing for
" would receive the same marks as "
is increasing for
"
Sketching a graph of both
and
can help to identify where a function will be increasing or decreasing
On the graph of
,
An upward slope from left to right is where the function is increasing
A downward slope from left to right is where the function is decreasing
On the graph of
,
The portion of the graph above the
-axis is where the function is increasing
The portion of the graph below the
-axis is where the function is decreasing
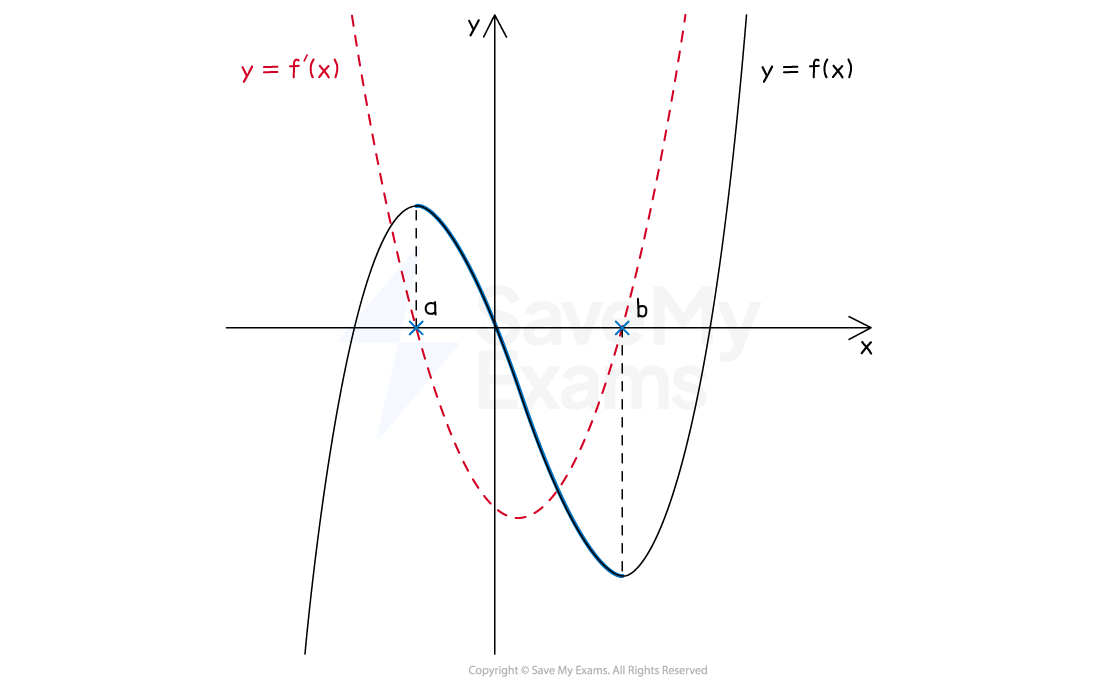
The diagram below shows a cubic and its derivative, a quadratic, plotted on the same graph
Between the critical points at
and
, the cubic is decreasing
Therefore the graph of the derivative is below the
-axis between
and

Worked Example
Find the interval(s) on which the graph of is decreasing.
Answer:
The function is decreasing where
Find
Solve the inequality
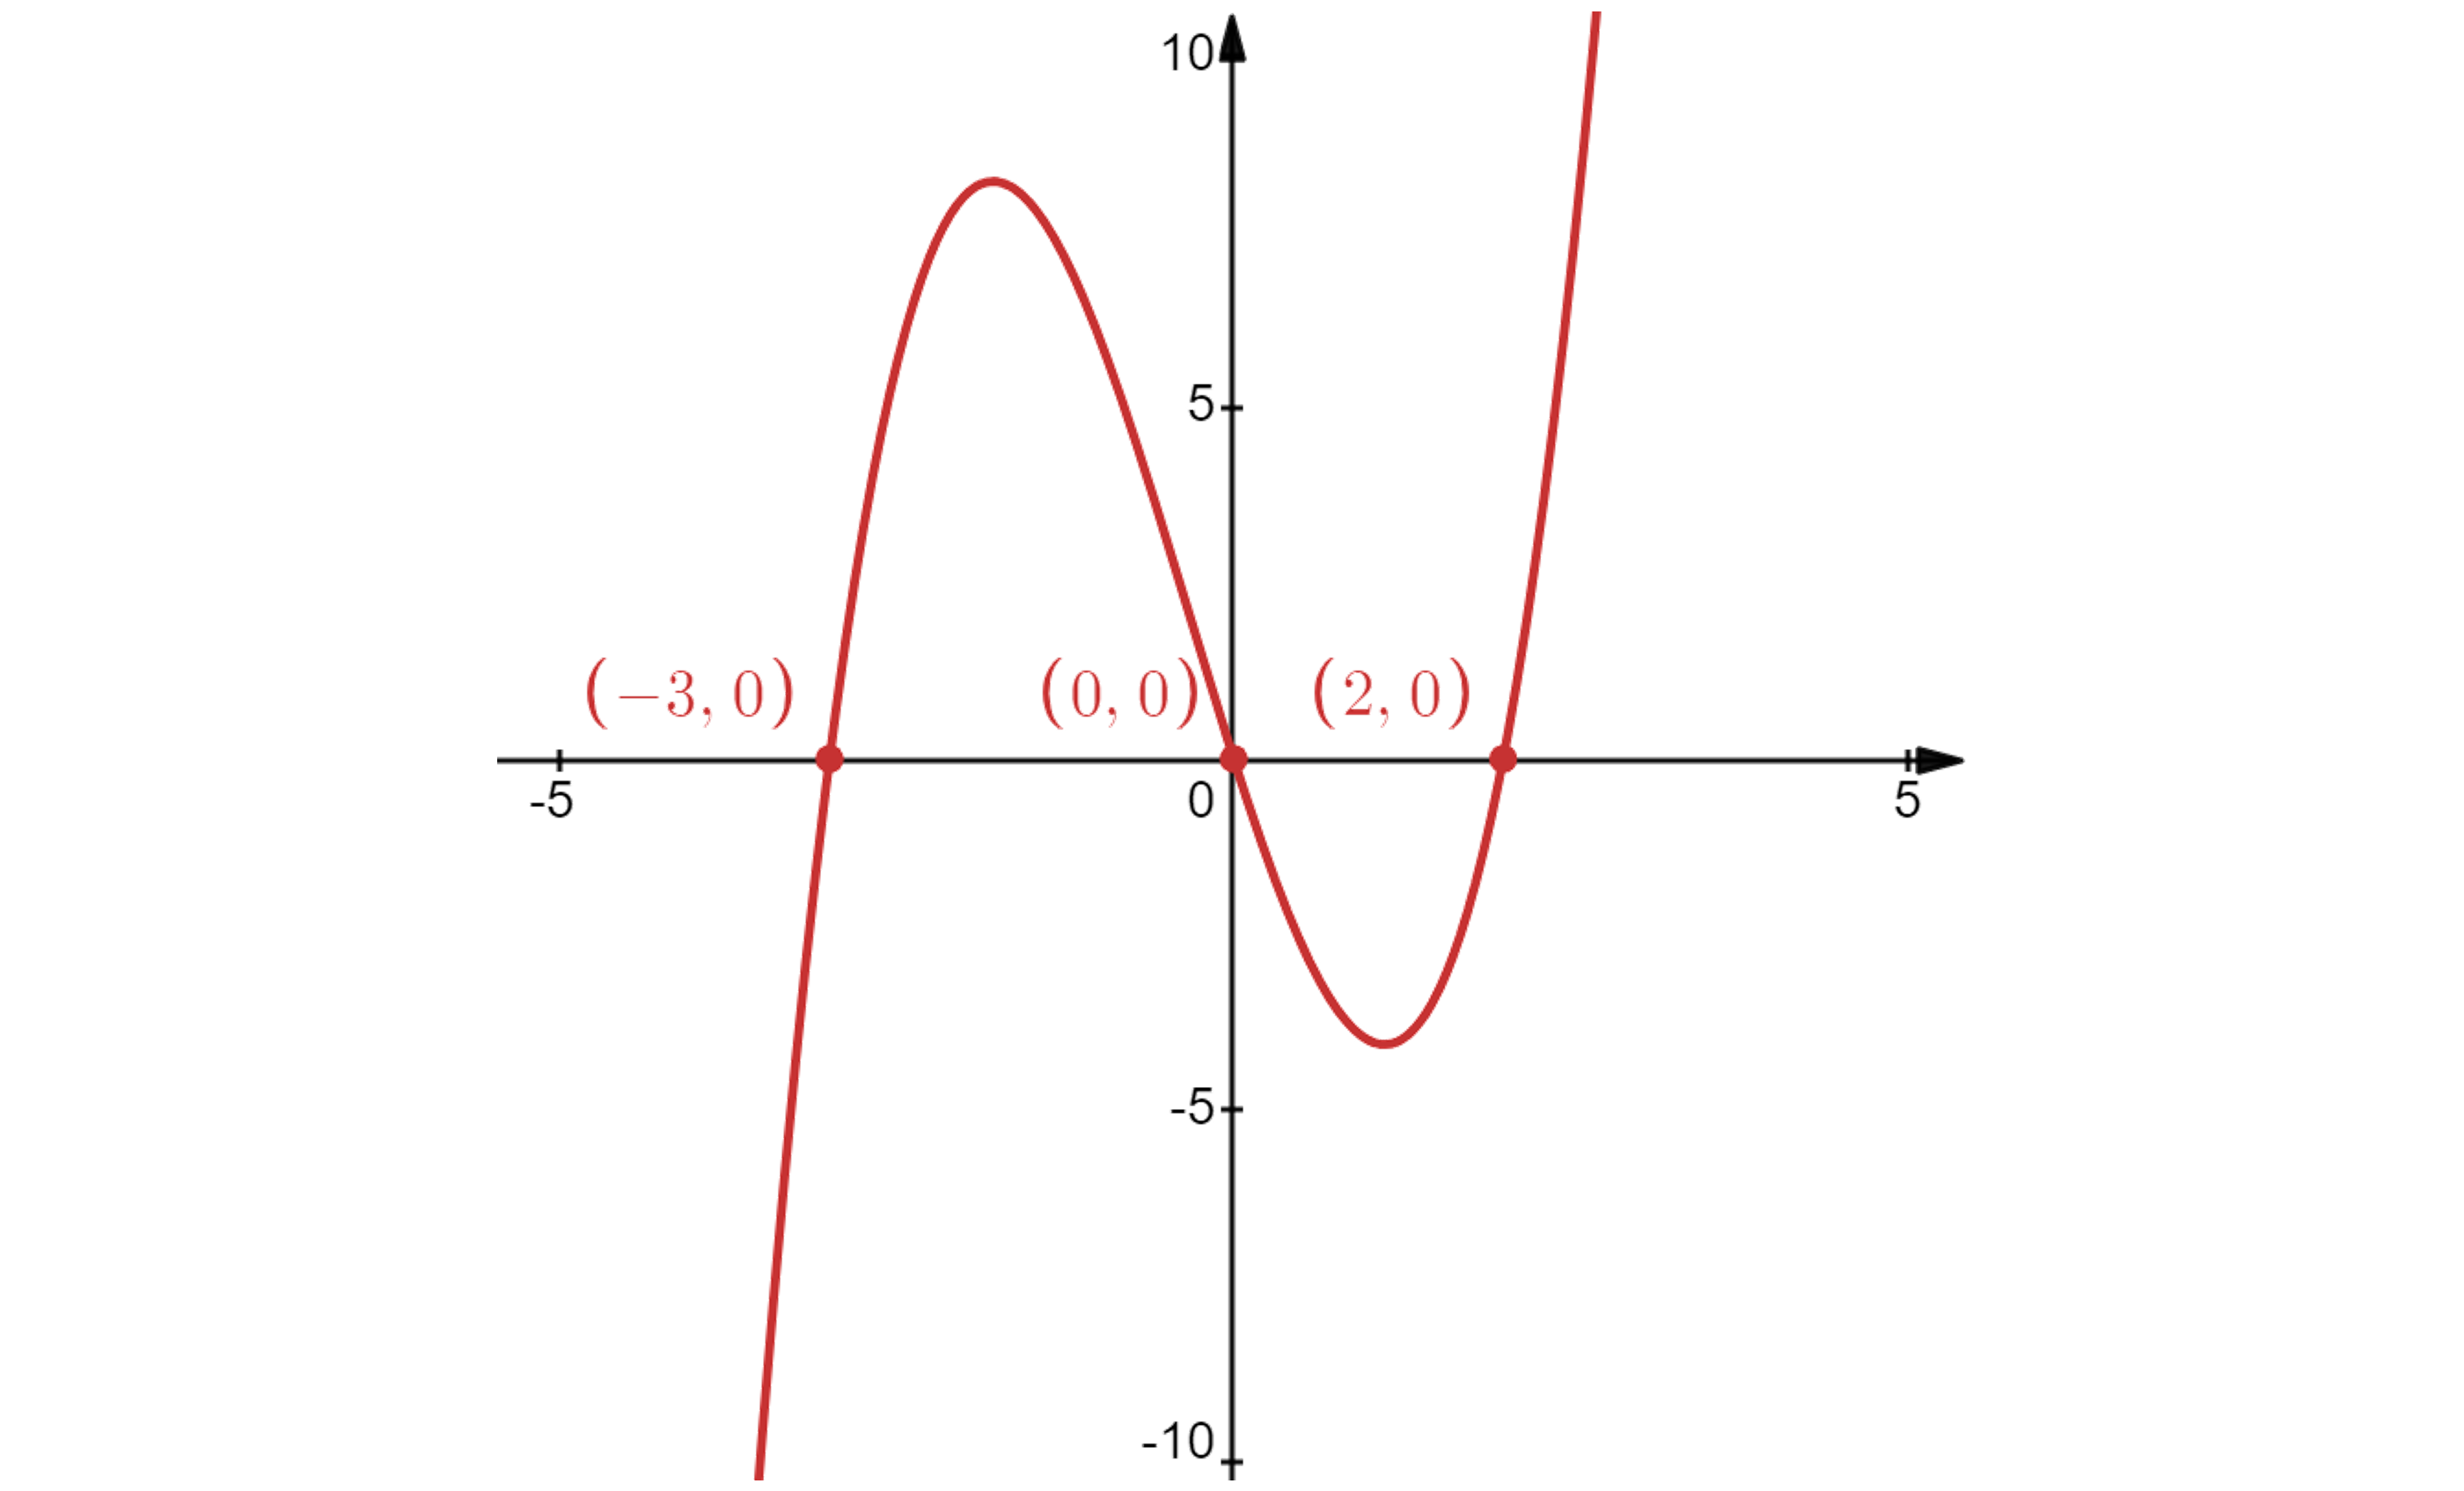
The easiest way to solve a cubic inequality is to graph it, you could use your calculator to help you

Use the graph to identify where (the parts underneath the
-axis)
and
So these are the regions where , therefore these are the regions where the graph of
is decreasing
The question asks for intervals, rather than values of
Decreasing on the intervals (∞, -3] and [0, 2]

You've read 0 of your 5 free study guides this week
Unlock more, it's free!
Did this page help you?

