11 mark
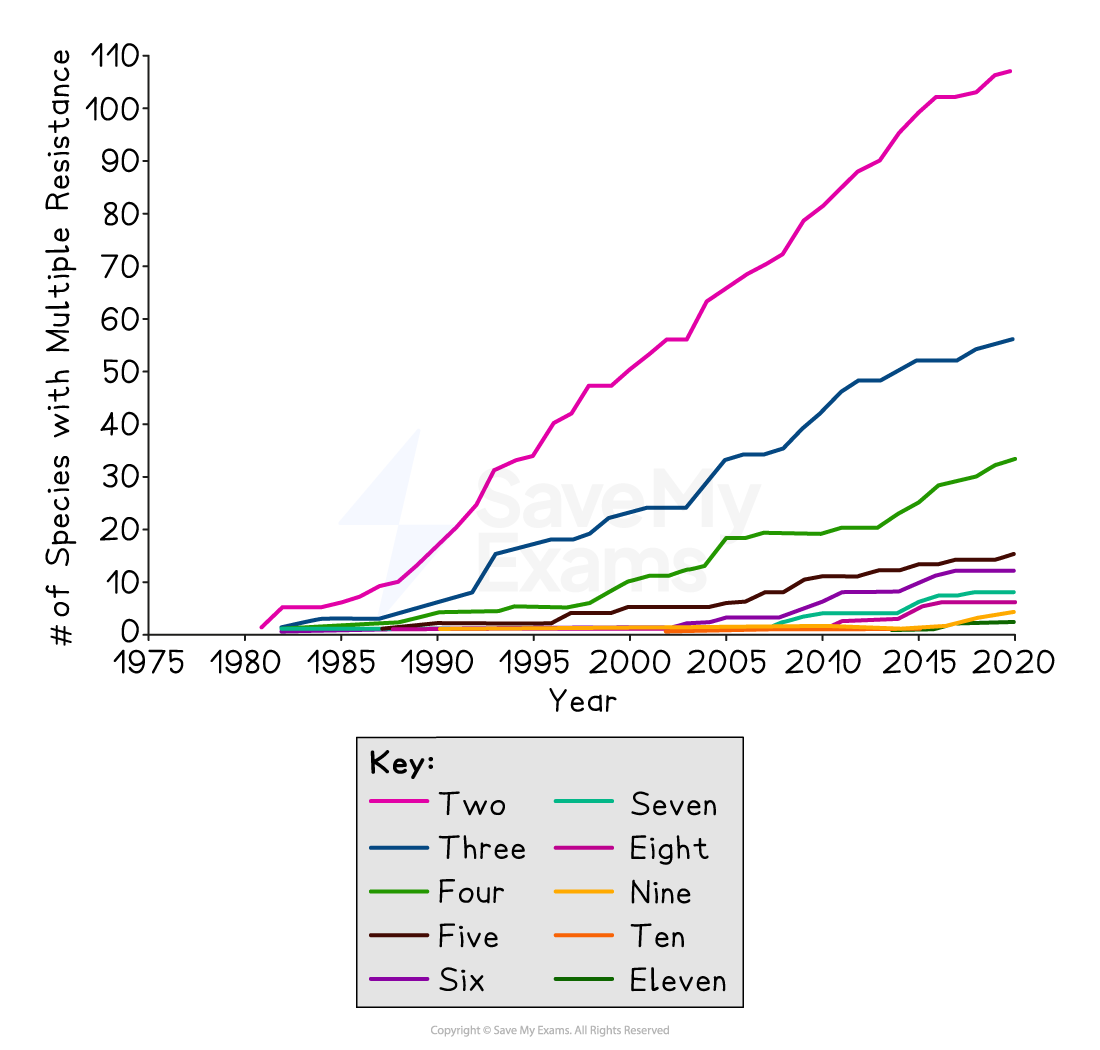
Which of the following is illustrated by the data below?

Genetically Modified Organisms (GMOs)
Salinization
Desertification
Pesticide treadmill
Did this page help you?
Which of the following is illustrated by the data below?
Genetically Modified Organisms (GMOs)
Salinization
Desertification
Pesticide treadmill
Did this page help you?
Which of the following is the best explanation for the trends displayed in the data?
Herbicides are being applied at below the recommended dosage.
There is cross pollination between different plants
The plants have been genetically modified
Some weeds survive and pass on beneficial traits to offspring.
Did this page help you?
Which of the following best illustrates the concept of the pesticide treadmill?
Farmers apply increasing amounts and varieties of pesticides as pests develop resistance over time.
Pesticides accumulate in the tissues of organisms, leading to higher concentrations up the food chain.
The use of pesticides leads to the immediate elimination of all pest species in an ecosystem.
Pesticides degrade quickly in the environment, requiring frequent reapplication.
Did this page help you?
Which of the following explains the farmer’s observation that over a 10-year period, each year requires a more concentrated application of pesticide to achieve the same level of crop yield?
The pesticide is degrading in the soil, reducing its effectiveness over time.
The pests have become resistant to the pesticide, requiring higher concentrations for control.
The pesticide is being washed away by rainfall, reducing its effectiveness.
The soil quality is decreasing, which affects the crops' ability to grow.
Did this page help you?