Manipulating Concentration-Time Graphs (College Board AP® Chemistry) : Study Guide
First Order Concentration-Time Graphs
As shown in the previous section, the concentration vs time graph for a first order reaction is not a straight line
However, line equations are easier to interpret because they have a constant slope
The rate equation for a first order reaction is shown below:
Rate = k[A]
Since the rate is the change in concentration of the reactant per unit of time, the rate equation can be transformed in:
Remember that the change from the reactant must have a negative sign
Using a mathematical operation called integration a new rate equation can be constructed
The name of this new equation is the integrated rate law for a first order reaction
ln [A]t – ln [A]0 = – kt
This equation links the concentration of A at any time (), with the initial concentration of A (), the rate constant (k), and the time (t)
It can be used to calculate the concentration of A at any time, just by replacing the time
The initial concentration of A and the rate constant are always the same and they, in some cases, given by the statement
If the new rate equation is rearranged, the following equation is obtained:
ln [A]t = – kt + ln [A]0
This new equation is equivalent to the equation of an straight line:
y = mx + c
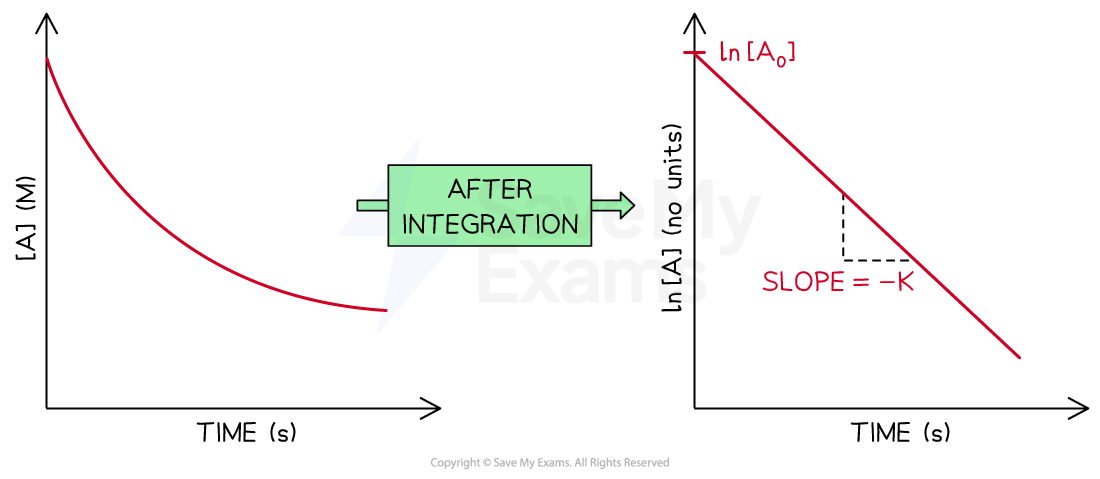
Comparing carefully both equations, if ln [A]t is plotted against t, an straight line going down is obtained
The slope of the straight line is -k
The y-intercept of the line is ln [A]0
The concentration-time graph and the integrated rate law graph for a first order reaction

Diagram showing the difference between a concentration-time graph and the graph after the integration to obtain the integrated rate law for a first order reaction. The elements of the integrated rate law graph are labeled
Second Order Concentration-Time Graphs
As shown in the previous section, the concentration vs time graph for a second order reaction is not a straight line
However, line equations are easier to interpret because they have a constant slope
The rate equation for a first order reaction is shown below:
Rate = k [A]2
Since the rate is the change in concentration of the reactant per unit of time, the rate equation can be transformed in:
Remember that the change from the reactant must have a negative sign
Using a mathematical operation called integration a new rate equation can be constructed
The name of this new equation is the integrated rate law for a second order reaction
This equation links the concentration of A at any time (), with the initial concentration of A (), the rate constant (k), and the time (t)
It can be used to calculate the concentration of A at any time, just by replacing the time
The initial concentration of A and the rate constant are always the same and they are, in some cases, given by the statement
If the new rate equation is rearranged, the following equation is obtained:
This new equation is equivalent to the equation of an straight line:
y = mx + c
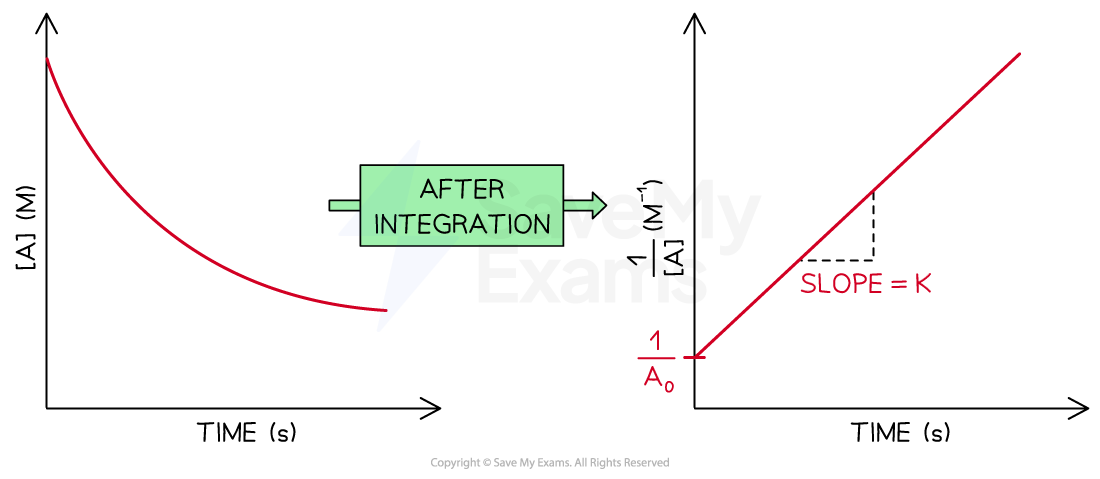
Comparing carefully both equations, if
is plotted against t, an straight line going up is obtained
The slope of the straight line is k
The y-intercept of the line is
The concentration-time graph and the integrated rate law graph for a second order reaction

Diagram showing the difference between a concentration-time graph and the graph after the integration to obtain the integrated rate law for a second order reaction. The elements of the integrated rate law graph are labeled
Examiner Tips and Tricks
The integrated rate law for first order and second order reactions is displayed in the Equations and Constants section at the beginning of your AP Chemistry Examination

You've read 0 of your 5 free study guides this week
Unlock more, it's free!
Did this page help you?

