Concentration-Time Graphs & Rate Constants (College Board AP® Chemistry): Study Guide
Concentration-Time Graphs & Rate Constants
Line equations for the Concentration-Time Graphs
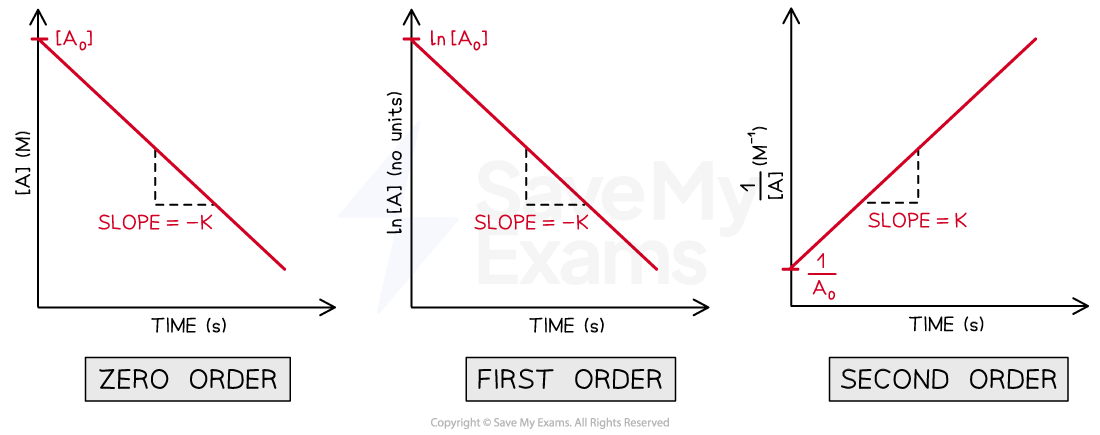
Zero order concentration-time graph is a straight line
The equation for this line is:
This equation links the concentration of A at any time (), with the initial concentration of A (), the rate constant (k), and the time (t)
It can be used to calculate the concentration of A at any time, just by replacing the time
If the line equation is rearranged, the following equation is obtained:
Looking carefully into the equation, if [A]t is plotted against t, an straight line going down is obtained
The slope of the straight line is -k
The y-intercept of the line is [A]0
An straight line can be drawn for a first order reaction by using the integrated law for a first order reaction
The equation for the integrated law is shown below in two equivalent ways:
ln [A]t - ln [A]0 = -kt
ln [A]t = -kt +ln [A]0
An straight line can be drawn for a second order reaction by using the integrated law for a second order reaction
The equation for the integrated law is shown below in two equivalent ways:
Line equations for zero order, first order and second order reactions

Comparison of the axis labels, slopes and y-intercepts between the line equations for a zero order, first order and second order reaction
Worked Example
A student carried the following reaction at the laboratory:
A+B → products
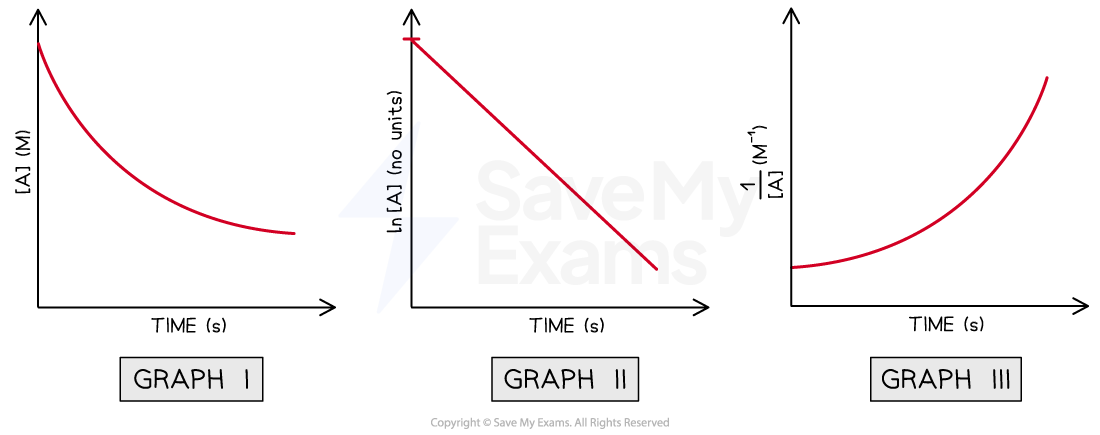
After performing the experiment, the student has plotted the following graphs,

Using the graphs above, determine the order of reaction with respect to A
Answer:
The only graph from these three that is an straight line is Graph II
The axis from this graph are ln[A] vs time
By comparing the three straight line equations, the order of the reaction with respect to [A] must be 1 because it is the only one in which ln[A] is present
ln [A]t = -kt + ln [A]0
Therefore, it is a first order reaction with respect to A
The importance of the slope in concentration-time graphs
The slope in concentration-time graphs determine the rate constant of the reaction
The formula for the slope/gradient is:
Therefore, if the overall order of reaction is determined, the rate constant can be obtained by calculating the slope of the concentration-time graphs
For a zero-order reaction, plotting the concentration of reactant vs time
[A]t versus t
For a first-order reaction, using a plot natural logarithm of the concentration of reactant vs time
ln [A]t versus t
For a second-order reaction, plotting the inverse of the concentration of reactant vs time
Worked Example
A student carried the following reaction at the laboratory:
A+B → products
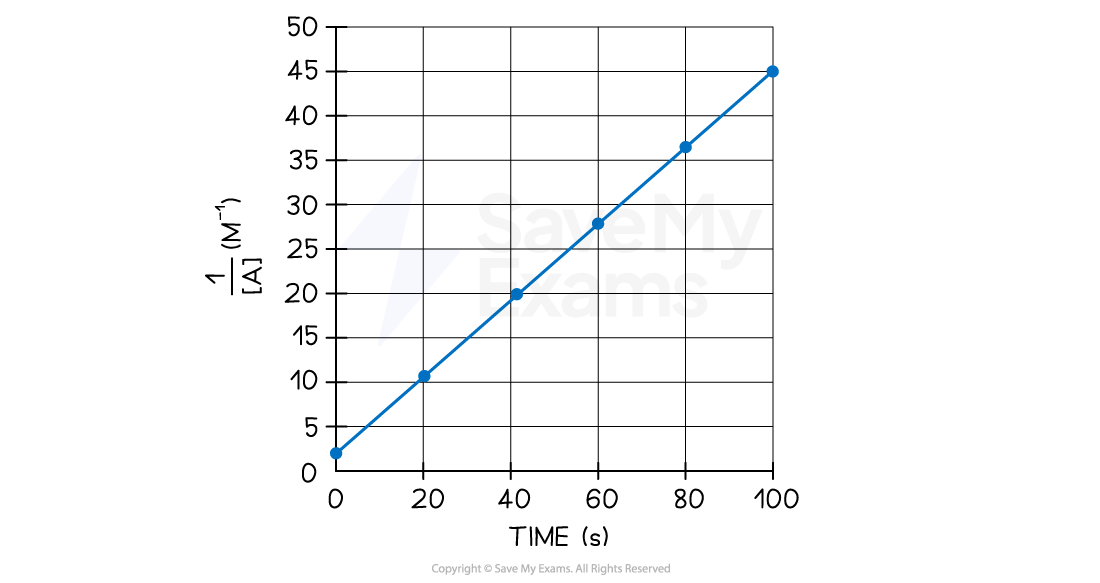
The student knows it is a zero order with respect to B. She has plotted the following graph:

Using the graph above, determine the rate constant and write the general rate equation for the reaction
Answer:
Step 1: Determine the order of reaction respect to A
The axis from this graph are 1/[A] vs time
By comparing the three straight line equations, the order of the reaction with respect to [A] must be 2 because it is the only one in which 1/[A] is present
Therefore, it is a second order reaction with respect to A
Step 2: Determine the overall order of reaction
Since the statement establishes that it is a zero order reaction respect to B, the overall order is 2
Therefore, the general rate equation should look like this:
rate =k [A]2
Step 3: Choose two points and write down their coordinates
Point 1 (0, 2.5)
Point 2 (80, 37.5)
Step 4: Calculate the slope/gradient using the coordinates
gradient = 0.434
Step 5: Calculate the units for the rate constant
units of k = M-1 s-1
Step 6: Write down the final rate equation by replacing the calculated value for k
rate = k [A]2
rate = (0.434 M-1 s-1) [A]2

Unlock more, it's free!
Did this page help you?