Regulating Gene Expression (College Board AP® Biology): Exam Questions

32 mins19 questions
1
Sme Calculator
1 mark

Regulatory sequences are involved in the control of gene expression.

Which of the following correctly describes regulatory sequences?

  • Proteins that bind to regulatory molecules and initiate transcription.

  • Regions of DNA that interact with regulatory proteins to control transcription.

  • Ribosomal RNA molecules that regulate translation.

  • Structural genes that code for enzymes for metabolic pathways.

Did this page help you?

2
Sme Calculator
1 mark

The lac operon in bacteria controls the expression of genes that code for the enzymes in lactose digestion.

Which of the following correctly describes the effect of the presence of lactose on the lac operon?

  • The repressor binds to the operator, blocking transcription.

  • The repressor is inactivated by lactose, allowing transcription of genes.

  • RNA polymerase cannot bind to the promoter, so transcription does not occur.

  • Lactose directly binds to RNA polymerase to initiate transcription.

Did this page help you?

3
Sme Calculator
1 mark

Transcription factors are proteins involved in the regulation of gene expression.

Which of the following correctly describe how transcription factors influence phenotype?

  • They influence the binding of RNA polymerase to DNA.

  • They alter DNA sequences to change gene function.

  • They prevent translation by breaking down mRNA.

  • They enable alternative splicing of mRNA.

Did this page help you?

4
Sme Calculator
1 mark

The genes expressed by a cell determine a cell's structure and function; this means that it is essential for cells to regulate their gene expression.

Which of the following correctly describes a difference between regulation of gene expression in prokaryotes compared to eukaryotes?

  • Expression of prokaryotic genes cannot be affected by environmental conditions.

  • Prokaryotic cells do not have promoters regions in their DNA.

  • Only prokaryotes use coordinate regulation of genes.

  • Only prokaryotes use operons for gene regulation.

Did this page help you?

5
Sme Calculator
1 mark

Differences in the expression of genes account for some of the phenotypic differences between organisms.

Which statement best explains how gene expression affects phenotypes in multicellular organisms?

  • All cells in an organism express the same genes at different levels, influencing cell development.

  • Only stem cells contain a full set of genes, while differentiated cells lose unnecessary genes.

  • Different genes are expressed in different cell types at different levels, producing proteins that determine cell function.

  • Gene expression only affects external traits, such as eye color or height, but does not influence cellular processes.

Did this page help you?

1
Sme Calculator
1 mark

Researchers investigated the effect of diet on DNA methylation, a type of DNA modification during which methyl groups are added to DNA. They studied a group of genetically identical mice, exposing half of them to a high-fat diet and the other half to a normal diet for 12 weeks. They then measured the methylation levels of a gene associated with obesity in liver cells from both groups. The results are shown in Figure 1.

Bar chart showing DNA methylation levels in liver cells. High-fat diet has around 57% methylation, while normal diet has about 15%.
Figure 1: DNA methylation in mice fed a normal diet and mice fed a high-fat diet.

Which of the following conclusions is best supported by the data?

  • A high-fat diet causes mutation in obesity-associated genes in mice.

  • DNA methylation levels are not affected by dietary changes.

  • Increased DNA methylation leads to higher expression of obesity-associated genes.

  • Environmental factors can lead to epigenetic modifications.

Did this page help you?

2
Sme Calculator
1 mark

The lac operon is a group of genes found in in prokaryotes that regulates production of the enzyme β-galactosidase. Scientists studied the effect of glucose and lactose sugar on the lac operon in E. coli bacteria. They set up four experimental conditions:

  1. no glucose or lactose

  2. glucose only

  3. lactose only

  4. both glucose and lactose

They measured the levels of β-galactosidase enzyme produced by bacteria under each condition.

Which of the following is the correct null hypothesis for this investigation?

  • The presence or absence of glucose and lactose has no effect on β-galactosidase enzyme production in E. coli.

  • β-galactosidase enzyme is only produced by E. coli in the absence of both glucose and lactose.

  • The presence or absence of glucose and lactose has an effect on β-galactosidase enzyme production in E. coli.

  • β-galactosidase enzyme production in E. coli increases in the presence of lactose, regardless of glucose availability.

Did this page help you?

3
Sme Calculator
1 mark

Genes involved in tumor development are typically classified into two main categories: oncogenes and tumor suppressor genes.

Which of the following correctly describes the role of tumor suppressor genes?

  • Promoting rapid cell division and growth.

  • Coding for proteins that slow the cell cycle and signal apoptosis.

  • Binding to enhancer sequences to increase the rate of transcription.

  • Silencing DNA to prevent gene expression.

Did this page help you?

4
Sme Calculator
1 mark

The phenotype of a cell or organism is determined by the combination of genes that are expressed and the levels at which they are expressed. Figure 1 below shows an example of a mechanism by which levels of gene expression can be regulated.

Diagram showing a section of DNA at the start of a gene. Region X binds a molecule (1), causing Enzyme Y (2) to activate, moving forward (3).
Figure 1. A mechanism by which gene expression can be regulated

Which of the following best describes the mechanism shown?

  • The molecule at stage 1 is a negative regulatory molecule.

  • The molecule at stage 1 is a regulatory protein that prevents RNA polymerase from binding to the start of the gene.

  • The molecule at stage 1 is lactose, and region X is an operator next to a group of coordinately regulated genes.

  • The molecule at stage 1 is a transcription factor which binds to a promoter and initiates transcription.

Did this page help you?

5
Sme Calculator
1 mark

The regulation of gene expression is essential for ensuring that cells produce the right proteins at the right time, influencing both cellular function and organismal development.

Which of the following correctly describe a type of interaction that regulates gene expression?

  • Small, interfering RNAs bind to double-stranded DNA and increase the level at which a gene is expressed.

  • Epigenetic changes alter the DNA base sequence in order to modify gene expression.

  • Reversible modifications, such as DNA methylation, influence gene accessibility and transcription rates.

  • Regulatory sequences interact with promoter regions to control gene expression.

Did this page help you?

1
Sme Calculator
1 mark

Plant cells use transcription factors in a similar way to animal cells. One transcription factor found in plant cells is known as PIF. When activated, PIF binds to a promoter region, triggering transcription of the amylase gene and initiating seed germination. PIF is inhibited a repressor protein called DELLA. The activity of PIF is regulated by the plant hormone gibberellin in the process shown in Figure 3.

Diagram illustrating the process where gibberellin triggers the breakdown of della, freeing PIF to bind to the promoter, initiating transcription.
Figure 3. The interaction between gibberellin and the DELLA repressor protein.

Which of the following best explains how the application of gibberellin hormone can facilitate the germination of seeds?

  • Gibberellin promotes the binding of DELLA to the amylase gene, preventing transcription.

  • Gibberellin activates an enzyme that breaks down DELLA, allowing PIF to activate transcription of the amylase gene.

  • Gibberellin binds to an enzyme, allowing it to attach to the promoter of the amylase gene and initiate transcription.

  • Gibberellin directly breaks down DELLA, allowing PIF to bind to the promoter region of the amylase gene.

Did this page help you?

2
Sme Calculator
1 mark

Gene expression can be affected by modification of histone proteins. Histones can be modified by the removal of acetyl groups, a process that is catalysed by a group of enzymes known as histone deacetylases (HDACs). Researchers investigated the role of histone acetylation in gene expression. They treated human fibroblast cells with a histone deacetylase inhibitor (HDACi) and measured the expression levels of various genes over several hours. The results for one gene are shown in Figure 2.

Line graph showing gene expression levels increasing from 2 to 12 over 10 hours after HDACi treatment, then stabilizing from 12 to 25 hours.
Figure 2. The effect of HDACi treatment on gene expression over time

Which of the following conclusions about histone acetylation and gene expression is best supported by the data?

  •  Higher levels of histone deacetylation lead to increased gene expression.

  • The level of histone acetylation has no effect on gene expression.

  • A higher level of histone acetylation is linked to increased gene expression.

  • After the addition of HDACi gene expression increases until 12 hours and then remains constant.

Did this page help you?

3
Sme Calculator
1 mark

Coordinately regulated genes in prokaryotes are grouped in clusters known as operons. Operons contain several genes that code for proteins that work together to perform a single function. Figure 1 shows the trp operon, a group of genes that control the expression of proteins needed for production of the amino acid tryptophan (trp).

Diagram of the trp operon showing the regulatory region with trpR, P, O, trpL, and structural genes trpE, trpD, trpC, trpB, trpA.
Figure 1. The trp operon

Which of the following best explains why the trp operon is an example of a negative regulatory mechanism for regulating gene expression?

  • Tryptophan, when it is present, binds to a protein that activates expression of structural genes.

  • Tryptophan, when it is present, binds to a protein that represses expression of structural genes.

  • Tryptophan, when it is present, binds to DNA and prevents RNA polymerase from transcribing the structural genes.

  • Tryptophan, when it is present, binds to a regulatory protein and alters rates of expression of the structural genes.

Did this page help you?

4
Sme Calculator
1 mark

A researcher studied the effect of mutations in the DNA of fruit flies (Drosophila melanogaster). The mutations were in a group of genes called Hox genes, and had the following effects:

  • Mutation A = Hox gene downregulation, reducing its activity

  • Mutation B = Hox gene upregulation, enhancing its activity

  • Mutation C = Hox gene deletion

The researcher recorded the following data:

Mutation

Observed effect on D. melanogaster phenotype

A

Extra pair of wings formed

B

Antenna replaced by a leg

C

Head segment formed instead of thorax

Which of the following is the most likely claim the researcher could make from these observations?

  • Hox genes code for transcription factors that regulate gene expression.

  • Reducing the expression of Hox genes has a greater effect on phenotype than increasing expression.

  • Hox genes control the development of body plan in all groups of organisms.

  • Hox gene products are involved with the regulation of body development in D. melanogaster.

Did this page help you?

5
Sme Calculator
1 mark

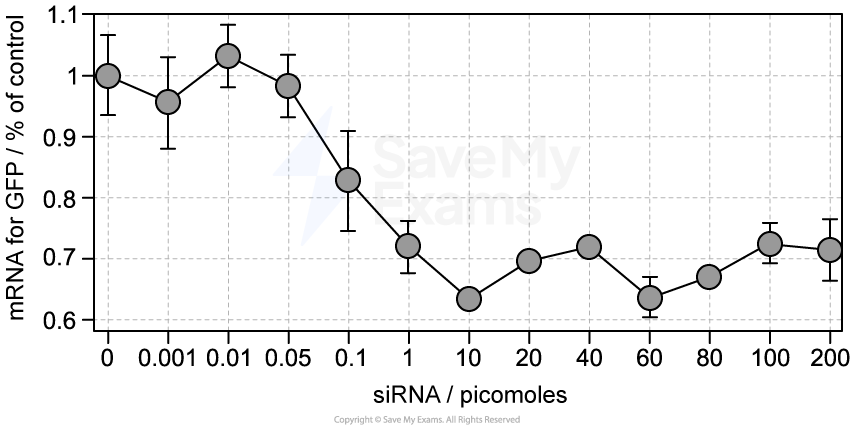
A team of scientists investigated the effects of small interfering RNA (siRNA) expression of a gene that codes for green fluorescent protein (GFP). They exposed human liver cells that had been genetically modified to express GFP to varying levels of siRNA and measured mRNA levels in treated cells. They then compared these levels to mRNA levels in untreated cells. Their results are shown in Figure 1 below. The error bars in Figure 1 represent standard error.

Graph showing mRNA for GFP as a percentage of control versus siRNA in picomoles. Data points with error bars indicate decreasing trend from 0.1 picomoles.
Figure 1. The effect of siRNA concentration on mRNA levels in modified liver cells.

Which of the following best describes the data shown in Figure 1?

  • Significantly less mRNA is present at 1 pmol of siRNA than at 0.1 pmol.

  • Increasing the concentration of siRNA in human liver cells always results in a decrease in the volume of mRNA present.

  • Starting from a concentration of 0.01 pmols and increasing the siRNA concentration by 100x results in an mRNA reduction of approximately 0.32 %.

  • Exposing modified liver cells to siRNA will reduce the volume of GFP protein expressed.

Did this page help you?