Enzymes (College Board AP® Biology): Exam Questions

31 mins17 questions
1
Sme Calculator
1 mark

A biochemist is studying an enzyme that catalyzes the breakdown of a toxic compound in liver cells. She observes that the enzyme remains unchanged at the end of the reaction.

Which of the following best describes the role of an enzyme?

  • Enzymes increase the activation energy of a single reaction.

  • Enzymes permanently bind to substrates to facilitate reactions.

  • Ribosomes synthesize enzymes to replace those used during chemical reactions.

  • Enzymes lower the activation energy and remain unchanged for future reactions.

Did this page help you?
2
Sme Calculator
1 mark

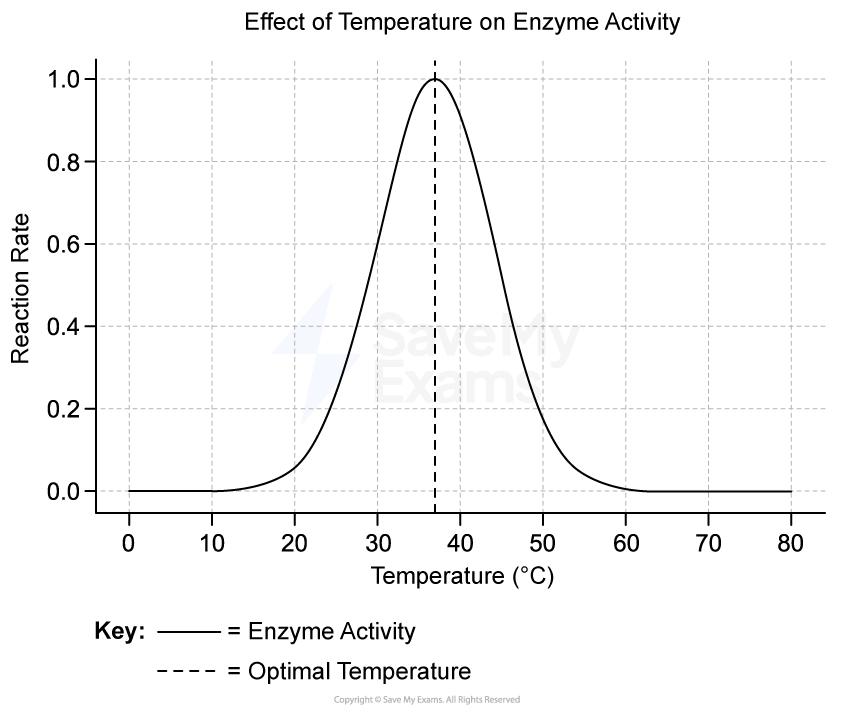
The graph below shows the rate of an enzyme-catalyzed reaction at different temperatures.

Graph showing enzyme activity vs temperature. Reaction rate peaks at optimal temperature around 37°C, indicated by a dashed red line.

What is the best explanation for the change in reaction rate between 40°C and 50°C?

  • The enzyme becomes more efficient at high temperatures.

  • The enzyme’s active site denatures, reducing substrate binding.

  • The substrate is entirely used up.

  • The enzyme shifts to an alternative reaction pathway.

Did this page help you?

3
Sme Calculator
1 mark

A researcher is testing the effect of substrate concentration on the rate of reaction in an unknown enzyme.

Which variable should they keep constant to ensure a valid result?

  • Temperature and pH

  • Substrate concentration

  • The time taken for the reaction to complete

  • Amount of product formed

Did this page help you?

4
Sme Calculator
1 mark

A student conducts an experiment measuring enzyme activity at different pH levels. The data collected is shown in the graph below.

Graph showing enzyme activity vs. pH level, peaking at pH 8. A red dashed line marks the optimal pH. Activity increases to 25, then declines.


Based on the data, which conclusion can the student make?

  • The enzyme functions best at low pH values.

  • Enzyme activity is highest at a specific pH level and decreases outside this range.

  • The enzyme is permanently denatured outside of the optimum pH range.

  • The enzyme activity is unaffected by pH changes.

Did this page help you?

5
Sme Calculator
1 mark

The following graph shows the rate of reaction of an enzyme in different substrate concentrations.

Graph with substrate concentration on x-axis and rate of reaction on y-axis, showing curves A, B, C, D, each levelling off at different rates.

Which letter, A to D, shows the rate of reaction without presence of an inhibitor?

    Did this page help you?

    1
    Sme Calculator
    1 mark

    Enzymes play a critical role in lowering the activation energy required for a chemical reaction to occur. In a metabolic pathway, enzymes bind to specific substrates to facilitate this process. Which of the following best explains how enzymes lower the activation energy of reactions?

    • By breaking down substrates into smaller molecules before reactions occur.

    • By providing heat to reactants, increasing their kinetic energy.

    • By destabilizing bonds within the substrate, making it more reactive.

    • By working together with another enzyme in the pathway to collectively lower the activation energy.

    Did this page help you?

    2
    Sme Calculator
    1 mark

    A researcher is studying the effect of cyanide, a non-reversible inhibitor, on mitochondrial enzymes during cellular respiration. When cyanide binds to cytochrome oxidase, it halts the production of ATP.

    Which of the following best explains why cyanide is considered a poison?

    • It lowers the activation energy needed for mitochondrial reactions

    • It permanently blocks the active site, preventing the enzyme from catalyzing reactions

    • It increases the efficiency of cellular respiration

    • It causes an increase in substrate concentration, leading to faster reactions

    Did this page help you?

    3
    Sme Calculator
    1 mark

    Enzymes are biological catalysts that function optimally at certain temperatures. Researchers conducted an experiment to observe how temperature affects the activity of the enzyme amylase, which breaks down starch.

    They measured the amount of starch remaining over time at three different temperatures: 25°C, 37°C, and 50°C. The results are shown in the table below.

    Time (minutes)

    Starch remaining at 25°C (%)

    Starch remaining at 37°C (%)

    Starch remaining at 50°C (%)

    0

    100

    100

    100

    10

    80

    50

    60

    20

    65

    10

    40

    30

    50

    0

    20

    Which of the following conclusions is best supported by the data?

    • Amylase works most efficiently at 25°C

    • The rate of starch breakdown is highest at 37°C

    • Amylase denatures at 25°C, reducing its activity

    • 50°C is the optimal temperature for amylase activity

    Did this page help you?

    4
    Sme Calculator
    1 mark

    In a study, researchers examined how competitive and non-competitive inhibitors affect the enzyme maltase, which breaks down maltose into glucose. They measured the rate of glucose production in reactions with and without inhibitors.

    Bar chart showing glucose production rates: 50 mg/min with no inhibitor, 45 mg/min with competitive inhibitor, and 20 mg/min with non-competitive inhibitor.

    Which of the following claims is best supported by the experiment's data?

    • Competitive inhibitors reduce the total amount of product formed

    • Non-competitive inhibitors inhibit the enzyme faster than the competitive inhibitor

    • Increasing substrate concentration would not affect the outcome with a competitive inhibitor

    • Competitive inhibitors are more effective than non-competitive inhibitors

    Did this page help you?

    5
    Sme Calculator
    1 mark

    Lactase is an enzyme that breaks down lactose, the primary sugar in milk, into glucose and galactose. This enzyme is crucial for lactose digestion in mammals.

    Researchers were investigating the effects of pH on lactase activity to understand why some individuals experience lactose intolerance. They conducted an experiment measuring lactase activity across a range of pH values, keeping all other factors constant. The results of their experiment are shown in the graph below.

    Graph showing relative lactase activity percentage against pH. Activity peaks around pH 6.5, with lower activity at pH 5 and 8.

    Activity is expressed relative to the optimum of the enzyme. Which of the following conclusions about lactase is best supported by the data?

    • Lactase functions optimally in highly acidic environments, such as the stomach

    • The enzyme has a broad pH tolerance, maintaining high activity across all pH levels

    • Lactase has an optimal pH range near neutral, consistent with its function in the small intestine

    • The enzyme's activity increases linearly with pH due to increased ionization of its active site

    Did this page help you?

    1
    Sme Calculator
    1 mark

    A team of researchers is studying how enzyme inhibition affects cellular processes. They introduce a noncompetitive inhibitor targeting ATP synthase and analyze the physiological effects on the cells.

    Which of the following is a likely observation made by the researchers?

    • A reduction in the rate of oxidative phosphorylation can be reversed by increasing glucose availability.

    • A reduction in the rate of ATP production can be reversed with the addition of ADP + Pi.

    • A temporary decrease in ATP production is observed, but increasing substrate concentration allows the mitochondria to maintain normal energy output.

    • Despite an increase in substrate concentration, the Na⁺/K⁺ pump fails to maintain ion gradients and signal transduction pathways are disrupted.

    Did this page help you?

    2
    Sme Calculator
    1 mark

    A team of scientists is investigating the effect of enzyme concentration on reaction rate in an ATP-generating metabolic pathway. They prepare multiple reaction mixtures containing varying enzyme concentrations while keeping substrate concentration constant. The reaction rate is measured by tracking ATP production over time.

    The following data is recorded:

    Enzyme Concentration (µg/mL)

    ATP Produced (nmol/min)

    0.5

    10

    1.0

    20

    2.0

    35

    4.0

    45

    8.0

    47

    Based on the data, which conclusion best explains the relationship between enzyme concentration and reaction rate?

    • The reaction rate continuously increases as enzyme concentration increases, indicating that the enzyme is the limiting factor.

    • The reaction rate increases initially but plateaus at higher enzyme concentrations, suggesting that substrate availability becomes the limiting factor.

    • ATP production decreases at higher enzyme concentrations, indicating that enzyme molecules compete with each other for substrate binding.

    • The presence of an enzyme inhibitor is preventing ATP production from increasing proportionally with enzyme concentration.

    Did this page help you?

    3
    Sme Calculator
    1 mark

    Researchers are studying the regulation of an enzyme involved in nitrogen metabolism in two bacterial species. The enzyme processes nitrogen-containing compounds, and its activity is influenced by nitrogen availability in the environment.

    • Species A inhabits stable environments with constant nitrogen levels.

    • Species B experiences fluctuating nitrogen conditions, requiring it to adjust metabolic activity efficiently.

    The researchers measure enzyme activity under different nitrogen levels and obtain the following data:

    Species

    Enzyme Activity (Low Nitrogen)

    Enzyme Activity (High Nitrogen)

    Species A

    80%

    78%

    Species B

    90%

    15%

    Which of the following best explains the difference in enzyme regulation between these species?

    • Species A’s enzyme is regulated through competitive inhibition, while Species B’s enzyme is regulated through noncompetitive inhibition, allowing it to decrease activity when nitrogen is abundant.

    • The decline in enzyme activity in Species B at high nitrogen levels suggests that increasing nitrogen concentration prevents substrate binding, reducing reaction rates.

    • Species A’s enzyme functions independently of nitrogen availability, while Species B has evolved noncompetitive inhibition, where nitrogen binds to a site other than the active site and decreases enzyme function.

    • Species B’s enzyme is permanently inactivated at high nitrogen levels, preventing excess metabolic activity through irreversible inhibition.

    Did this page help you?

    4
    Sme Calculator
    1 mark

    A group of researchers is studying the effect of pH on the activity of peroxidase, an enzyme that breaks down hydrogen peroxide into water and oxygen gas. To measure enzyme function, they use guaiacol, a colorless compound that undergoes oxidation to form a brown product (tetra-guaiacol) when peroxidase is active. Enzyme activity is then quantified by measuring absorbance at 470 nm using a spectrophotometer.

    The data collected after 3 minutes is shown below:

    pH

    Absorbance at 470 nm

    3

    0.005

    5

    0.663

    6

    0.347

    7

    0.170

    8

    0.047

    10

    0.003

    Which conclusion is best supported by this data?

    • The enzyme functions optimally at acidic pH, and its activity declines at neutral and basic pH levels due to enzyme denaturation.

    • Increasing pH progressively increases enzyme activity as the enzyme's active site becomes more available to bind the substrate.

    • The oxidation of guaiacol is lowest at pH 5, which explains why the absorbance is highest at this pH.

    • The enzyme remains fully functional at all pH values but works more slowly under basic conditions.

    Did this page help you?

    5
    Sme Calculator
    1 mark

    Protease is a digestive enzyme that aids in protein digestion. Researchers investigated how environmental conditions affect protease activity in two fish species, X and Y, found in different aquatic habitats. They measured enzyme activity at different pH levels and found significant differences in stomach and intestinal protease function between the species.

    Bar chart showing protease activity in Species X and Y. Stomach protease in white, intestinal in grey. Higher activity in intestinal for both species.

    Given the data shown in the graph, which conclusion is most supported?

    • The activity of the stomach protease of species Y is 2.5 times greater than that of species X.

    • The activity of the intestinal protease of species X is significantly higher than the stomach protease of species X.

    • The activity of the stomach protease of species X is 3.5 times less than that of species Y.

    • The activity of the intestinal proteases of both species X and Y are significantly higher than the stomach proteases.

    Did this page help you?