Population Ecology (College Board AP® Biology) : Study Guide

Population growth
A population can be defined as:
a group of organisms of the same species, occupying a particular space at a particular time
Population dynamics are the changes in population size, structure and composition over time
Populations are influenced by interactions among individuals, their environment, and the availability of energy and resources
The growth or decline of a population depends on biotic factors and abiotic factors
Population growth is described using the equation:
![]()
Where:
N is population size
dN/dt is the change in population size over time
B is the birth rate
D is the death rate
Exponential growth occurs when reproduction is unconstrained, following the equation:
format('truetype')%3Bfont-weight%3Anormal%3Bfont-style%3Anormal%3B%7Dtext%7Bfill%3A%23000000%3B%3C%2Fstyle%3E%3C%2Fdefs%3E%3Cline%20stroke%3D%22%23000000%22%20stroke-linecap%3D%22square%22%20stroke-width%3D%221%22%20x1%3D%222.5%22%20x2%3D%2228.5%22%20y1%3D%2223.5%22%20y2%3D%2223.5%22%2F%3E%3Ctext%20font-family%3D%22Times%20New%20Roman%22%20font-size%3D%2218%22%20font-style%3D%22italic%22%20text-anchor%3D%22middle%22%20x%3D%228.5%22%20y%3D%2216%22%3Ed%3C%2Ftext%3E%3Ctext%20font-family%3D%22Times%20New%20Roman%22%20font-size%3D%2218%22%20font-style%3D%22italic%22%20text-anchor%3D%22middle%22%20x%3D%2219.5%22%20y%3D%2216%22%3EN%3C%2Ftext%3E%3Ctext%20font-family%3D%22Times%20New%20Roman%22%20font-size%3D%2218%22%20font-style%3D%22italic%22%20text-anchor%3D%22middle%22%20x%3D%2212.5%22%20y%3D%2241%22%3Ed%3C%2Ftext%3E%3Ctext%20font-family%3D%22Times%20New%20Roman%22%20font-size%3D%2218%22%20font-style%3D%22italic%22%20text-anchor%3D%22middle%22%20x%3D%2219.5%22%20y%3D%2241%22%3Et%3C%2Ftext%3E%3Ctext%20font-family%3D%22math17f39f8317fbdb1988ef4c628eb%22%20font-size%3D%2216%22%20text-anchor%3D%22middle%22%20x%3D%2239.5%22%20y%3D%2230%22%3E%3D%3C%2Ftext%3E%3Ctext%20font-family%3D%22Times%20New%20Roman%22%20font-size%3D%2218%22%20font-style%3D%22italic%22%20text-anchor%3D%22middle%22%20x%3D%2251.5%22%20y%3D%2230%22%3Er%3C%2Ftext%3E%3Ctext%20font-family%3D%22Times%20New%20Roman%22%20font-size%3D%2213%22%20font-style%3D%22italic%22%20text-anchor%3D%22middle%22%20x%3D%2260.5%22%20y%3D%2238%22%3Em%3C%2Ftext%3E%3Ctext%20font-family%3D%22Times%20New%20Roman%22%20font-size%3D%2213%22%20font-style%3D%22italic%22%20text-anchor%3D%22middle%22%20x%3D%2268.5%22%20y%3D%2238%22%3Ea%3C%2Ftext%3E%3Ctext%20font-family%3D%22Times%20New%20Roman%22%20font-size%3D%2213%22%20font-style%3D%22italic%22%20text-anchor%3D%22middle%22%20x%3D%2274.5%22%20y%3D%2238%22%3Ex%3C%2Ftext%3E%3Ctext%20font-family%3D%22Times%20New%20Roman%22%20font-size%3D%2218%22%20font-style%3D%22italic%22%20text-anchor%3D%22middle%22%20x%3D%2285.5%22%20y%3D%2230%22%3EN%3C%2Ftext%3E%3C%2Fsvg%3E)
Where:
dt = change in time
N = population size
rmax = maximum per capita growth rate of a population
This growth creates a J-shaped curve, characteristic of exponential growth
Worked Example
Reintroduction and conservation of the American beaver (Castor canadensis) has resulted in the population increasing from 60 000 to 250 000 individuals in one area of British Columbia, Canada in the period from 1970 to 2020.
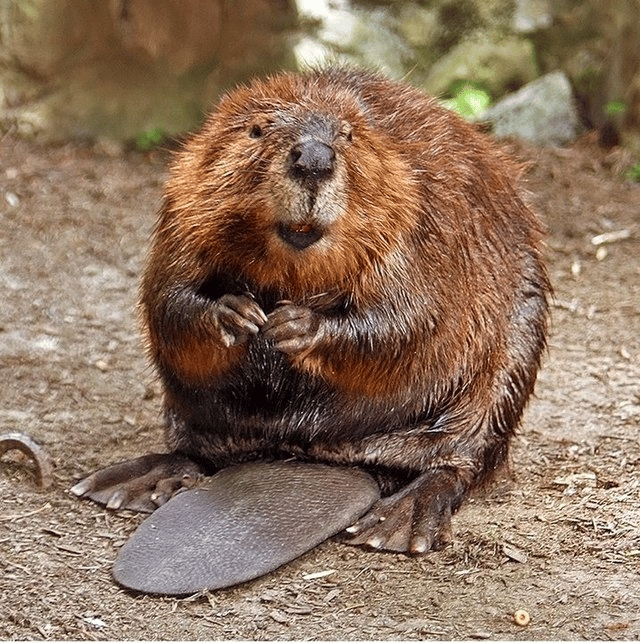
The American beaver (Castor canadensis)
CC BY-SA 2.0, Steve, Washington DC, via Wikimedia Commons
The mean death rate over that period is estimated to be 1 200 animals per year
Calculate the average birth rate of population during the period 1970 to 2020.
Answer:
Step 1: calculate the change in population
Population at the end= 250 000
Population at the start = 60 000
Change in population = 250 000 - 60 000 = 190 000 beavers
Step 2: calculate the change in time
Ending year = 2020
Starting year = 1970
Change in time = 2020 - 1970 = 50 years
Step 3: calculate the average rate of change
![]()
Step 4: calculate the birth rate
![]()
3 800 = Birth rate - 1 200
Average birth rate = 5000 per year
Population density
Various constraints impact population growth:
Density-dependent factors are factors that have a stronger effect as population density increases
E.g. competition for resources, predation, disease
Density-independent factors affect populations regardless of population density
E.g. natural disasters, extreme weather
The logistic growth model
When density-dependent and density-independent factors limit population growth, logistic growth usually occurs
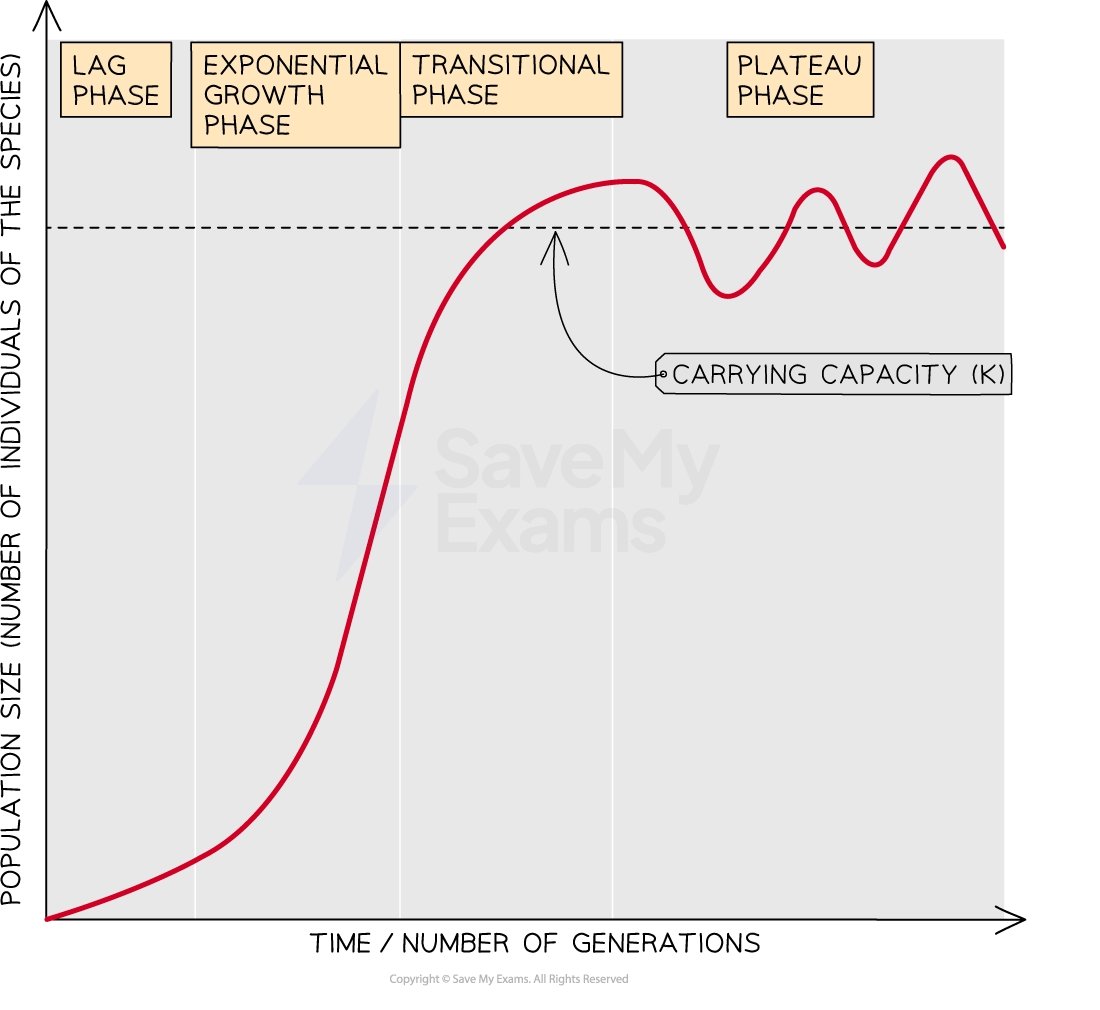
The logistic model produces a population growth curve which is sigmoid, or S-shaped
Such curves contain four phases:
lag phase
The initial stage of population growth
Characterized by slow growth and a small population size
Organisms are adapting to their environment with low levels of reproduction
exponential phase
Also known as the logarithmic phase
Here there are no factors that limit population growth, so the population increases exponentially
The number of individuals increases, and so does the rate of growth
This part of the curve is J-shaped
transition phase
As the population size increases, the density may increase past the threshold that can be supported by the system resource availability
Limiting factors start to act on the population, eg. competition increases and predators are attracted to large prey populations
The rate of growth slows, though the population is still increasing
plateau phase
Also known as the stationary phase
Limiting factors cause the death rate to equal the birth rate and population growth stops
This plateau occurs at the carrying capacity where the environment cannot sustain any further increase in population
The population size often fluctuates slightly around the carrying capacity
Equation for the logistic growth model
The logistic growth model is described by the following equation:
![]()
Where:
dt is the change in time
N the population size
rmax is the maximum per capita growth rate of the population
K is the carrying capacity
The essence of this equation is that when N is large (near to the carrying capacity), then the term in brackets will be close to zero, so the growth rate will be small

You've read 0 of your 5 free study guides this week
Unlock more, it's free!
Did this page help you?
