Mendelian Genetics (College Board AP® Biology) : Study Guide

Mendel's laws
Gregor Mendel was an Austrian monk in the mid-19th century; he carried out breeding experiments on large numbers of pea plants
Mendel studied how characteristics were passed on between generations of plants
Mendel found that characteristics were inherited in a predictable pattern
All pea plants in the first generation had the same characteristics as one of the parental plants (e.g. they were all tall)
The offspring plants in the second generation had characteristics of both parent plants in a 3:1 ratio
These observations formed the basis of Gregor Mendel's laws of inheritance
Mendel's law of segregation
Mendel's law of segregation states that
each trait is determined by two alleles that are randomly separated during gamete formation
Gametes contain one allele of each gene
This means there are two possible allele outcomes for each gene in each gamete
During fertilization, two gametes fuse to restore the diploid number of alleles - two alleles for each gene
Combinations of alleles in offspring are random due to random segregation and random fertilization
Mendel's law of independent assortment
Mendel's law of independent assortment states that
genes located on different chromosomes are assorted independently during gamete formation
There are 23 pairs of chromosomes and each homologous pair contains a different set of genes
The inheritance of traits on one chromosome does not influence which traits are inherited on another chromosome
The alleles of a gene are segregated randomly into different gametes and the assortment of alleles of one gene does not affect the assortment of alleles for another gene
During fertilization, two gametes fuse to restore the diploid number of alleles - two alleles for each gene
Combinations of alleles from different genes in offspring are random due to random assortment and random fertilization
Laws of Probability
Rules of probability can be applied to analyze the inheritance of single gene characteristics from parent to offspring; this is called monohybrid inheritance
If events A and B are mutually exclusive, then:
P(A or B) = P(A) + P(B)
If events A and B are independent, then:
P(A and B) = P(A) × P(B)
It is important to remember that the rules of probability will only apply accurately to unlinked genes
However, the data yielded by crossing experiments and formation pedigree diagrams (with the genotypes and phenotypes of parents and offspring) can lead to conclusions that support other types of inheritance:
Dihybrid inheritance
Linked inheritance
Chi-square hypothesis testing
The chi-square test is a statistical test that compares observed results to expected results, including those predicted by Mendel's laws
The test can be used to determine if the observed results are statistically different from the expected results
The difference between expected and observed results in experiments can be statistically significant or insignificant (happened by chance)
If the difference between results is statistically significant it can suggest that something else is happening in the experiment that isn’t being accounted for
For example linkage between genes
The chi-squared test is completed when the data is categorical (data that can be grouped)
Calculating chi-squared values

Obtain the expected (E) and observed (O) results for the experiment
Calculate the difference between each set of results
Square each difference
It is irrelevant whether the difference is positive or negative
Divide each squared difference by the expected value
Add the resulting values together to get a sum of these answers to obtain the chi-squared value
Analysing chi-squared values
To work out what the chi-squared value means we need to compare the chi-squared value to a critical value
The critical value is read from a table of critical values and depends on the probability level used and the degrees of freedom
Biologists generally use a probability level of 0.05 or 5 %
This means that there is only a 5 % probability that any difference between O and E has occurred by chance
The degrees of freedom takes into account the number of comparisons made, and is calculated as follows:
degrees of freedom = number of classes - 1
E.g. if there are 2 phenotypes then 2 - 1 = 1 and there is 1 degree of freedom
When the chi-squared value is compared to the critical value conclusions are drawn as follows:
If the chi-squared value is greater than, or equal to, the critical value then there is a significant difference between observed and expected results
A factor other than chance is causing the difference
The null hypothesis can be rejected
If the chi-squared value is smaller than the critical value then there is no significant difference between observed and expected values
Any differences are due to chance
The null hypothesis is accepted
Worked Example
An experiment was carried out into inheritance of two genes in rabbits; one for coat colour and one for ear length. In this dihybrid cross the expected ratio of phenotypes was 9 : 3 : 3 : 1.
Rabbits with the heterozygous genotype were bred together and the phenotypes of all the offspring were recorded.
Complete a chi-squared test to determine whether the difference between observed and expected offspring ratios is significant.
Step 1: complete a table like the one below
| Phenotypes of offspring | |||
|---|---|---|---|---|
Brown coat, long ears | Brown coat, short ears | Black coat, long ears | Black coat, short ears | |
Observed Number, O | 73 | 21 | 26 | 8 |
Expected ratio | 9:3:3:1 | |||
Expected number, E | 72 | 24 | 24 | 8 |
O-E | 1 | -3 | 2 | 0 |
(O-E)2 | 1 | 9 | 4 | 0 |
(O-E)2 / E | 1/72 | 9/24 | 4/24 | 0 |
Note that the expected values can be calculated as follows:
9 + 3 + 3 + 1 = 16
128 (total number of rabbits) ÷ 16 = 8
3 x 8 = 24
9 x 8 = 72
Step 2: use the table contents to calculate the chi-squared value
1 ÷ 72 = 0.014
9 ÷ 24 = 0.375
4 ÷ 24 = 0.167
chi-squared value = ∑(O - E)2 ÷ E
= 0.014 + 0.375 + 0.167 + 0
= 0.56
Step 3: compare the chi-squared value to the critical value
Degrees of freedom | Probability that the difference between the observed and expected result is due to chance | |||
|---|---|---|---|---|
0.1 | 0.05 | 0.01 | 0.001 | |
1 | 2.71 | 3.84 | 6.64 | 10.83 |
2 | 4.60 | 5.99 | 9.21 | 13.82 |
3 | 6.25 | 7.82 | 11.34 | 16.27 |
4 | 7.78 | 9.49 | 13.28 | 18.46 |
The degrees of freedom can be calculated as follows:
In this example there are 4 phenotypes:
4 - 1 = 3 degrees of freedom
We are biologists so we work at a probability level of 0.05
The critical value is therefore 7.82
Step 4: draw conclusions
Answer:
The chi-squared value of 0.56 is smaller than the critical value of 7.82
This means that there is no significant difference between the expected and observed results and any differences that do occur are due to chance
0.56 would be located somewhere
e to the left-hand side of the table, indicating that there is a higher than 10 % probability that the difference between O and E is due to chance
A null hypothesis can be accepted
Monohybrid crosses
The rules of probability can be applied to predict the inheritance of single gene, or monohybrid, traits
In a monohybrid cross, we consider that the gene has two alleles
Where one allele is dominant and the other is recessive
Sometimes the alleles are codominant
To predict the outcome of a monohybrid cross, we start with purebreeding parents (homozygous), each displaying a different phenotype
Homozygous dominant and homozygous recessive
This generation is known as the parental generation, denoted as the P generation
We can use a Punnett grid to predict the probability of a certain offspring, of the P generation, displaying a certain genotype or phenotype
Constructing a Punnett grid
Write down the parental phenotypes and genotypes
Write down all the possible gamete genotypes that each parent could produce for sexual reproduction
A useful convention is to write the gamete genotypes inside a circle to denote them as gametes (haploid cells)
Place each parental genotype against one axis of a Punnett grid (2 x 2 table)
In the boxes of the Punnett grid, combine the gametes into the possible genotypes of the offspring
This gives the offspring of the F1 generation (1st filial generation)
List the phenotype and genotype ratios for the offspring
Worked Example
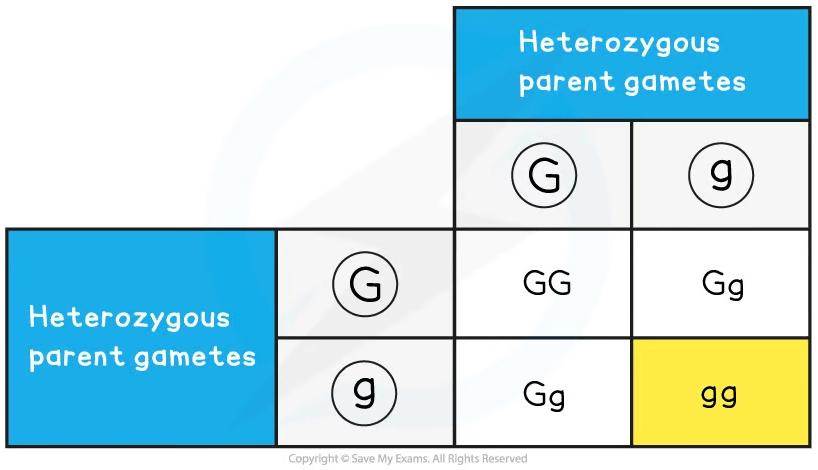
Sweet peas grow pods that are either green or yellow. The allele for green, G, is dominant to the allele for yellow, g. Construct a Punnett grid to predict the outcome when crossing green and yellow pure-bred plants to show the F1 generation offspring. Using plants from the F1 generation, construct a second Punnett grid to show the outcomes of the F2 generation.
Step 1: Write down the parental phenotype and genotypes
Green coloured pods Yellow coloured pods
GG gg
Step 2: Write down all the possible gamete genotypes that each parent could produce
Step 3: Place each parental genotype against one axis of a Punnett grid (2 x 2 table)
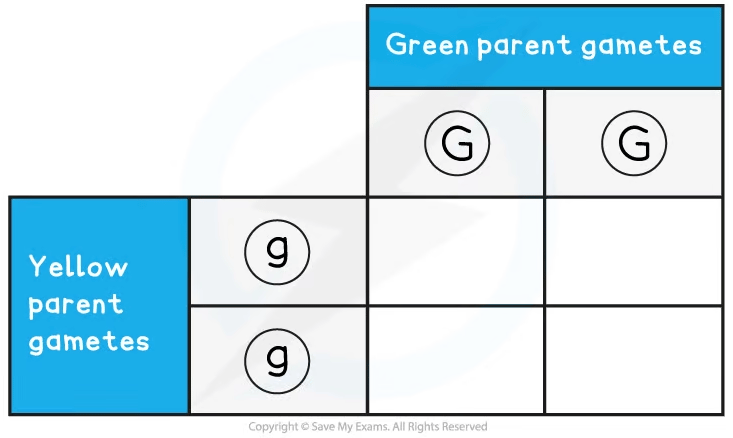
Step 4: Combine the gametes in each box of the Punnett grid
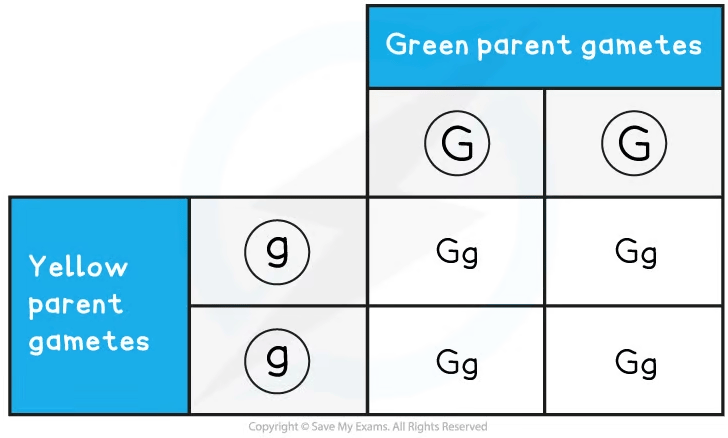
Step 5: Take two heterozygous offspring from the F1 generation and cross them
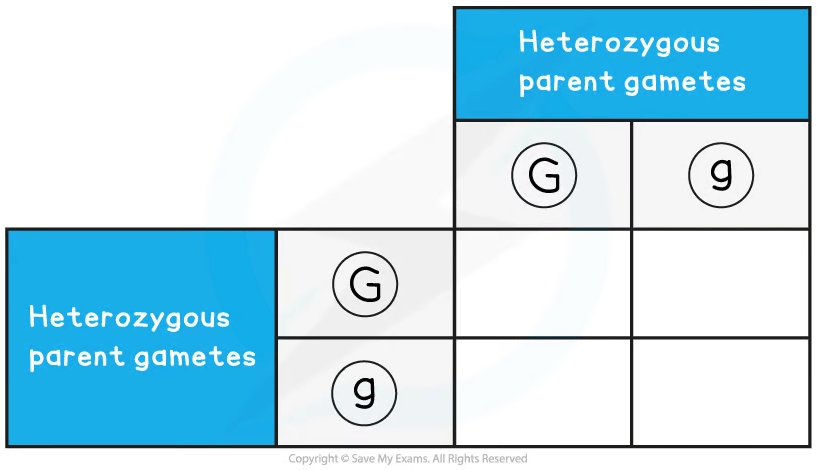
Step 6: Combine the gametes in each box of the Punnett grid
Dihybrid crosses & pedigree charts
Monohybrid crosses look at how the alleles of one gene transfer across generations
Dihybrid crosses look at how the alleles of two genes transfer across generations
i.e., dihybrid crosses can be used to show the inheritance of two completely different characteristics in an individual, for example unlinked genes
For dihybrid crosses, there are more genotypes and phenotypes involved
When writing out the different genotypes, write the two alleles for one gene, followed immediately by the two alleles for the other gene
E.g., if there was a gene with alleles Y and y and another gene with alleles G and g an example genotype for an individual would be YyGg
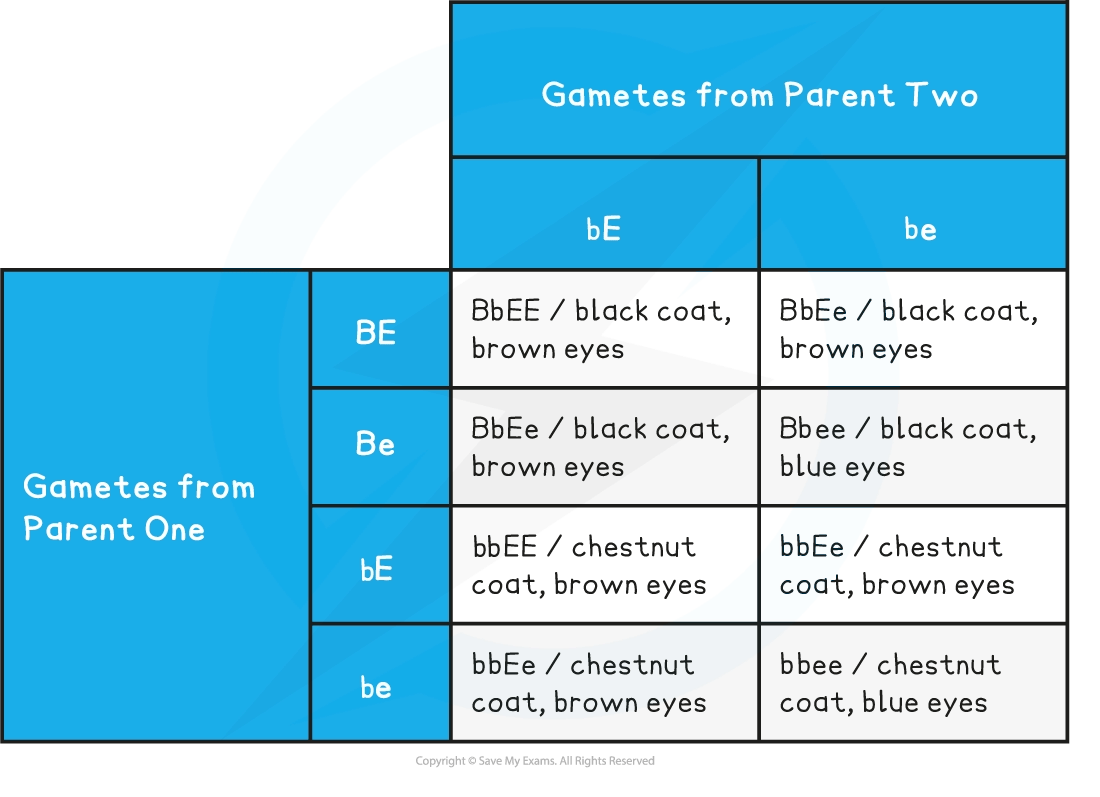
Predicted ratio of phenotypes in offspring
3 black coat, brown eyes :
3 chestnut coat, brown eyes :
1 black coat, blue eyes :
1 chestnut coat, blue eyes
Predicted ratio of genotypes in offspring = 3 BbEE : 3 bbEE : 1 Bbee : 1 bbee
Pedigree diagrams
The data contained in a pedigree chart allows patterns of inheritance to be mapped out and traced to predict the inheritance of genes even if they are linked-genes
Pedigree diagrams can provide information such as
Whether a trait is caused by a dominant or recessive allele
Whether a trait is more likely to be inherited by males or females
The genotypes of individuals in the family
The probability that an individual in the family will inherit a trait
A pedigree diagram can be interpreted in the following way:
Males are indicated by the square shape
Females are represented by circles
Affected and unaffected individuals can be indicated using colour, shading, or cross-hatching
Horizontal lines between males and females show that they have produced children
Vertical lines show the relationship between parent and child
Roman numerals may be used to indicate generations
For each generation, the eldest child is on the left and each individual is numbered
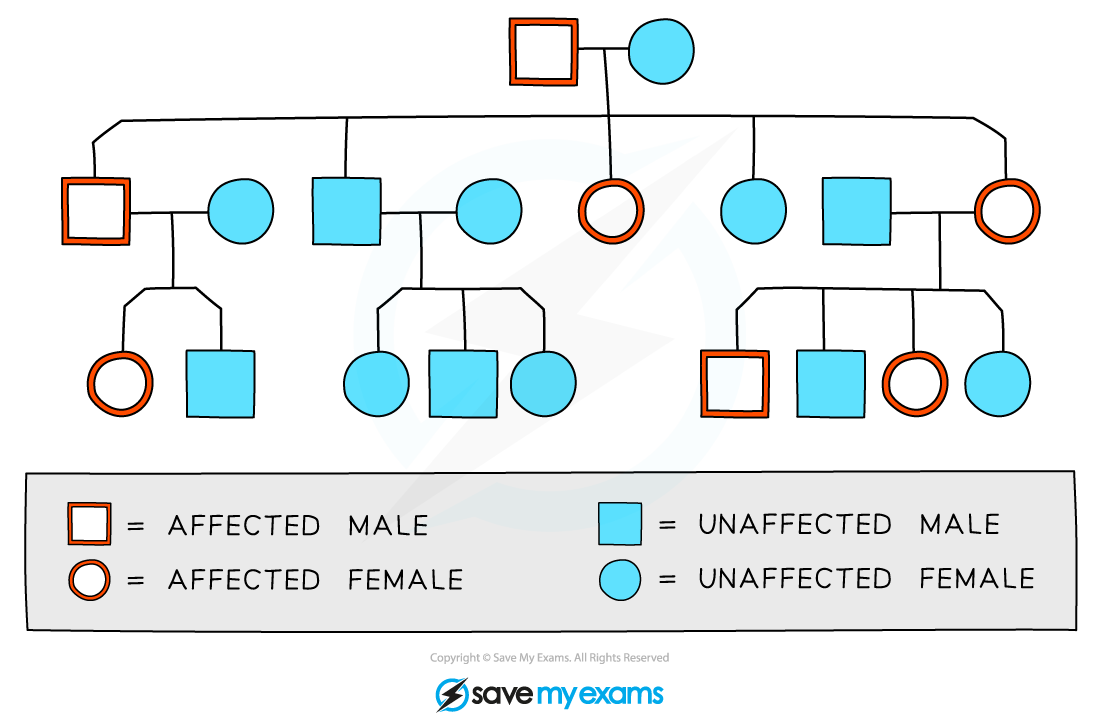
The family pedigree above shows the following:
Both males and females are affected by the trait in question
Every generation has affected individuals
The eldest son in the second generation is affected
There is one family group that has no affected parents or children
The diagram above does not contain enough information to show
whether the trait is caused by a dominant or recessive allele
the genotypes of the individuals involved
Worked Example
The pedigree diagram below traces the inheritance of albinism through several generations. Albinism affects the production of the pigment melanin leading to lighter hair, skin and eyes.

Using the pedigree chart, deduce and explain the following:
The type of allele that causes albinism
The genotype of individuals 9 and 7
The possible genotypes of 10 and 11
Answers:
Question 1
Albinism is caused by a recessive allele
Person number 9 is an affected individual despite parents 6 and 7 being unaffected; 6 and 7 must both be carriers of the recessive allele and 9 has inherited one recessive allele from each parent
Question 2
The genotype of person 9 must be homozygous recessive (aa) and the genotype of 7 must be heterozygous (Aa)
Person 9 is an affected individual with albinism; as this is determined by the recessive allele they must have two copies of the albinism allele
Person 7 must be heterozygous as he does not have albinism but has passed on the recessive allele to person 9
Question 3
The possible genotypes of 10 and 11 are heterozygous (Aa) or homozygous dominant (AA)
They are both unaffected individuals so must possess at least one dominant allele (A), however, it is possible that they each might have inherited a recessive allele (a) from one parent (both parents must have a copy of the recessive allele in order for person 9 to have albinism)
Examiner Tips and Tricks
When answering questions about pedigree charts for genetic diseases, it is always useful to remember which phenotype is caused by the homozygous recessive genotype. You can write these genotypes onto your chart and it will give you a good starting point for working out the possible genotypes of the rest of the individuals in the chart.

You've read 0 of your 5 free study guides this week
Unlock more, it's free!
Did this page help you?
