Distributions (AQA A Level Psychology): Revision Note
Syllabus Edition
First teaching 2017
Last exams 2026
Exam code: 7182

Normal distribution
Distribution in psychology refers to the spread of data around the mean for a specific sample or population
Researchers in psychology are interested in the extent to which one data set varies from the mean
Do most scores cluster around the mean?
Are the scores spread symmetrically?
Are they skewed?
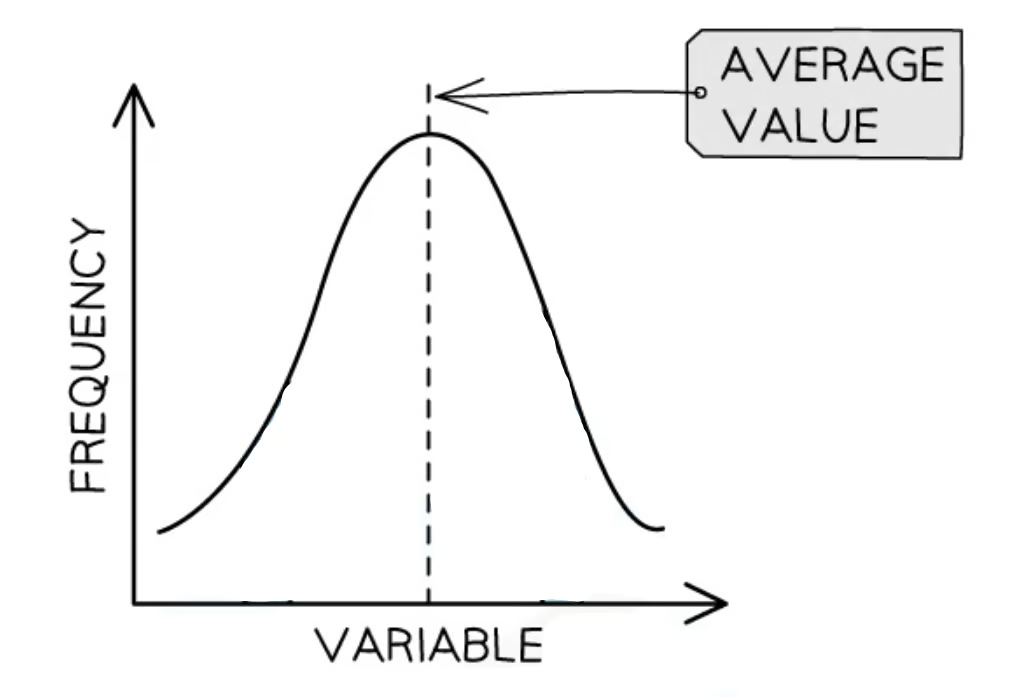
A normal distribution is symmetrical around the mean, with most scores being close to it, showing a peak in the middle where the mean value is located
The shape of a normal distribution is known as the ‘bell curve’ as the measurement outline looks like a bell
Most scores (when the data is normally distributed) will fall within the central part of the bell curve
Extreme outliers will fall within the 'tail ends' of the curve (small scores on the extreme left, high scores on the extreme right of the curve)
The tail ends never actually touch the x-axis as there is no assumption as to there being one, final extreme high or low score
Examples of data that is normally distributed are height, weight, shoe size
The normal distribution can be used to test for signs of deviance from the norm e.g.
people who score beyond two standard deviations of the mean may rank as having an extremely high or low scoring, such as
IQ
scoring high on a scale to indicate postpartum depression
scoring low on an empathy scale which tests for psychopathy
Skewed distributions
In a perfect normal distribution the mean, mode and median all appear at the peak of the curve i.e. they have similar values
Scores to the left of the peak represent people who have scored less than the mean
Scores to the right of the peak represent people who have scored more than the mean
There are some behaviours/conditions/test scores which do not fit neatly into a normal distribution, this represents skewed distributions
A skewed distribution describes a graph curve where one tail is longer than the other
There is asymmetry in the graph curve, it is not bell-shaped
The two halves of the distribution do not mirror each other because the data is not distributed equally on both sides of the distribution’s peak
The mean is the measure of central tendency which is most affected by skewed distributions as it takes all scores in the data set into account
Positive skew
A positive skew is one in which most of the values are found towards the left side of the graph, giving a long tail on the right

Examples of positively skewed data
The age at which people take on their first job
In a population aged 16-80, most scores will likely be at the lower end of the measure
A very difficult maths test might see most students score at the lower end of the mark scale
As the test is so difficult there are very few in the class who scored towards the right end of the tail (where the high scores reside)
Negative skew
A negative skew is one in which most of the values are found towards the right side of the graph, giving a long tail on the left

Examples of negatively skewed data
The age at which people retire
In a population aged 16-80 most scores will likely be at the higher end of the scale
A very easy maths test might see most students score at the higher end of the mark scale
As the test is so easy there are very few in the class who scored towards the left end of the tail (where the low scores reside)
Worked Example
Here is an example of a question you might be asked on this topic for AO1.
AO1: You need to demonstrate knowledge and understanding of key concepts, ideas, theories and research.
Q. Which of the following sets of data is normally distributed?
Select one answer only.
a) mean = 45 median = 44 mode = 43
b) mean = 48 median = 40 mode = 46
c) mean = 47 median = 47 mode = 47
d) mean = 49 median = 46 mode = 44
[1 mark]
Model answer:
The correct answer is c) mean = 47 median = 47 mode = 47; [1 mark]

Unlock more, it's free!
Join the 100,000+ Students that ❤️ Save My Exams
the (exam) results speak for themselves:

Was this revision note helpful?