Correlations (AQA A Level Psychology): Revision Note
Syllabus Edition
First teaching 2017
Last exams 2026
Exam code: 7182

Types of correlation
A correlation is not a research method as such, rather it is an analysis of the relationship between co-variables
In correlational research, the variables are not manipulated (there is no IV), instead two co-variables are measured and compared to look for a relationship
One or both of the co-variables could be pre-existing e.g.
school attendance measured as days present at school in Year 11 (co-variable) and number of GCSEs achieved (co-variable)
average temperature in August (co-variable) and number of arrests made for violent behaviour in August in one town
One or both of the co-variables could be measured for the research itself e.g.
number of arguments with your partner in a month (co-variable) and self-reported stress levels for the same month (co-variable)
average number of hours sleep in one week (co-variable) and number of cups of caffeinated beverages consumed in the same week (co-variable)
A correlation uses two scores e.g. number of cups of caffeine and the number of hours of sleep
In the case of self-reported data, there are two scores per participant e.g.
an average of 4 hours of sleep per night correlated with 58 cups of caffeine consumed in a week
In the case of pre-existing data, the researcher would simply go to the records e.g.
Student X was present for 188 days in Year 11 - they achieved 10 GCSEs
Each participant has two scores which the researcher then calculates to look for a relationship e.g.
is there a relationship between the number of cups of caffeine consumed in one week and the number of hours of sleep achieved in the same week?
The score for one co-variable and the score for the other co-variable are plotted as one point (usually represented as an 'x') on a scattergraph
Scattergraphs show one of three outcomes
Positive correlation
One co-variable increases as the other increases (but not necessarily at the same rate) e.g. calories consumed and weight gained
Negative correlation
One co-variable increases while the other co-variable decreases (but not necessarily at the same rate) e.g. hours spent sitting down and level of fitness
Zero correlation
There is no relationship between the co-variables e.g. hair colour and IQ

Analysing the relationship between co-variables can be done by
visually 'eyeballing' the scattergraph to see the direction of the relationship (positive, negative or none at all)
calculating the correlation coefficient which is expressed as a numerical value
The correlation coefficient represents both the direction and the strength of the relationship between the co-variables, expressed as a value between -1 and +1
A perfect positive correlation would be expressed as +1
A perfect negative correlation would be expressed as -1
No relationship would be expressed as 0
Both positive and negative coefficient correlations can be described as weak, moderate or strong e.g.
a correlation coefficient of 0.03 is a weak positive correlation
a correlation coefficient of -0.9 is a strong negative correlation
a correlation coefficient of -0.5 is a moderate negative correlation
Evaluation of types of correlation
The data may be easily available for researchers to quickly analyse
This is a strength as it enables the researcher to access large amounts of data that would otherwise be impossible to gather if they tried to amass this from scratch
Large amounts of quantitative data mean that the research is high in reliability
Correlations allow researchers to make predictions as to the relationship between co-variables e.g.
Knowing that there is a relationship between school absence and GCSE results could be used to identify students at risk and to implement interventions to help them achieve their potential
Limitations
Extraneous factors connected to one or both co-variables may affect the result and lead to invalid conclusions being made e.g.
number of days absence from school may be due to illness rather than to choice
a low GCSE score may be due to a high turnover of teachers in one school rather than to student absence
Correlations work well for linear relationships e.g. height and shoe size
They are less successful when dealing with non-linear relationships e.g. number of hours worked and level of happiness
This limits the type of data that can be analysed and conclusion drawn
The difference between correlations & experiments
Experiments involve deliberate manipulation an independent variable (IV) to measure the impact on the dependent variable (DV)
This means that the researcher works towards establishing cause-effect e.g.
does a 30-second distraction task (IV) affect the number of items recalled from a list (DV)?
An experiment measures the difference in participant performance depending on how the researcher has manipulated the IV (condition 1 compared to condition 2)
With a correlation, there is no researcher manipulation of either co-variable
Both co-variables may have a bi-directional influence on each other
A correlation measures the strength and direction of a relationship between co-variables compared to an experiment which measures a difference in conditions
Correlations cannot establish cause-effect, even when results show a strong positive correlation
One variable may impact the other but not in a linear fashion e.g.
number of arguments with your partner in one month may lead to higher stress levels but higher stress levels are also likely to lead to more arguments
Thus, it is difficult to know which (if any) of the two co-variables initially triggered the other or if some other factor is the reason for the arguments/stress
Worked Example
Here is an example of a question you might be asked on this topic - for AO2.
AO2: You need to apply your knowledge and understanding, usually referring to the ‘stem’ in order to do so (the stem is the example given before the question)
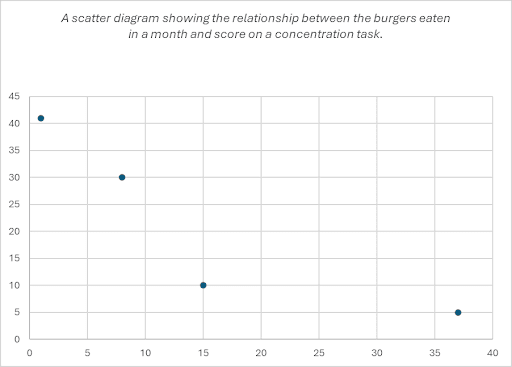
Q. Dr Mcdonald is interested in a possible relationship between burgers consumed in a month and concentration on a task. He asks participants to report how many burgers they have consumed in the previous month then he sets them a timed task (identifying the number of times the letter ‘b’ appears in a piece of text). The scores per co-variable are shown in the table below:
Participant | Number of burgers eaten | Score on concentration task |
A | 15 | 10 |
B | 1 | 41 |
C | 37 | 5 |
D | 8 | 30 |
E | 22 | 17 |
Sketch a scatter graph of the results shown in the table above.
Provide a suitable title and labels for your diagram.
[4 marks]
Model answer:
Identify and label the axes:
X axis = Number of burgers eaten
Y axis = Score on a concentration task
[1 mark]
Identify an appropriate scale:
X axis = 0-40
Y axis = 0-45
[1 mark]
Plot the results:
Plot one piece of data for each participant
e.g. for participant A:
find 15 on the X axis and 10 on the Y axis, then plot with an "X" or filled in circle
[1 mark]
Write a suitable title:
A scattergraph showing the relationship between the burgers eaten in a month and score on a concentration task
[1 mark]
Number of burgers eaten = X axis Score on a concentration task = Y axis |
NOTE: If the graph is not a scatter graph, you will be awarded 0 marks

Unlock more, it's free!
Join the 100,000+ Students that ❤️ Save My Exams
the (exam) results speak for themselves:

Was this revision note helpful?
Build on this topic