Magnetic Flux Density (OCR A Level Physics): Revision Note
Exam code: H556
Determining Magnetic Flux Density
Aims of the Experiment
The overall aim of this experiment is to calculate the magnetic flux density of a magnet
This is done by measuring the force on a current-carrying wire placed perpendicular to the field
Variables
Independent variable = Current, I
Dependent variable = mass, m
Control variables:
Length of wire, L
Magnetic Flux density, B
Potential difference of the power supply
Equipment List
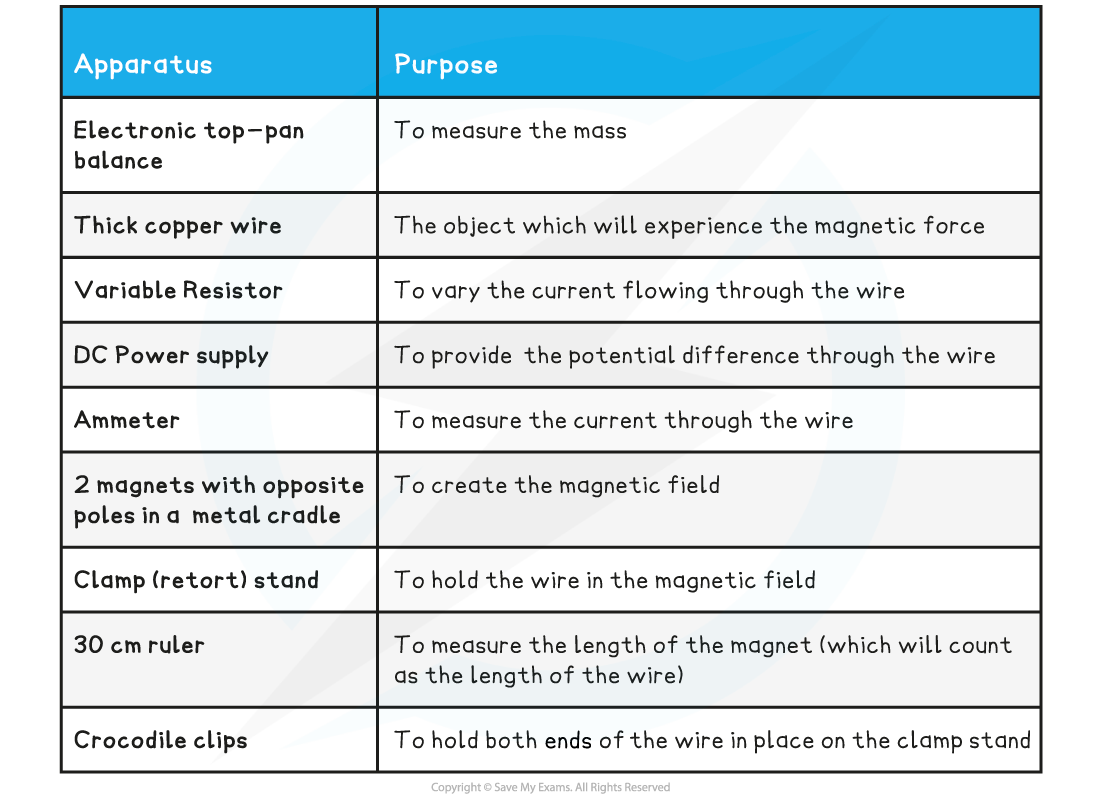
Resolution of measuring equipment:
Ammeter = 0.01 A
Variable resistor = 0.01 Ω
Top-pan balance = 0.01 g
Ruler = 1 mm
Method
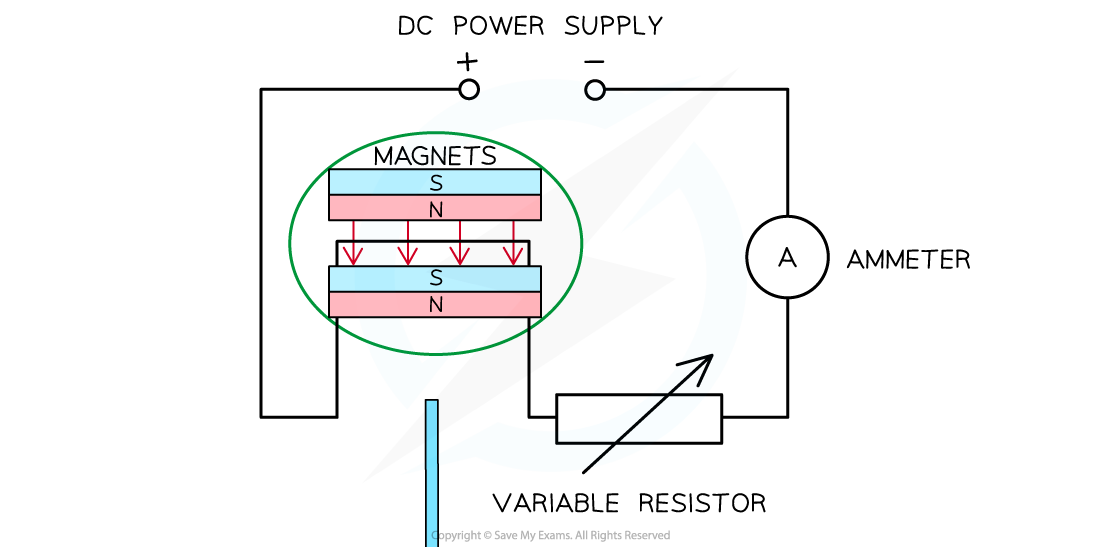
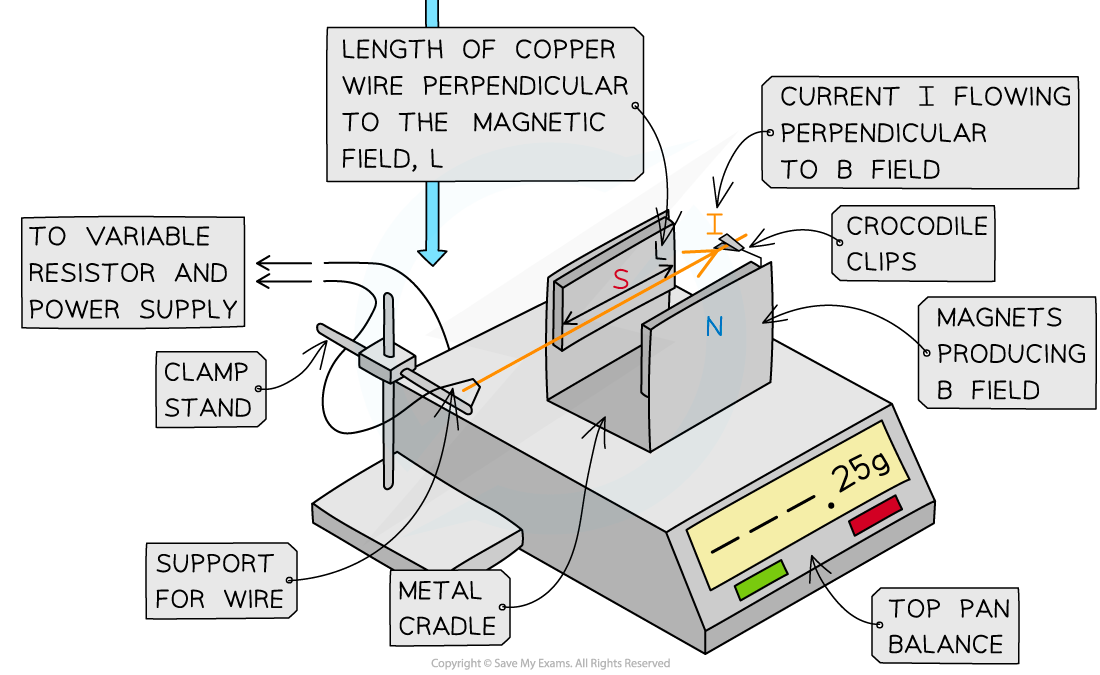
Set up the apparatus as shown above
Make sure the wire is completely perpendicular in between the magnets
Measure the length of one of the magnets using the 30 cm ruler
This will be the length of the wire L in the magnetic field
Once the magnet is placed on the top-pan balance, and whilst there is no current in the wire, reset the top-pan balance to 0 g
Adjust the resistance of the variable resistor so that a current of 0.5 A flows through the wire as measured on the ammeter
The wire will experience a force upwards.
Due to Newton’s third law, the force pushing downwards will be the mass on the balance.
This movement will be very small, so it may not be completely visible
Record the mass on the top-pan balance from this current
Repeat the procedure by increasing the current in intervals of 0.5 A between 8−10 readings for the current (not exceeding 6 A)
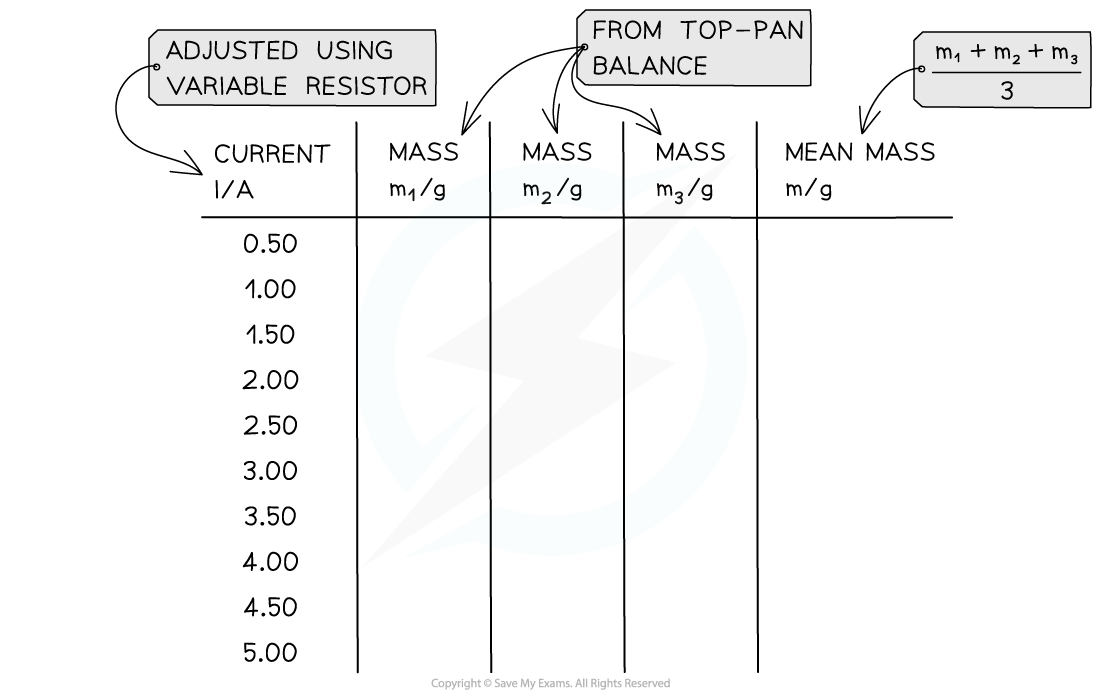
Repeat the experiment at least 3 times, and calculate the mean of the mass readings
An example table might look like this:
Analysing the Results
The magnetic force on the wire is:
F = BIL
Where:
F = magnetic force (N)
B = magnetic flux density (T)
I = current (A)
L = length of the wire (m)
Since F = mg where m is the mass in kilograms, equating these gives:
mg = BIL
Rearranging for m:

Comparing this to the straight-line equation: y = mx + c
y = m (mass)
x = I
m = BL / g
c = 0
Plot a graph of m against I and draw a line of best fit
Calculate the gradient
The magnetic flux density B is:


Evaluating the Experiment
Systematic Errors:
Make sure top-pan balance starts at 0 to avoid a zero error
Random Errors:
Repeat the experiment by turning the magnet in the metal cradle and the wire by 90º
Make sure no high currents pass through the copper wire,
High current will lead to heating, causing the wire’s resistance to increase
Safety Considerations
Keep water or any fluids away from the electrical equipment
Make sure no wires or connections are damaged and contain appropriate fuses to avoid a short circuit or a fire
High currents through the wire will cause it to heat up
Make sure not to touch the wire when current is flowing through it
Worked Example
A student investigates the relationship between the current and the mass produced from the magnetic force on a current-carrying wire. They obtain the following results:
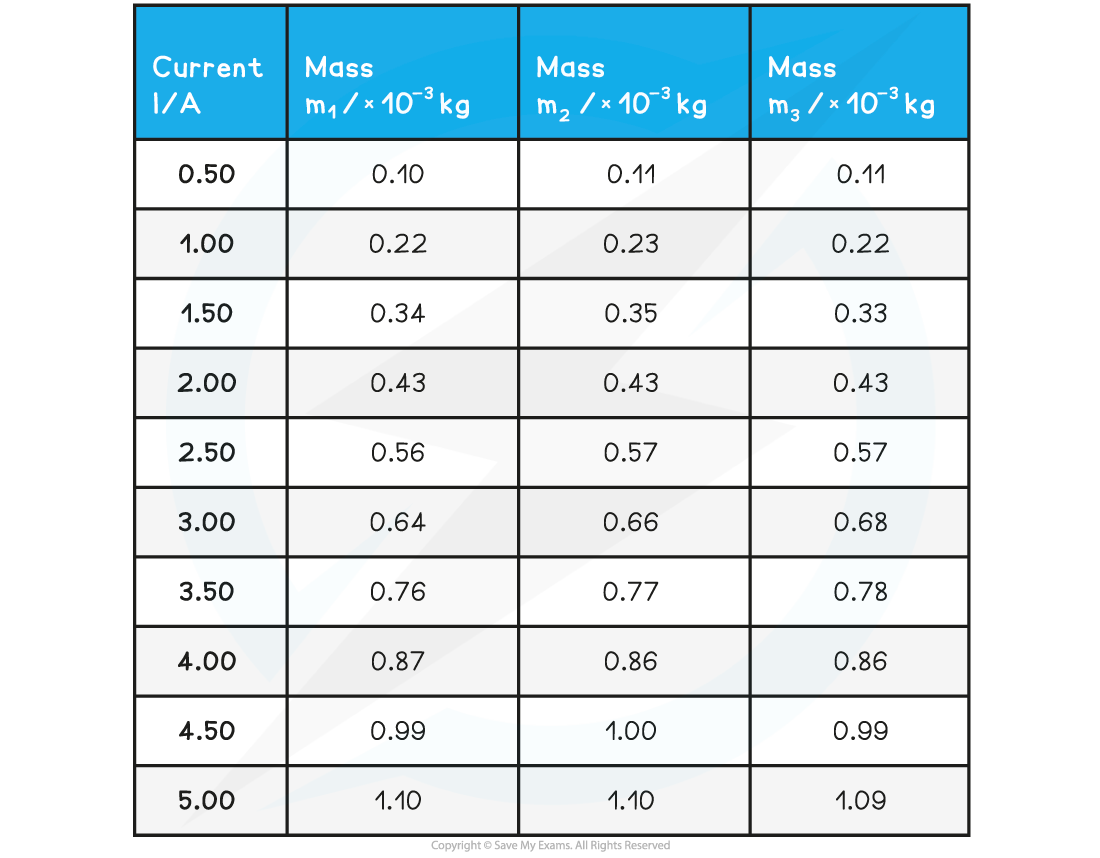
The mean length of the wire in the magnetic field was found to be 0.05 m. Calculate the magnetic flux density of the magnets from the table.
Answer:
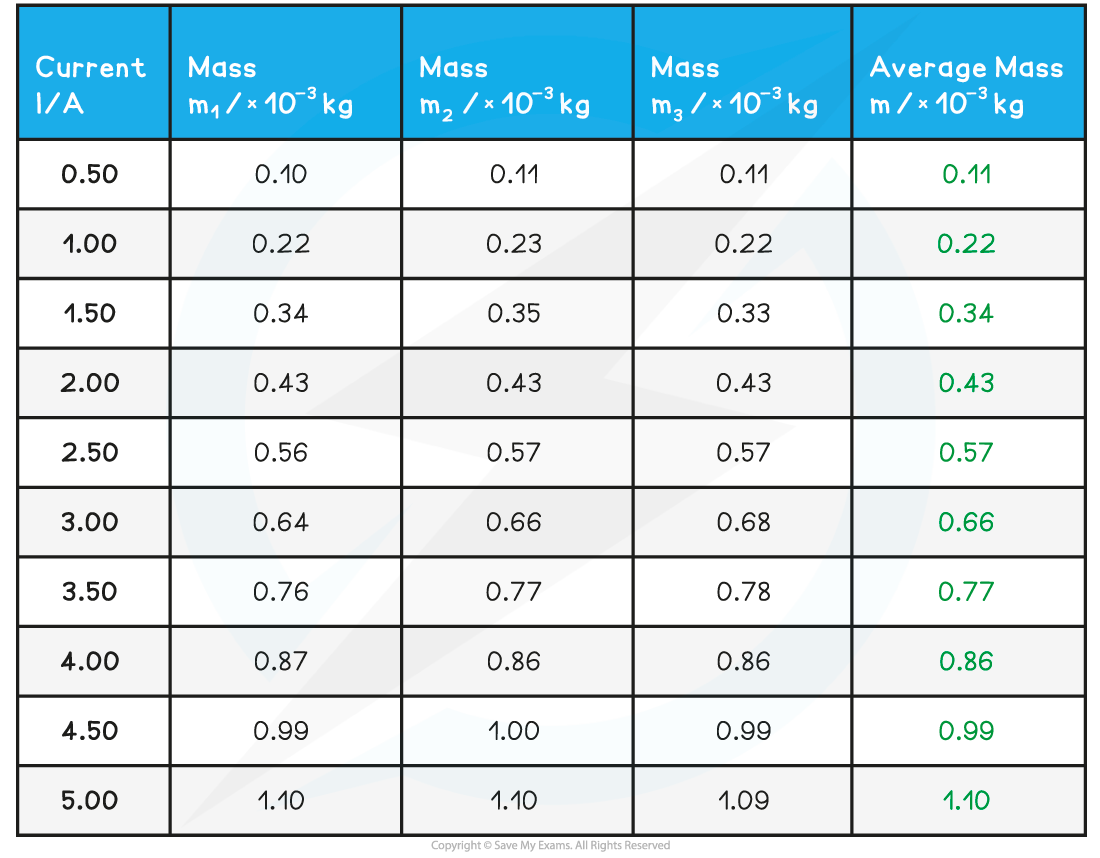
Step 1: Complete the table
Add an extra column ‘Average mass m / × 10−3 kg and calculate this for each mass
Step 2: Plot the graph of average mass m against current I
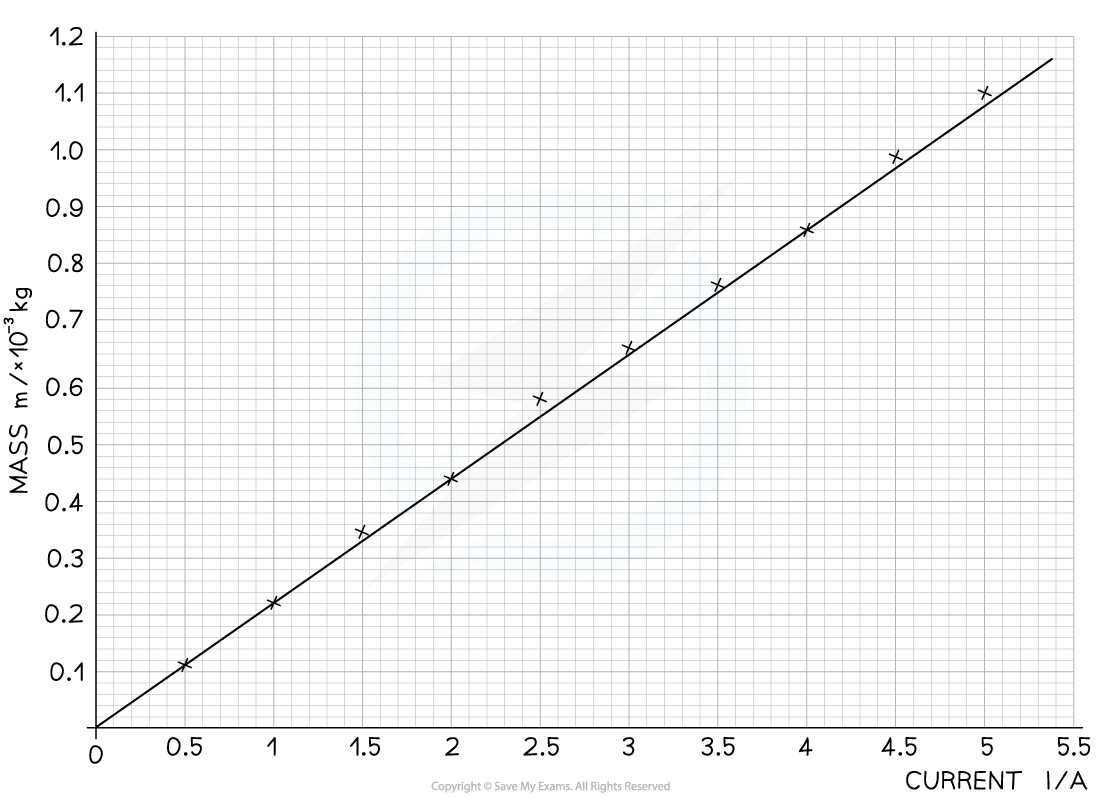
Make sure the axes are properly labelled and the line of best fit is drawn with a ruler
Step 3: Calculate the gradient of the graph
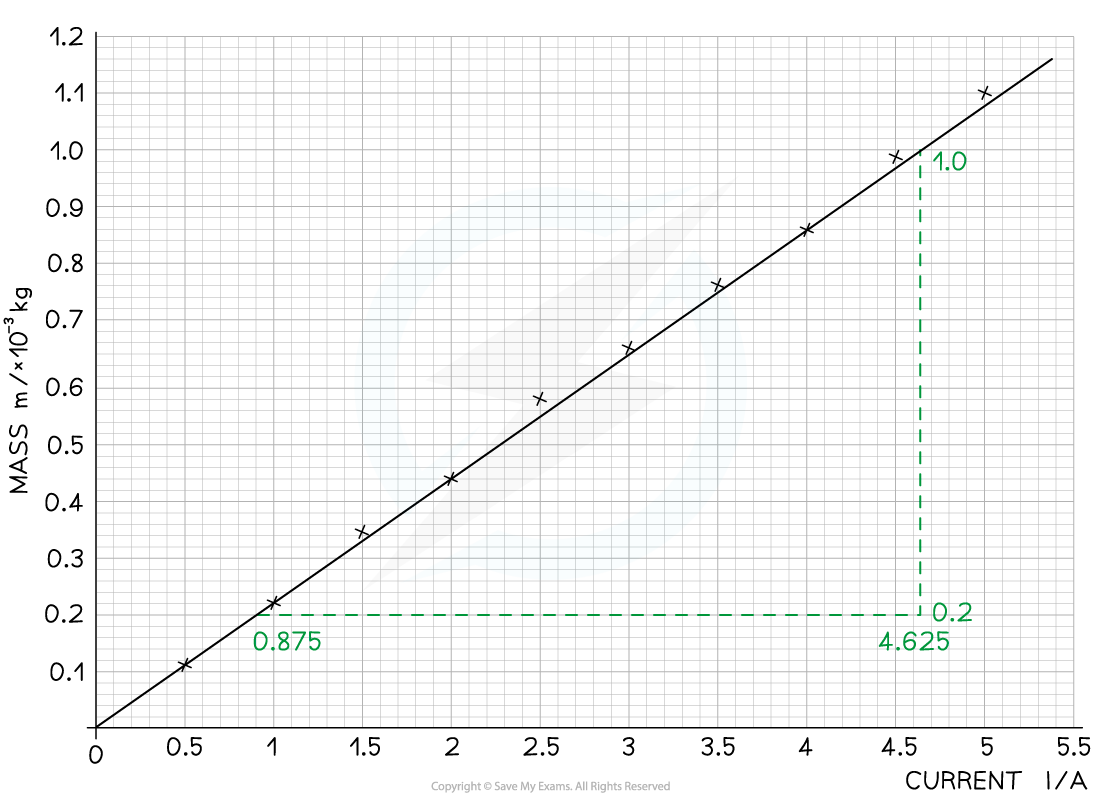
The gradient is calculated by:
Step 4: Calculate the magnetic flux density, B

Unlock more, it's free!
Did this page help you?