Elastic & Plastic Deformation (OCR A Level Physics) : Revision Note
Elastic & Plastic Deformation
Materials can undergo two types of deformations:
Elastic deformation
When the load is removed, the object will return to its original shape
This is shown in the elastic region of the graph
Plastic deformation
The material is permanently deformed
When the load is removed, the object will not return to its original shape or length
This is beyond the elastic limit and is shown in the plastic region of the graph
These regions can be determined from a Force-Extension graph:

Below the elastic limit, the material exhibits elastic behaviour. Above the elastic limit, the material exhibits plastic behaviour
The elastic region is where the extension is proportional to the force applied to the material (straight line)
The plastic region is where the extension is no longer proportional to the force applied to the material (graph starts to curve)
These regions are divided by the elastic limit
The plastic region starts at the elastic limit and ends at the point of fracture (the material breaks)
Brittle & Ductile Materials
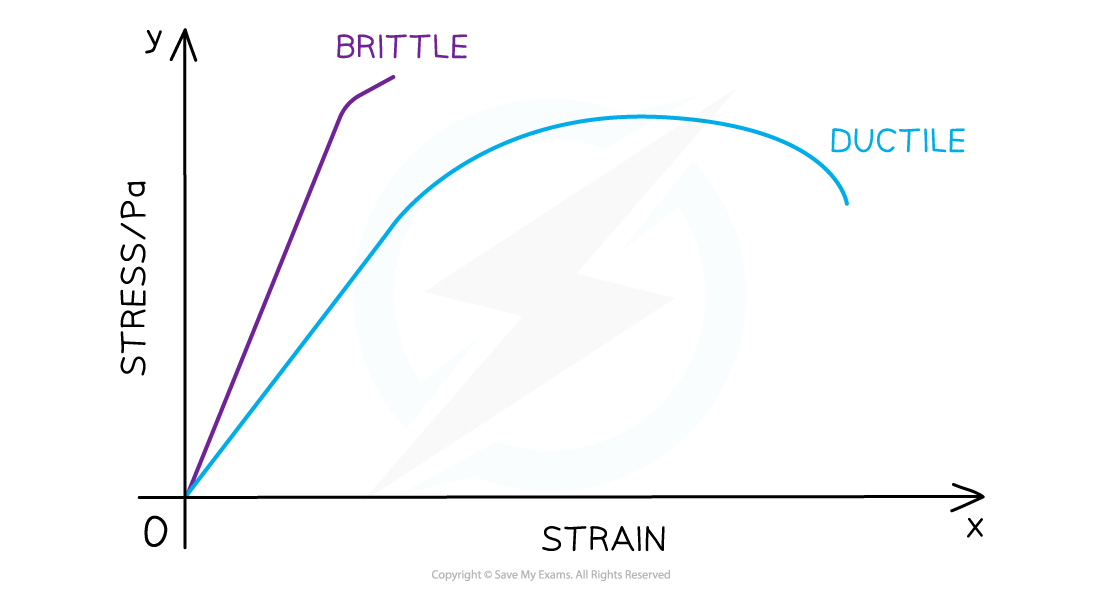
Brittle materials have very little to no plastic region e.g. glass, concrete
The material breaks with little elastic and insignificant plastic deformation
Ductile materials have a larger plastic region e.g. copper
The material stretches into a new shape before breaking

Brittle and ductile materials on a stress-strain graph. These are the same on a force-extension graph too
To identify these materials on a stress-strain or force-extension graph up to their breaking point:
A brittle material is represented by a straight line through the origins with no or negligible curved region
A ductile material is represented with a straight line through the origin then curving towards the x-axis
Worked Example
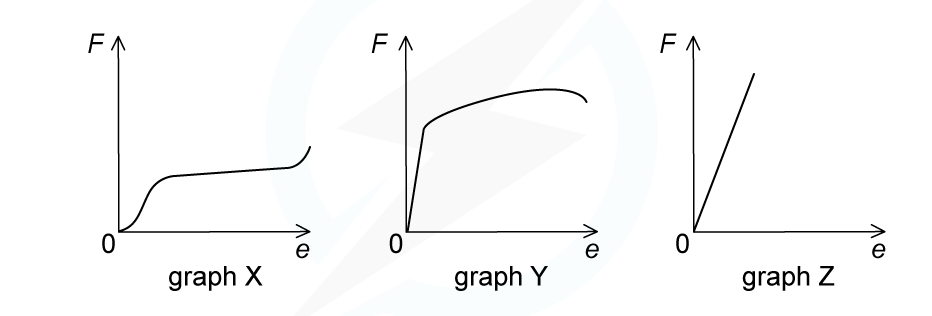
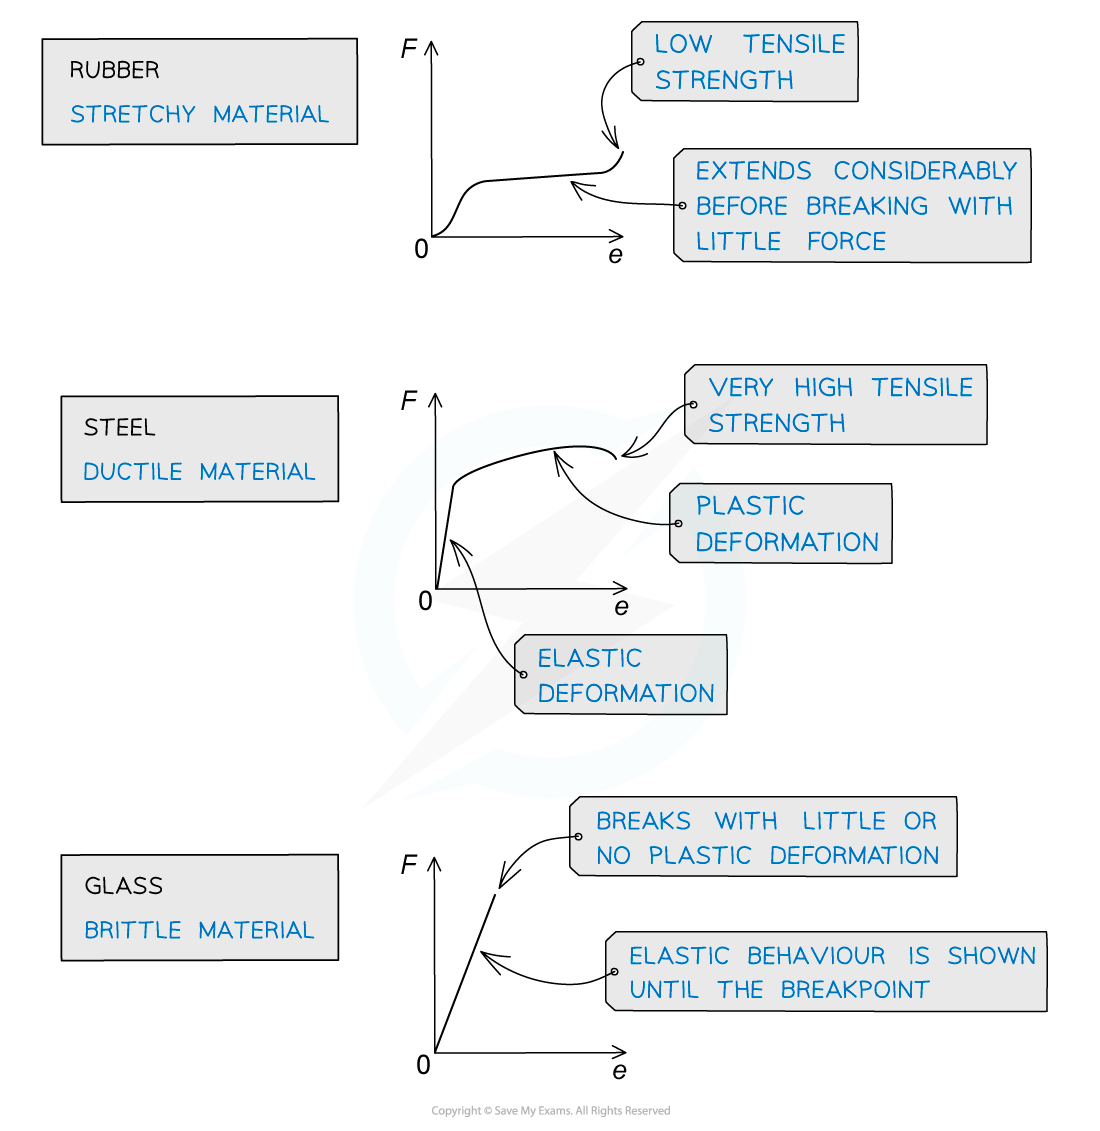
Cylindrical samples of steel, glass and rubber are each subjected to a gradually increasing tensile force F. The extensions e are measured and graphs are plotted as shown below.

Correctly label the graphs with the materials: steel, glass, rubber.
Answer:

Worked Example
A sample of metal wire is subjected to a force which increases as a series of masses are added to the wire. The extension is measured and a force-extension graph of the data is plotted as shown below.

When the wire has been extended to Y, the point just before the wire fractures, the masses are removed one by one and the extension is re-measured.
a) Describe the behaviour of the metal at point X.
b) On the graph, sketch the result obtained after the masses are removed and explain why the graph has this shape.
Answer:
Part (a)
At point X:
The graph is a straight line at point X
Therefore, the force and extension are directly proportional
Point X is not beyond the elastic limit
So the metal is behaving elastically
Part (b)

Plastic deformation has occurred which results in permanent extension
As the load is decreased, the bonds in the metal are re-aligned hence the y-intercept is now not through the origin
The gradient remains the same because the intermolecular forces (the forces between bonds) are identical to before
Examiner Tips and Tricks
Avoid describing plastic deformation as 'does not obey Hooke's law'. Although this is mostly correct, it should be described as the material being permanently deformed

You've read 0 of your 5 free revision notes this week
Sign up now. It’s free!
Did this page help you?
