Force-Extension Graphs (OCR A Level Physics) : Revision Note
Force-Extension Graphs
The way a material responds to a given force can be shown on a force-extension graph
Every material will have a unique force-extension graph depending on how brittle or ductile it is
A material may obey Hooke's Law up to a point
This is shown on its force-extension graph by a straight line through the origin
As more force is added, the graph may start to curve slightly

The Hooke's Law region of a force-extension graph is a straight line. The spring constant is the gradient of that region
The key features of the graph are:
The limit of proportionality
The point beyond which Hooke's law is no longer true when stretching a material i.e. the extension is no longer proportional to the applied force
The point is identified on the graph where the line starts to curve (flattens out)
The force constant k is the force per unit extension up to the limit of proportionality, after which the material will not obey Hooke’s law
This is the gradient of the straight part of the graph
The graph might also include the elastic limit, this is:
The maximum amount a material can be stretched and still return to its original length (above which the material will no longer be elastic)
This point is always after the limit of proportionality
Therefore, k is the gradient of the linear part of the graph ie. where Hooke's Law is obeyed
Metal Wire
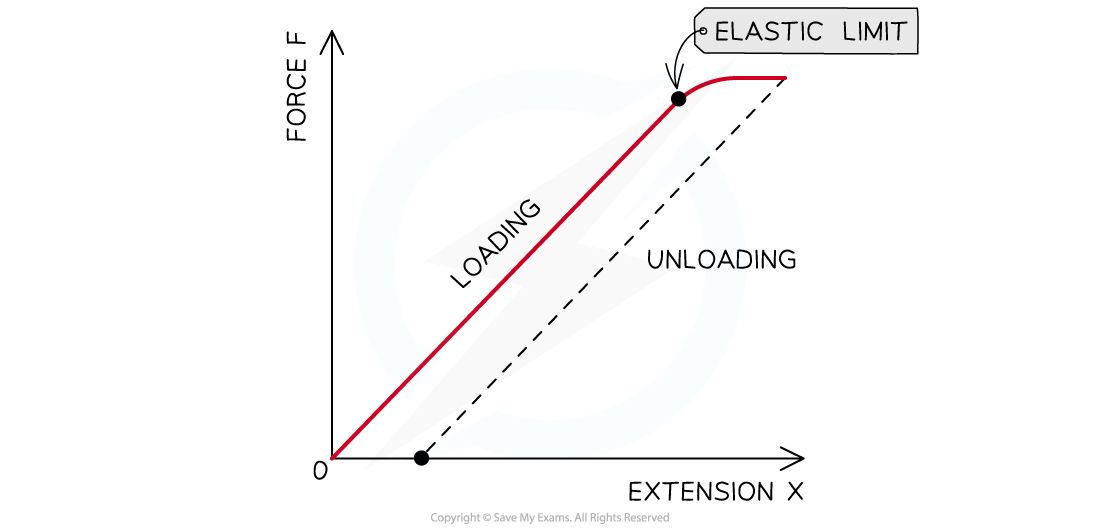
A metal wire obeys Hooke’s law and exhibits elastic deformation until its elastic limit
Up to this point, the loading curve is the same as the unloading curve
Beyond this point, it experiences plastic deformation
The unloading curve has the same gradient as the loading curve
The plastic deformation causes a permanent extension of the wire
Rubber
Rubber is an elastic material, so it does not experience plastic deformation, nor does it obey Hooke’s law
The area between the loading and unloading curves is known as a hysteresis loop
This area represents the work done in stretching the material
This energy is transferred to thermal energy when the force is removed
An example of a force-extension graph for such a material is:
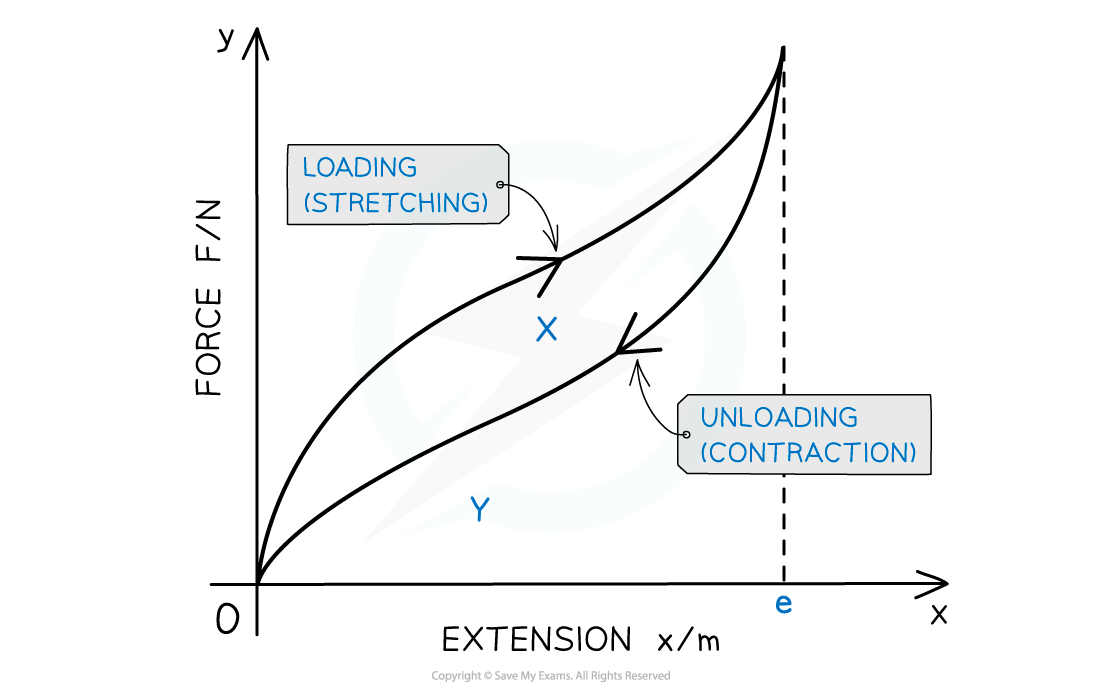
The curve for contraction is always below the curve for stretching
The area X represents the net work done or the thermal energy dissipated in the material
The area X + Y is the minimum energy required to stretch the material to extension e
Polymeric Materials (Polyethene)

Polyethene is a common polymer or polymeric material
It does not obey Hooke’s law and experiences plastic deformation when any force is applied to it
This makes it very easy to stretch into new shapes, but difficult to return to its original shape
Investigating Force-Extension Characteristics
Aims of the Experiment
The aim of this experiment is to investigate the relationship between force and extension for three materials: metal springs, rubber bands and polythene strips
Variables
Independent variable = Force / Load (N)
Dependent variable = Extension (m)
Equipment List
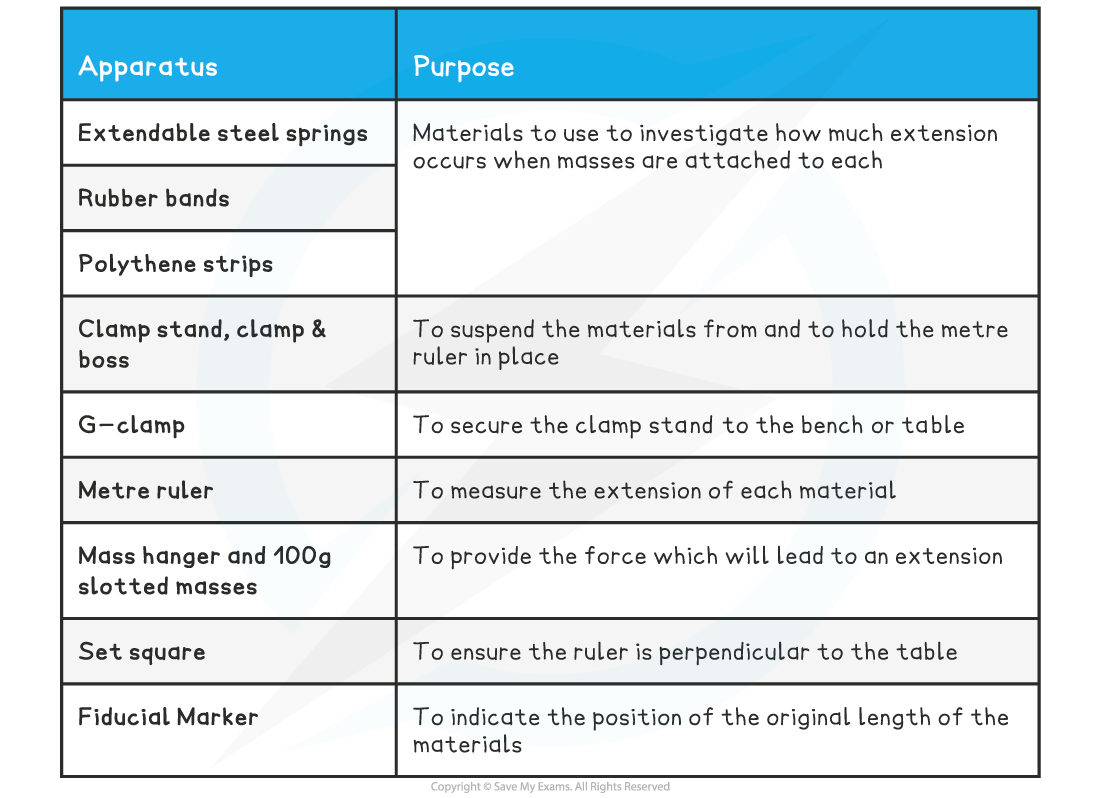
Resolution of measuring equipment:
Metre ruler = 1 mm
Method
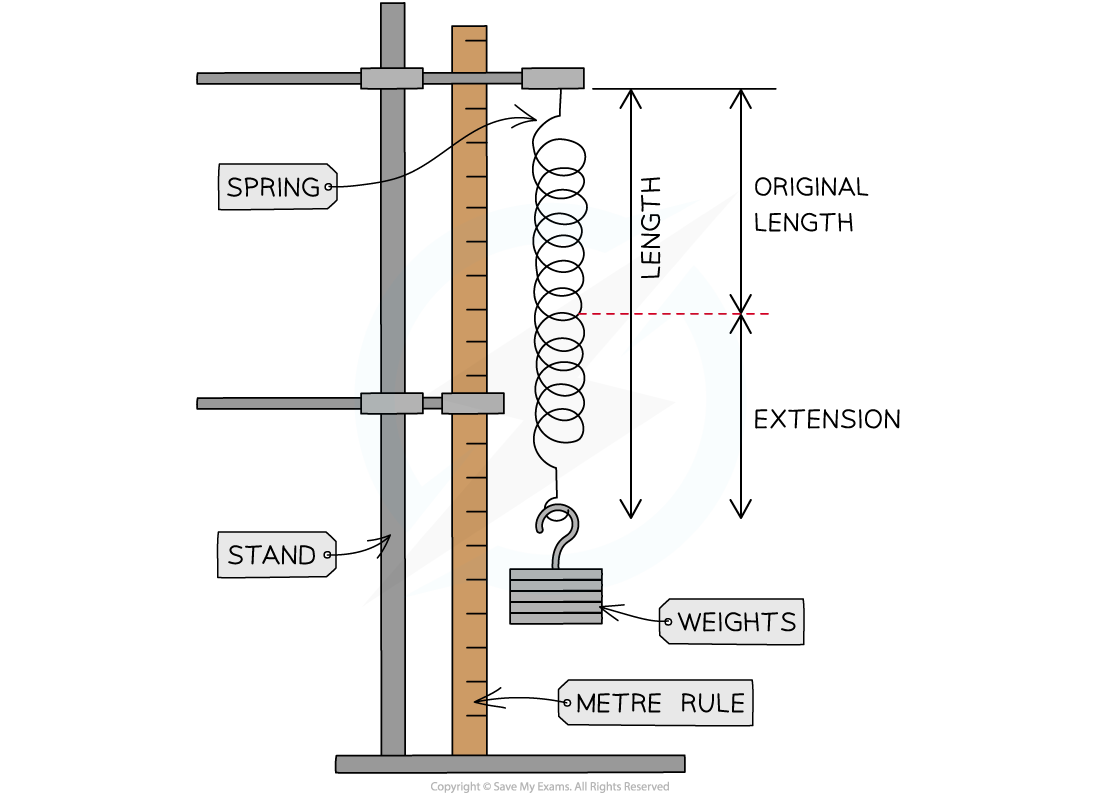
Experimental set-up for investigating force-extension characteristics of a metal spring
Set up the apparatus as shown in the diagram. Hang a spring from the clamp and boss and secure it so that it will not fall off
Secure the metre rule vertically to the clamp, using the set square to ensure it is straight and place it adjacent to the spring
Record the metre rule reading at the bottom of the spring and place a fiducial marker on this point. This is its original length before any masses are hanging from it (no load)
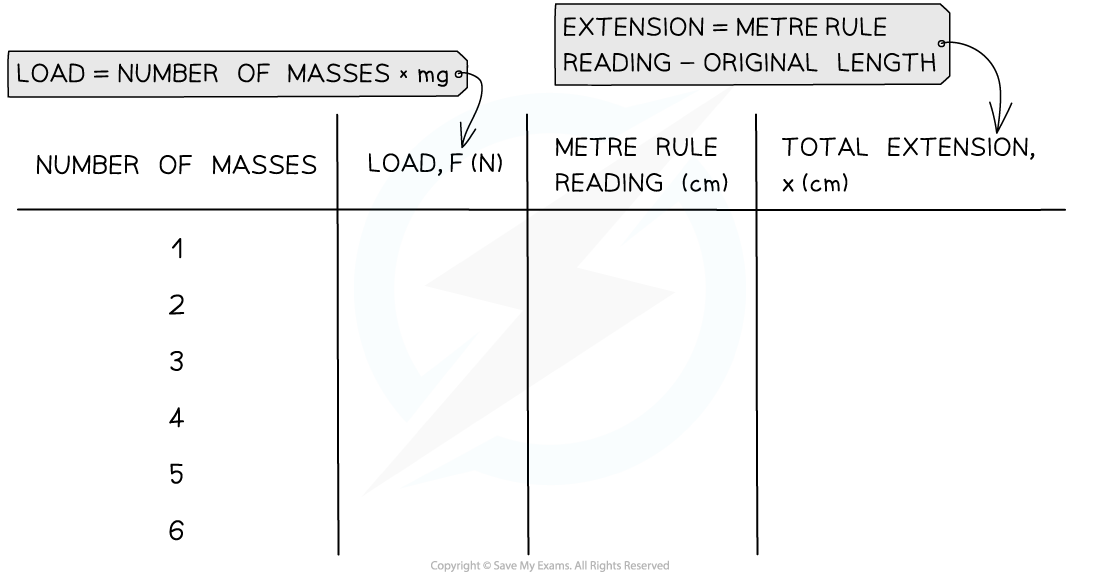
Hang a mass hanger from the bottom of the spring. Record the new metre rule reading, the number of masses and the extension of the spring
Add another mass. Record the new metre rule reading, the number of masses, and the total extension of the spring from its original length
Repeat this until after the spring has become permanently stretched
Repeat the experiment for the rubber band and the polythene strip
An example table might look like this:
Analysing the Results
According to Hooke’s Law:
F = kx
Comparing this to the equation of a straight-line, y = mx
y = Load / force, F
x = Extension, x
Gradient = Force constant, k
Plot a graph of the load applied on the horizontal axis and the extension of the spring on the vertical axis and draw a line of best fit
The gradient of the linear part will be equal to the force constant, k
Make sure to measure the gradient of the straight section of the line only, as this is within the elastic limit of the material
Evaluating the Experiment
Systematic errors:
Reduce parallax error by reading the metre ruler at eye-level
Use a set square to make sure the ruler is straight and perpendicular to the bench or table
Use a fiducial marker to mark the original position of the material
Random errors:
Ensure the material is stationary before a reading is made
Repeat the experiment several times and calculate an average
Safety Precautions
When stretching materials, there is a danger that they may snap under the high tension
Eye protection should be worn
A box or landing mat should be placed below the hanger to catch the weight if it falls
Make sure to not stand directly underneath the hanging masses

You've read 0 of your 5 free revision notes this week
Sign up now. It’s free!
Did this page help you?
