Limitations of Measurements (Edexcel A Level Physics) : Revision Note

Limitation of Measurements
Types of Error
Measurements of quantities are made with the aim of finding the true value of that quantity
In reality, it is impossible to obtain the true value of any quantity as there will always be a degree of uncertainty
This can be seen when you repeat a measurement and you get different results
An error is the difference between the measurement result and the true value if a true value is thought to exist
This is not a mistake in the measurement
The error can be due to both systematic and random effects and an error of unknown size is a source of uncertainty.
Random and systematic errors are two types of measurement errors that lead to uncertainty
Random error
Random errors cause unpredictable fluctuations in an instrument’s readings as a result of uncontrollable factors, such as environmental conditions
This affects the precision of the measurements taken, causing a wider spread of results about the mean value
To reduce random error:
Repeat measurements several times and calculate an average from them
Systematic error
Systematic errors arise from the use of faulty instruments or from flaws in the experimental method
This type of error is repeated consistently every time the instrument or method are used, which affects the accuracy of all readings obtained
To reduce systematic errors:
Instruments should be recalibrated, or different instruments should be used
Corrections or adjustments should be made to the technique
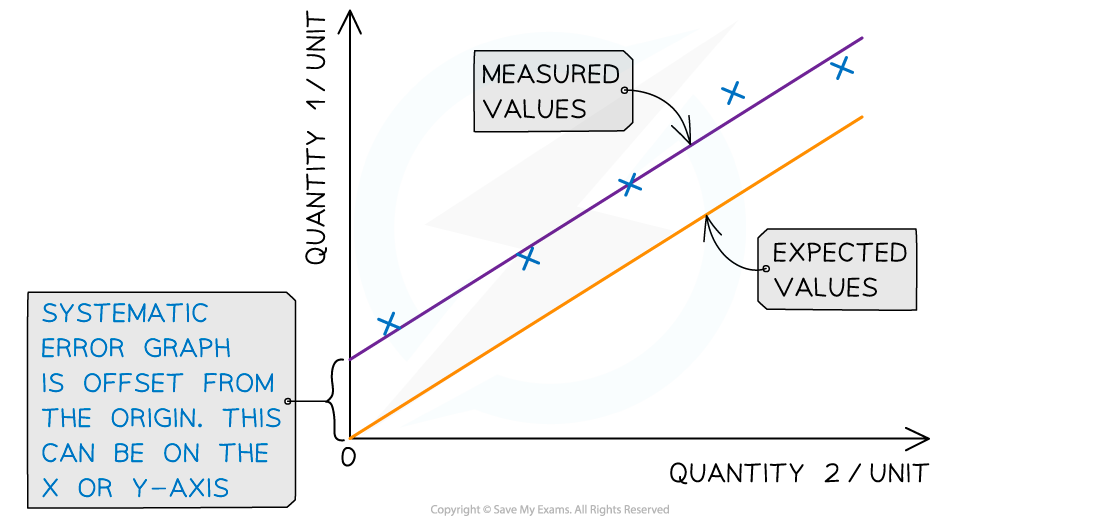
Systematic errors on graphs are shown by the offset of the line from the origin

Representing precision and accuracy on a graph
Zero error
This is a type of systematic error that occurs when an instrument gives a reading when infact the true reading is zero
This introduces a fixed error into the readings which must be accounted for when the results are recorded
Zero error is a type of systematic error since all the values will be displaced by the same amount
Precision vs Accuracy
Precision
Precise measurements denote the closeness of agreement (consistency) between values obtained by repeated measurement
This is influenced only by random effects and can be expressed numerically by measures such as standard deviation.
A measurement is precise if the values ‘cluster’ closely together.
Precise measurements have very little spread about the mean value, in other words, how close the measured values are to each other
If a measurement is repeated several times, it can be described as precise when the values are very similar to, or the same as, each other
The precision of a measurement is reflected in the values recorded - measurements to a greater number of decimal places are said to be more precise than those to a whole number
Accuracy
A measurement is considered accurate if it is close to the true value
It is a quality denoting the closeness of agreement between measurement and true value
It cannot be quantified and is influenced by random and systematic errors
The accuracy can be increased by repeating measurements and finding a mean of the results
Repeating measurements also helps to identify anomalies that can be omitted from the final results

The difference between precise and accurate results
Resolution
Resolution is the smallest change in the quantity being measured
It gives a perceptible change in the reading
It is also the source of uncertainty in a single reading
For example, the resolution of a wristwatch is 1 s, whereas the resolution of a digital stop-clock is typically 10 ms (0.01 s)
In imaging, resolution can also be described as the ability to see two structures as two separate structures rather than as one fuzzy entity

Good resolution and poor resolution in an ultrasound scanner. The good image manages to resolve the two objects into two distinct structures, whereas the poor image shows one fuzzy entity.
Uncertainties
Uncertainty is an estimate of the difference between a measurement reading and the true value
In other words, it is the interval within which the true value can be considered to lie with a given level of confidence or probability
Any measurement will have some uncertainty about the result, this will come from variations in the data obtained and be subject to systematic or random effects
Uncertainties are not the same as errors
Errors can be thought of as issues with equipment or methodology that cause a reading to be different from the true value
The uncertainty is a range of values around a measurement within which the true value is expected to lie, and is an estimate
For example, if the true value of the mass of a box is 950 g, but a systematic error with a balance gives an actual reading of 952 g, the uncertainty is ±2 g
These uncertainties can be represented in a number of ways:
Absolute Uncertainty: where uncertainty is given as a fixed quantity
Fractional Uncertainty: where uncertainty is given as a fraction of the measurement
Percentage Uncertainty: where uncertainty is given as a percentage of the measurement
Percentage uncertainty is defined by the equation:
Percentage uncertainty = ![]() × 100 %
× 100 %
To find uncertainties in different situations:
The uncertainty in a reading: half the smallest division i.e. ± ½ × (resolution)
The uncertainty in a measurement: at least ±1 smallest division
The uncertainty in repeated data: half the range i.e. ± ½ × (largest − smallest value)
The uncertainty in digital readings: ± the last significant digit unless otherwise quoted
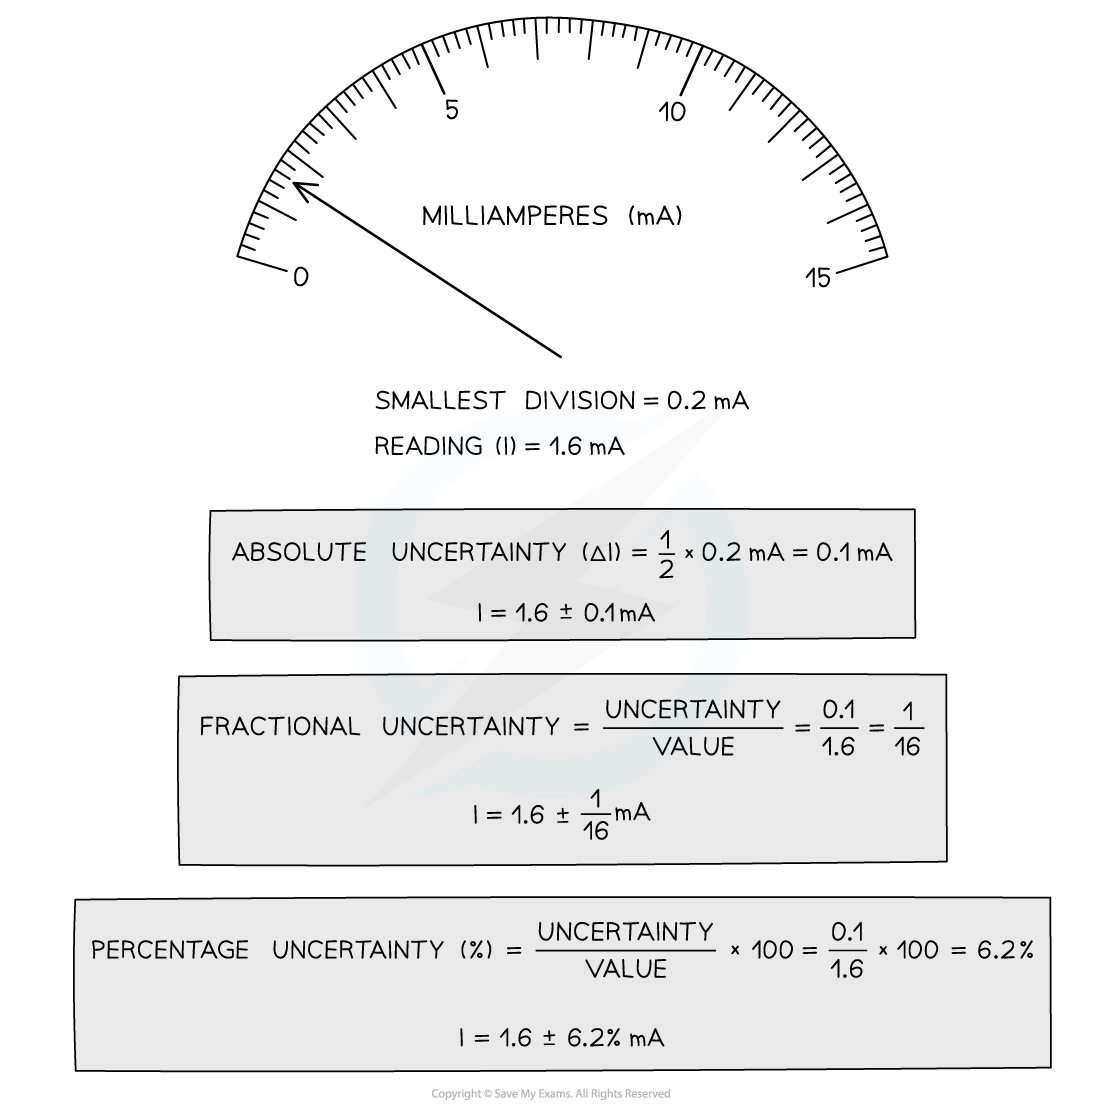
How to calculate absolute, fractional and percentage uncertainty
Always make sure your absolute or percentage uncertainty is to the same number of significant figures as the reading
Combining Uncertainties
When combining uncertainties, the rules are as follows:
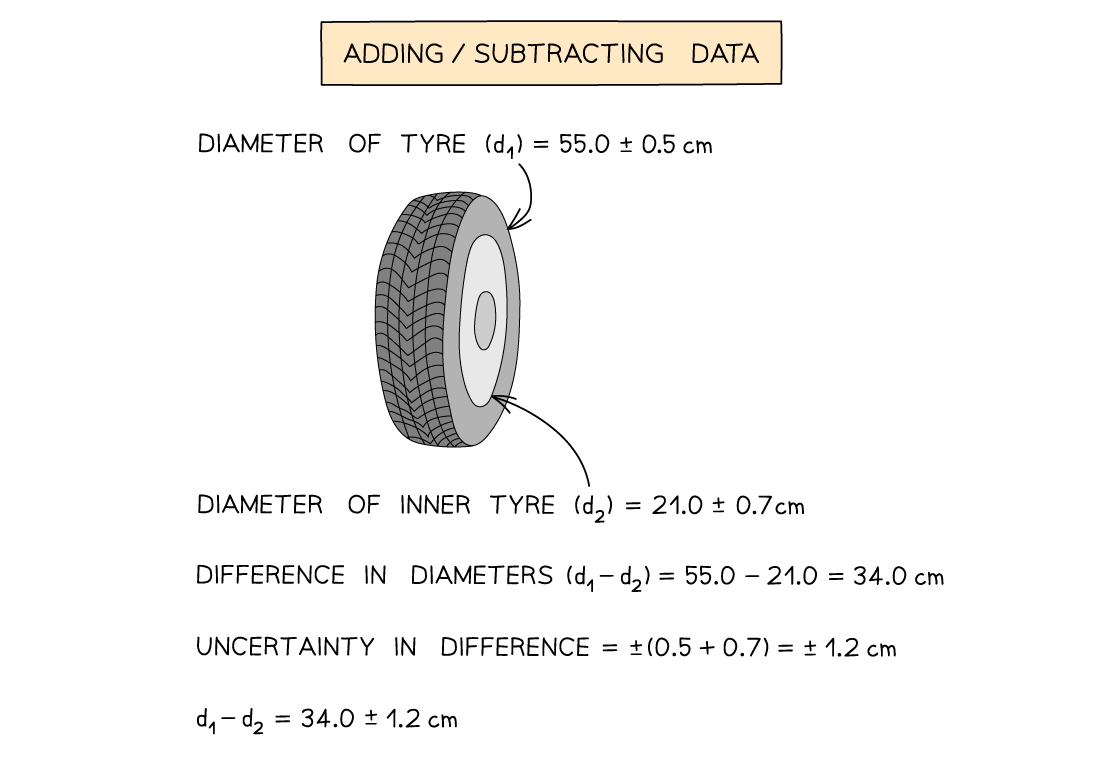
Adding / Subtracting Data
Add together the absolute uncertainties
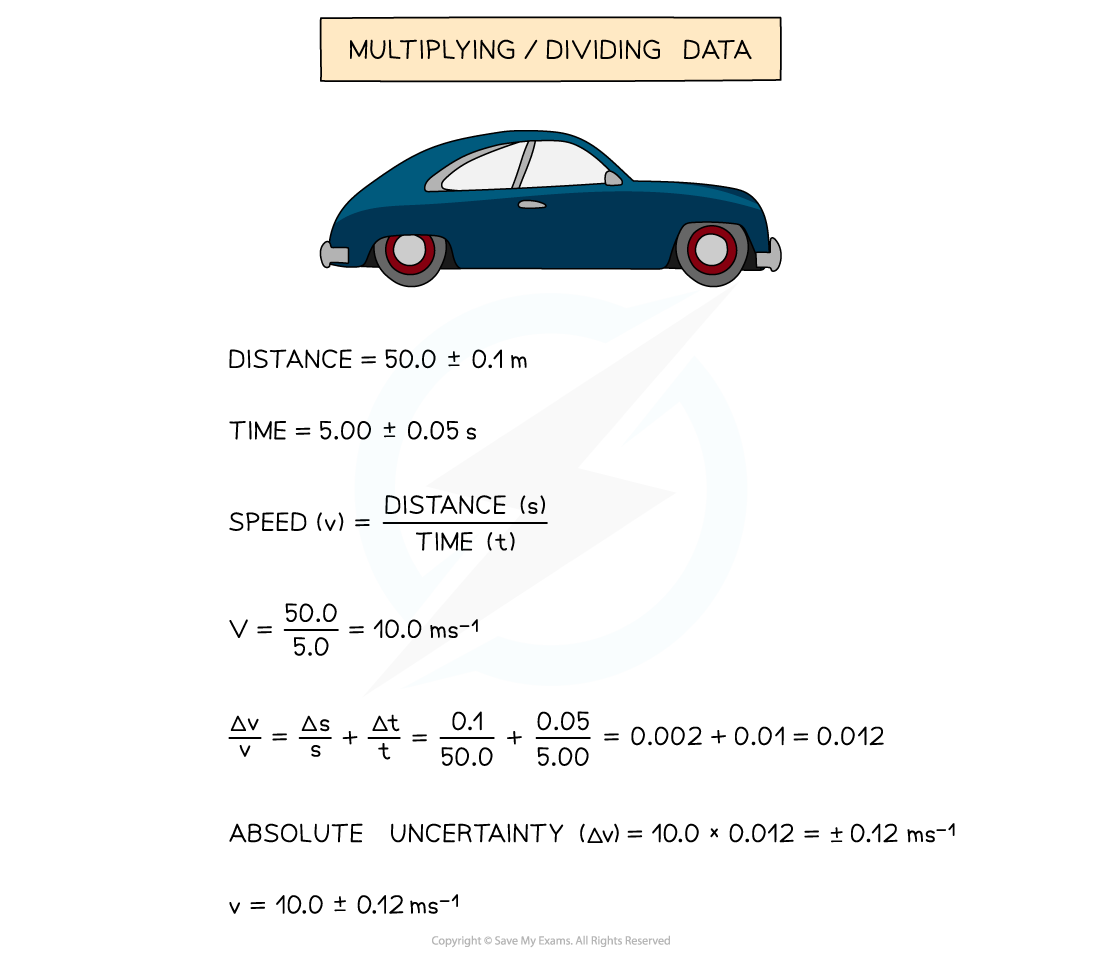
Multiplying / Dividing Data
Add the percentage or fractional uncertainties
Raising to a Power
Multiply the percentage uncertainty by the power

Worked Example
A student achieves the following results in their experiment for the angular frequency, ω of a rotating ball bearing.
0.154, 0.153, 0.159, 0.147, 0.152
Calculate the percentage uncertainty in the mean value of ω.
Answer:
Step 1: Calculate the mean value
mean ω = ![]() = 0.153 rad s–1
= 0.153 rad s–1
Step 2: Calculate half the range (this is the uncertainty for multiple readings)
![]() × (0.159 – 0.147) = 0.006 rad s–1
× (0.159 – 0.147) = 0.006 rad s–1
Step 3: Calculate percentage uncertainty
![]() × 100 % =
× 100 % = ![]() × 100 %
× 100 %
![]() × 100 % = 3.92 %
× 100 % = 3.92 %
Examiner Tips and Tricks
It is a very common mistake to confuse precision with accuracy - measurements can be precise but not accurate if each measurement reading has the same error. Make sure you learn that precision refers to the ability to take multiple readings with an instrument that are close to each other, whereas accuracy is the closeness of those measurements to the true value.
Remember:
Absolute uncertainties have the same units as the quantity
Percentage uncertainties have no units
The uncertainty in numbers and constants, such as π, is taken to be zero

You've read 0 of your 5 free revision notes this week
Sign up now. It’s free!
Did this page help you?