Describing Oscillations (Cambridge (CIE) A Level Physics): Revision Note
Exam code: 9702
Describing oscillations
An oscillation is defined as follows:
The repetitive variation with time t of the displacement x of an object about the equilibrium position (x = 0)
Pendulum oscillation on a displacement-time graph

A pendulum oscillates between A and B. On a displacement-time graph, the oscillating motion of the pendulum is represented by a wave, with an amplitude equal to x0
Equilibrium position (x = 0) is the position when there is no resultant force acting on an object
Displacement (x) of a wave is the distance of a point on the wave from its equilibrium position
It is a vector quantity; it can be positive or negative and it is measured in metres (m)
Amplitude (x0) is the maximum value of the displacement on either side of the equilibrium position and is known as the amplitude of the oscillation
Amplitude is measured in metres (m)
Wavelength (λ) is the length of one complete oscillation measured from the same point on two consecutive waves
Wavelength is measured in metres (m)
Wavelength and amplitude on a displacement-time graph
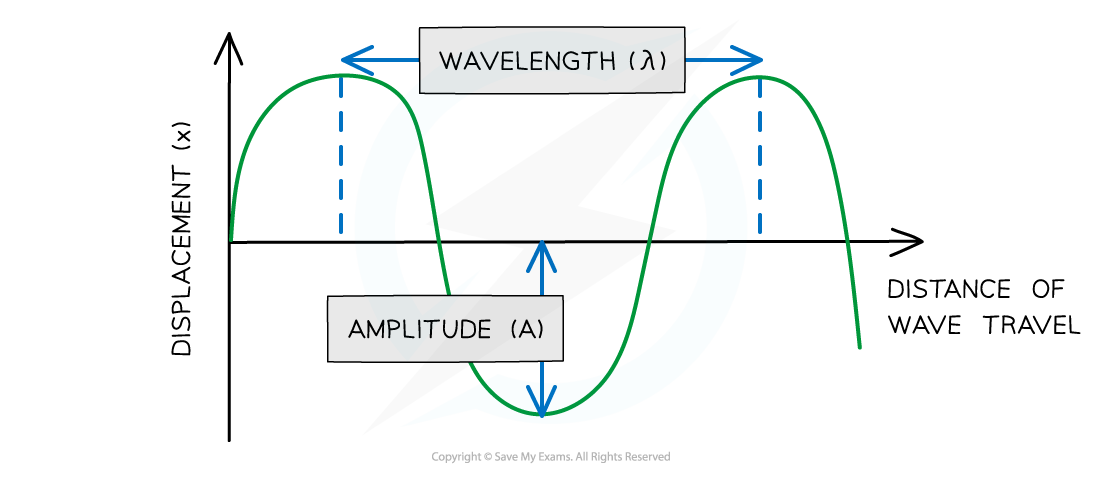
Diagram of wavelength and amplitude of a wave
Period (T) or time period, is the time interval for one complete repetition and it is measured in seconds (s)
Simple harmonic oscillations have a constant period
Time period can be calculated in terms of both frequency and angular frequency by the equations:
Where:
T = Time period (s)
f = frequency (Hz)
ω = angular frequency (rad s−1)
Time period on a displacement-time graph
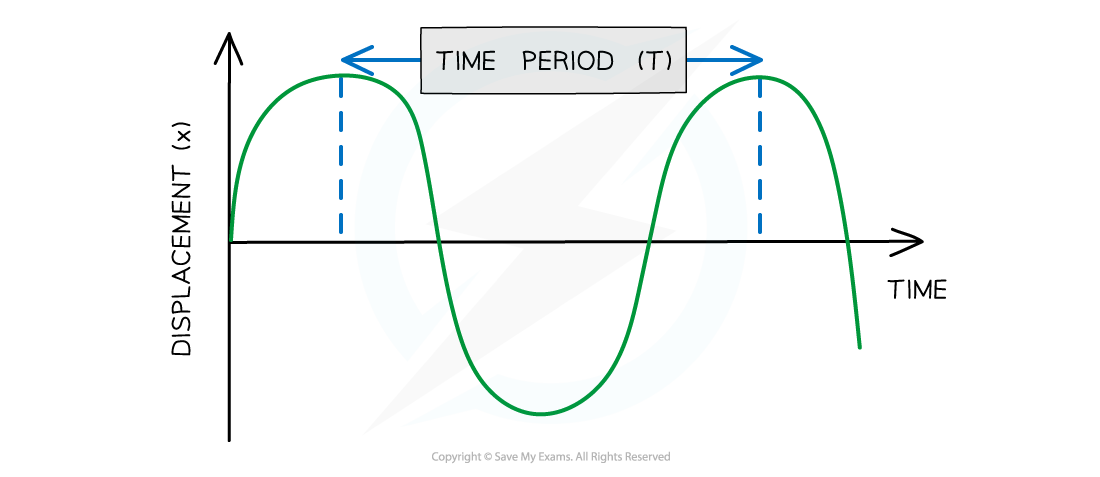
Diagram showing the time period of a wave
Frequency (f) is the number of oscillations per second measured in hertz (Hz)
Hz have the SI units of per second s−1
Angular Frequency (ω) is the rate of change of angular displacement with respect to time
Angular frequency is measured in rad s−1
It is given by the equations:
Where:
ω = angular frequency (rad s−1)
T = time period (s)
f = frequency (Hz)
Phase difference
Phase is a useful way to consider wave behaviour
The phase of a wave can be measured in terms of:
Fractions of wavelength
Degrees
Radians
One complete oscillation is:
1 wavelength
360°
2π radians
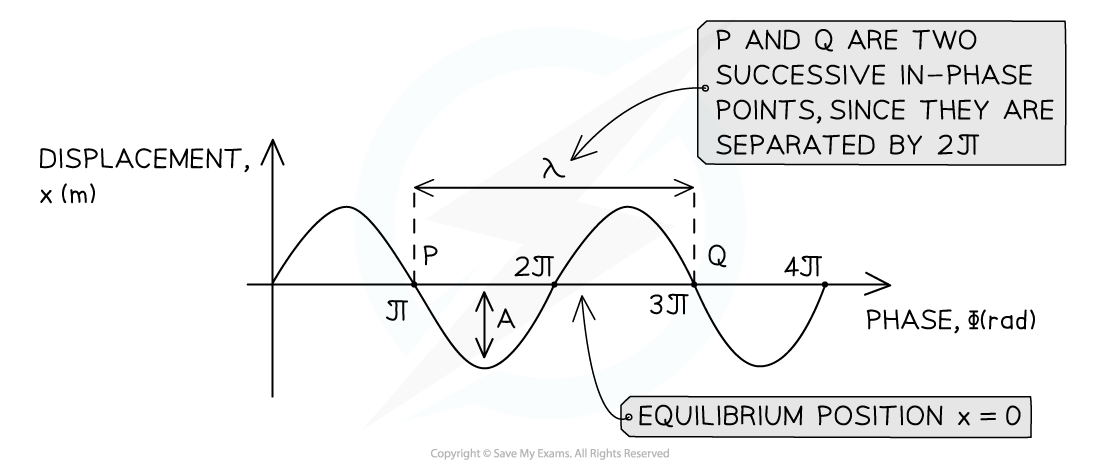
Wavelength λ and amplitude A of a travelling wave
The phase difference between two waves is a measure of how much a point or a wave is in front or behind another
This can be found from the relative position of the crests or troughs of two different waves of the same frequency
When the crests of each wave, or the troughs of each wave are aligned, the waves are in phase
When the crest of one wave aligns with the trough of another, they are in antiphase
The diagram below shows that
the green wave leads the purple wave by ¼ λ
the purple wave lags behind the green wave by ¼ λ
A phase difference of 1/4 wavelength
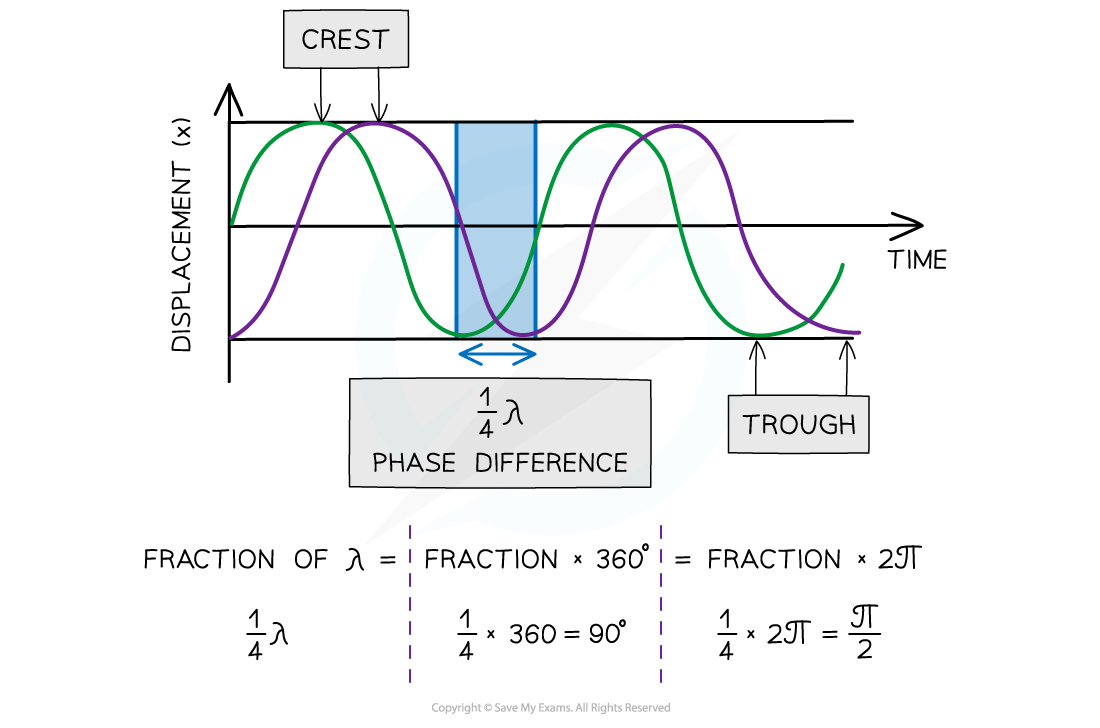
Two waves ¼ λ out of phase
Phase difference can be described as in phase or in anti-phase:
In phase is 360o or 2π radians
In anti-phase is 180o or π radians
Worked Example
A student sets out to investigate the oscillation of a mass suspended from the free end of a spring. The mass is pulled downwards and then released. The variation with time t of the displacement y of the mass is shown in the figure below.
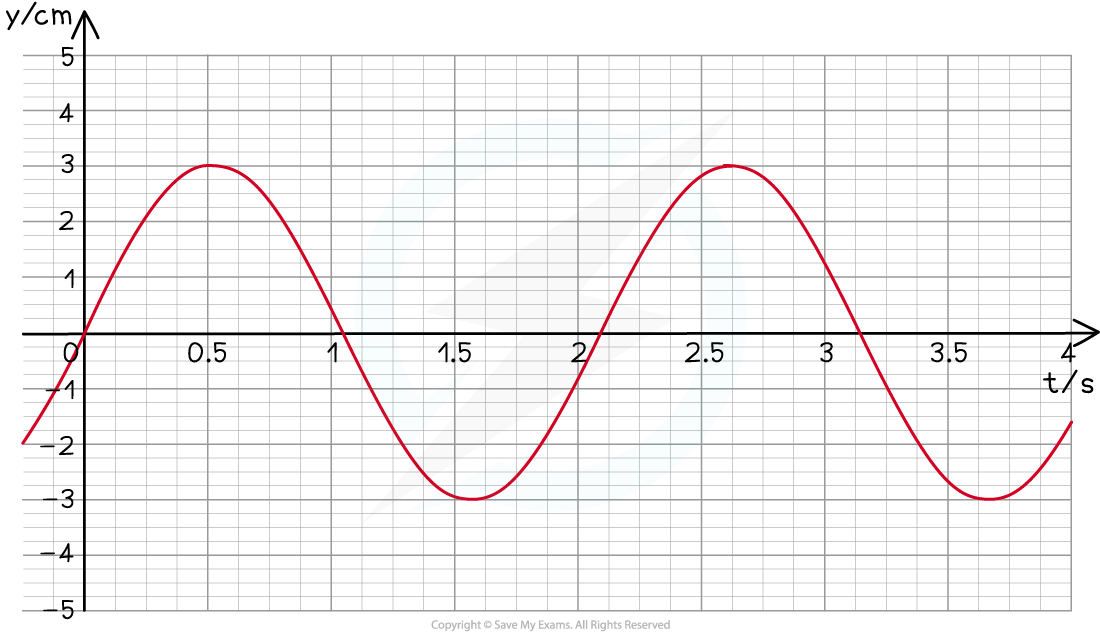
Use the information from the figure to calculate the angular frequency of the oscillations.
Answer:
Step 1: Write down the equation for angular frequency
Step 2: Calculate the time period T from the graph
The time period is defined as the time taken for one complete oscillation
This can be read from the graph:
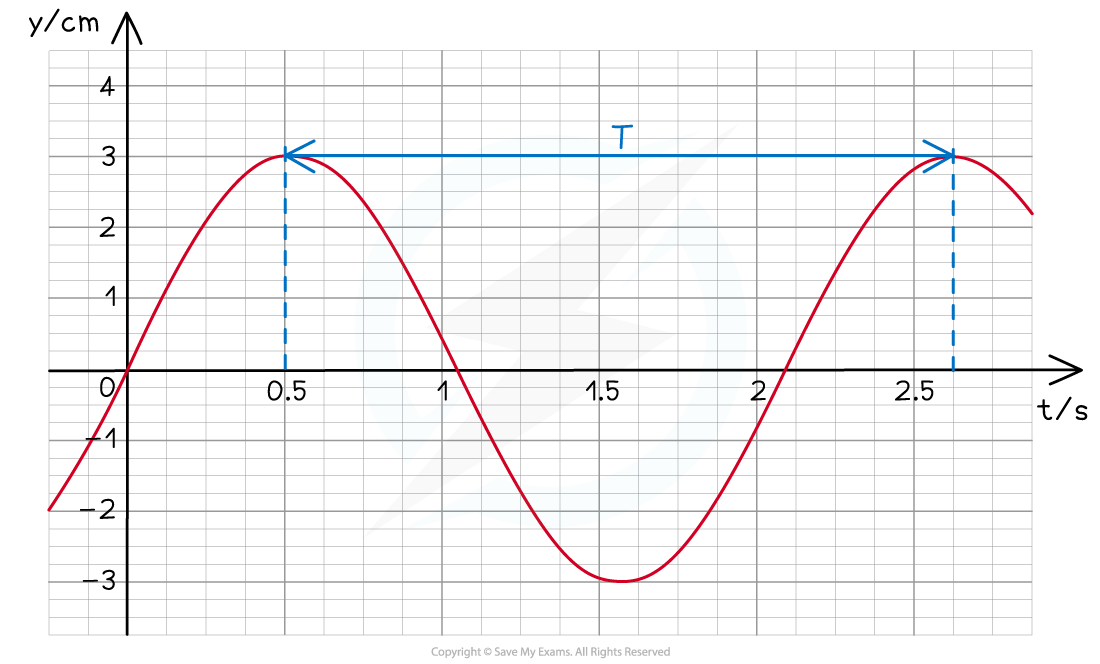
T = 2.6 − 0.5 = 2.1 s
Step 3: Substitute into angular frequency equation
Examiner Tips and Tricks
The properties used to describe oscillations are very similar to transverse waves. The key difference is that oscillators do not have a ‘wavelength’ and their direction of travel is only kept within the oscillations themselves rather than travelling a distance in space.
When labelling the wavelength and time period on a diagram:
Make sure that your arrows go from the very top of a wave to the very top of the next one
If your arrow is too short, you will lose marks
The same goes for labelling amplitude, don’t draw an arrow from the bottom to the top of the wave, this will lose you marks too.

Unlock more, it's free!
Did this page help you?