Thermodynamics & Engines (AQA A Level Physics)

Exam Questions

32 mins5 questions
1a
Sme Calculator
3 marks

A single-cylinder air motor running on compressed air has the theoretical indicator diagram shown in Figure 4.

Figure 4
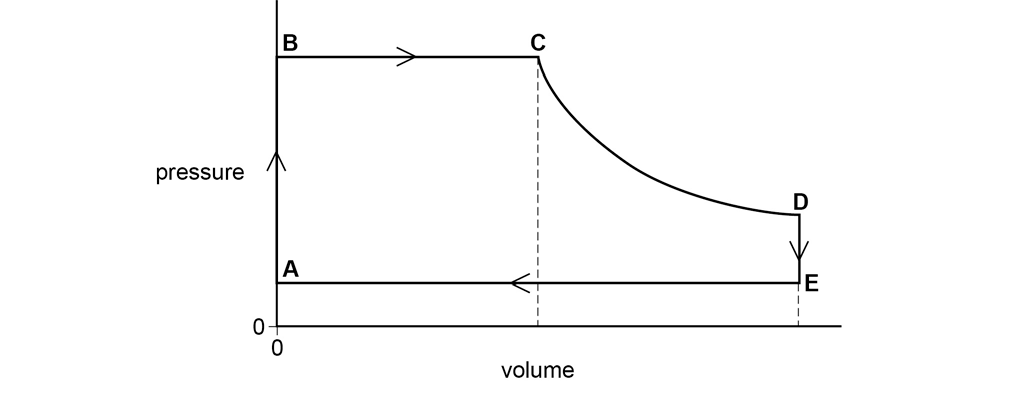
Pressure-volume graph of a thermodynamic process, showing stages A to E. A to B is a vertical line upwards at a volume of zero from initial pressure to a higher pressure.
B to C is a horizontal line rightwards from the y axis. 
C to D is a curve of negative gradient, initially steep at C then flattening out towards D
D to E is a short vertically downward line at the maximum volume. Point E has the same initial pressure as A.
A to E is a horizontal line leftward from maximum volume to a volume of zero.
  • From B to C the high-pressure air pushes a piston down a cylinder, doing work.

  • At C, a valve cuts off the supply of air and the air in the motor expands adiabatically to D, pushing the piston further down the cylinder.

  • At D an exhaust valve opens and from D to E to A the air is exhausted to the surrounding atmosphere as the piston moves up the cylinder.

  • At A the exhaust valve closes and the inlet valve opens connecting the cylinder to the supply of compressed air.

Use the first law of thermodynamics to explain why the temperature falls during the adiabatic change between C and D.

1b
Sme Calculator
4 marks

Figure 6 shows the actual indicator diagram for the air motor.

Figure 6
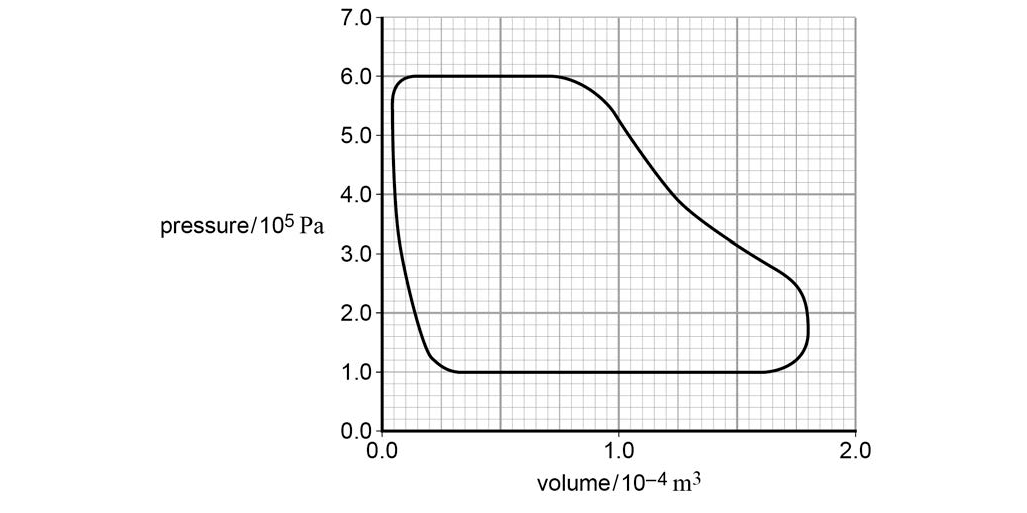
A pressure volume shows a rounded loop. Pressure axis goes from 0.0 to 7.0 in units of 10^5 Pa. Volume axis, x axis, goes from 0 to 2.0 with units of 10^-4 metres cubed.
The lowest horizontal edge of the loop is flat along a pressure of 1.0, from a volume of 0.3 to 1.6. At the 0.3 end, the loop curves up steeply (but not horizontally) to a pressure of 6.0 at a volume of 0.1.
This upper boundary of the curve is flat at a pressure of 6.0 from a volume of 0.1 to 0.7. From here, the loop curves down diagonally to a volume of 1.7 and pressure of 2.6. Here, the loop curves down nearly horizontally, then back on itself to meet the right side of the flat lower boundary of the loop, at (1.6, 1.0).

The motor was running at 20 cycles per second when the indicator diagram was recorded.

Determine the indicated power, in watts, of the motor.

1c
Sme Calculator
1 mark

Explain why the indicated power for the air motor is different from the output power.

Did this page help you?

2a
Sme Calculator
1 mark

A company claims to be able to provide a combined heat and power plant for a market garden that requires both electrical power and space heating for greenhouses.

The engine-driven generator will operate between temperatures of 1450 K and 310 K.

Show that the maximum theoretical efficiency of any heat engine operating between temperatures of 1450 K and 310 K is about 80%.

2b
Sme Calculator
5 marks

The company makes the following two claims about the performance of the plant:

  • Claim 1: When consuming biogas of calorific value 55.5 MJ m−3 at the rate of 5.00 × 10⁻³ m3 s −1, the electrical power output will be 210 kW.

  • Claim 2: At the same time the engine will provide heating for greenhouses at the rate of at least 55.0 kW.

Discuss the extent to which the company’s claims are justified.

Did this page help you?

3a
Sme Calculator
4 marks

Figure 4 shows a gas strut supporting the lid of a trailer.

Figure 4

Diagram of a trailer with a tilted top. The top is supported by a gas strut attached to the main body of the trailer. The upper part of the gas strut is a cylinder.

A fixed mass of nitrogen gas is sealed into the cylinder of the strut.

The gas is initially at a pressure of 1.2 × 10⁶ Pa, a volume of 9.0 × 10⁻⁵ m3 and a temperature of 290 K.

When the lid is closed quickly the gas is compressed rapidly to a final volume of 6.8 × 10⁻⁵ m3 .

Calculate the pressure (in Pa) and temperature (in K) of the gas at the end of the compression assuming the compression to be an adiabatic process.

Adiabatic index gamma for nitrogen = 1.4

3b
Sme Calculator
2 marks

Explain why the rapid compression of the gas can be assumed to be an adiabatic process.

3c
Sme Calculator
3 marks

When the lid is closed slowly, the compression can be assumed to be isothermal.

The gas can be compressed either isothermally or adiabatically from the same initial conditions to the same final volume.

Compare without calculation the work done in each process.

Did this page help you?

4a
Sme Calculator
1 mark

An ideal heat pump and an ideal refrigerator operate between the same hot and cold spaces.

Which statement relating to the coefficient of performance (COP) is correct?

  • The COP of the refrigerator must be < 1.

  • The COP of the heat pump must be greater than the COP of the refrigerator.

  • The COP of the heat pump will increase if the temperature of the hot space is increased.

  • The COP of the refrigerator will decrease if the cold space temperature increases.

4b
Sme Calculator
3 marks

An ideal refrigerator operates between a cold space at a temperature of −1°C and a hot space at a temperature of 70 °C.

Calculate the input power to the refrigerator if the rate of transfer of energy to the hot space is 100 W.

Did this page help you?

5a
Sme Calculator
2 marks

Tumble-dryers blow hot air over wet clothes that are moving in a rotating drum. Conventional tumble-dryers heat the air in the drum electrically; other dryers use a heat pump to heat the air.

A typical conventional tumble-dryer uses about 0.6 kW h per kg of clothes.
A heat pump tumble-dryer uses about 0.25 kW h per kg.

Explain why the heat pump tumble-dryer uses less electrical energy than the conventional tumble-dryer to dry the same load.

5b3 marks

The cold space of the heat pump is the room in which the tumble-dryer is placed. The hot space is the air in the tumble-dryer and is at a temperature of 160 °C.

A heat pump tumble-dryer can be placed in a kitchen at a temperature of 20 °C, or in a garage at around 5 °C.

Deduce which place would result in lower running costs for the tumble-dryer. Support your answer with calculations.

Did this page help you?