State clearly the definition of:
(i) A random error
(ii) A systematic error
(iii) An anomalous result
Figure 1 shows part of a thermometer.
Figure 1

Determine the correct reading on the thermometer with its absolute uncertainty.
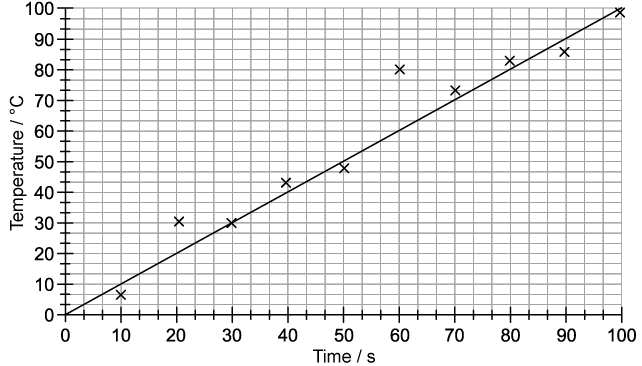
A student measures the time taken for water at 0 ºC to boil to 100 ºC. Figure 2 shows the graph of the temperature against time.
Figure 2

Identify the anomalous result on the graph in Figure 2 by drawing a circle around it.
State and explain whether the graph in Figure 2 demonstrate systematic or random errors. Suggest one way to reduce this type of error.
Did this page help you?


