Binding Energy (AQA A Level Physics): Revision Note
Exam code: 7408
Binding Energy per Nucleon Graph
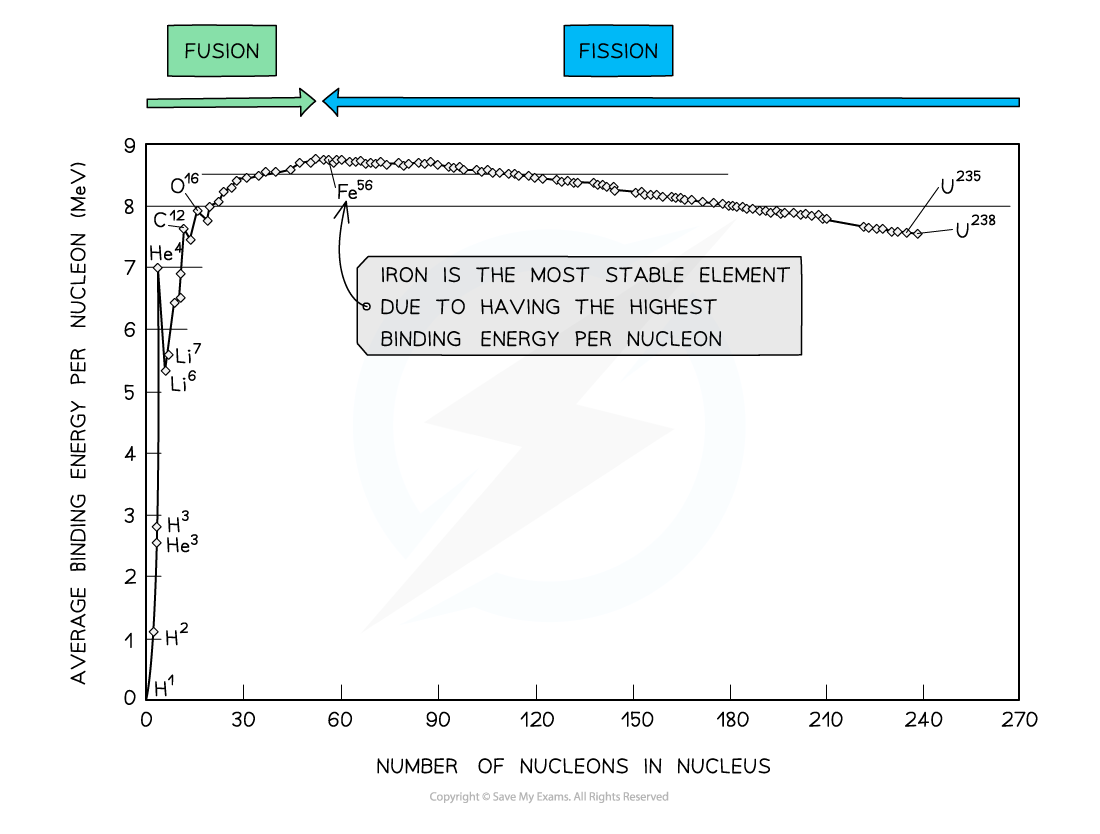
In order to compare nuclear stability, it is useful to look at the binding energy per nucleon
The binding energy per nucleon is defined as:
The binding energy of a nucleus divided by the number of nucleons in the nucleus
A higher binding energy per nucleon indicates a higher stability
In other words, more energy is required to separate the nucleons contained within a nucleus

By plotting a graph of binding energy per nucleon against nucleon number, the stability of elements can be inferred
Key Features of the Graph
At low values of A:
Nuclei have lower binding energies per nucleon than at large values of A, but they tend to be stable when N = Z
This means light nuclei have weaker electrostatic forces and will undergo fusion
The gradient is much steeper compared to the gradient at large values of A
This means that fusion reactions release a greater binding energy than fission reactions
At high values of A:
Nuclei have generally higher binding energies per nucleon, but this gradually decreases with A
This means the heaviest elements are the most unstable and will undergo fission
The gradient is less steep compared to the gradient at low values of A
This means that fission reactions release less binding energy than fusion reactions
Iron (A = 56) has the highest binding energy per nucleon, which makes it the most stable of all the elements
Helium (4He), carbon (12C) and oxygen (16O) do not fit the trend
Helium-4 is a particularly stable nucleus hence it has a high binding energy per nucleon
Carbon-12 and oxygen-16 can be considered to be three and four helium nuclei, respectively, bound together
Comparing Fusion & Fission
Similarities
In both fusion and fission, the total mass of the products is slightly less than the total mass of the reactants
The mass defect is equivalent to the binding energy that is released
As a result, both fusion and fission reactions release energy
Differences
In fusion, two smaller nuclei combine into a larger nucleus
In fission, an unstable nucleus splits into two smaller nuclei
Fusion occurs between light nuclei (A < 56)
Fission occurs in heavy nuclei (A > 56)
In light nuclei, attractive nuclear forces dominate over repulsive electrostatic forces between protons, and this contributes to nuclear stability
In heavy nuclei, repulsive electrostatic forces between protons begin to dominate over attractive nuclear forces, and this contributes to nuclear instability
Fusion releases much more energy per kg than fission
Fusion requires a greater initial input of energy than fission
Worked Example
The equation below represents one possible decay of the induced fission of a nucleus of uranium-235.
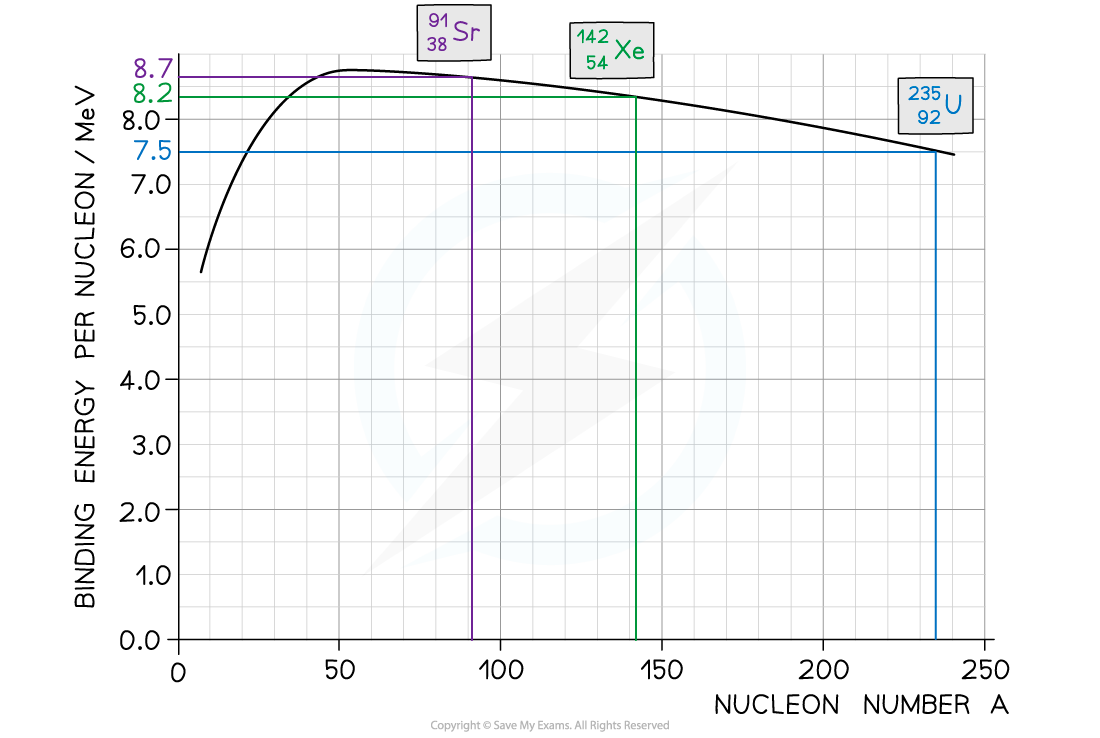
The graph shows the binding energy per nucleon plotted against nucleon number A.

Calculate the energy released:
(a) By the fission process represented by the equation
(b) When 1.0 kg of uranium, containing 3% by mass of U-235, undergoes fission
Answer:
Part (a)
Step 1: Use the graph to identify each isotope’s binding energy per nucleon

Binding energy per nucleon (U-235) = 7.5 MeV
Binding energy per nucleon (Sr-91) = 8.2 MeV
Binding energy per nucleon (Xe-142) = 8.7 MeV
Step 2: Determine the binding energy of each isotope
Binding energy = Binding Energy per Nucleon × Mass Number
Binding energy of U-235 nucleus = (235 × 7.5) = 1763 MeV
Binding energy of Sr-91 = (91 × 8.2) = 746 MeV
Binding energy of Xe-142 = (142 × 8.7) = 1235 MeV
Step 3: Calculate the energy released
Energy released = Binding energy after (Sr + Xe) – Binding energy before (U)
Energy released = (1235 + 746) – 1763 = 218 MeV
Part (b)
Step 1: Calculate the energy released by 1 mol of uranium-235
There are NA (Avogadro’s number) atoms in 1 mol of U-235, which is equal to a mass of 235 g
Energy released by 235 g of U-235 = (6 × 1023) × 218 MeV
Step 2: Convert the energy released from MeV to J
1 MeV = 1.6 × 10⁻¹³ J
Energy released = (6 × 1023) × 218 × (1.6 × 10–13) = 2.09 × 10¹³ J
Step 3: Work out the proportion of uranium-235 in the sample
1 kg of uranium which is 3% U-235 contains 0.03 kg or 30 g of U-235
Step 4: Calculate the energy released by the sample
Energy released from 1 kg of Uranium =
Examiner Tips and Tricks
Checklist on what to include (and what not to include) in an exam question asking you to draw a graph of binding energy per nucleon against nucleon number:
You will be expected to draw the best fit curve AND a cross to show the anomaly that is helium
Do not begin your curve at A = 0, this is not a nucleus!
Make sure to correctly label both axes AND units for binding energy per nucleon
You will be expected to include numbers on the axes, mainly at the peak to show the position of iron (56Fe)

Unlock more, it's free!
Did this page help you?