Required Practical: Inverse Square-Law for Gamma Radiation (AQA A Level Physics): Revision Note
Exam code: 7408
Required Practical: Inverse Square-Law for Gamma Radiation
Aim of the Experiment
The aim of this experiment is to verify the inverse square law for gamma radiation of a known gamma-emitting radioactive source
Variables
Independent variable = the distance between the source and detector, x (m)
Dependent variable = the count rate / activity of the source, C
Control variables
The time interval of each measurement
The same thickness of aluminium foil
The same gamma source
The same GM tube
Equipment List
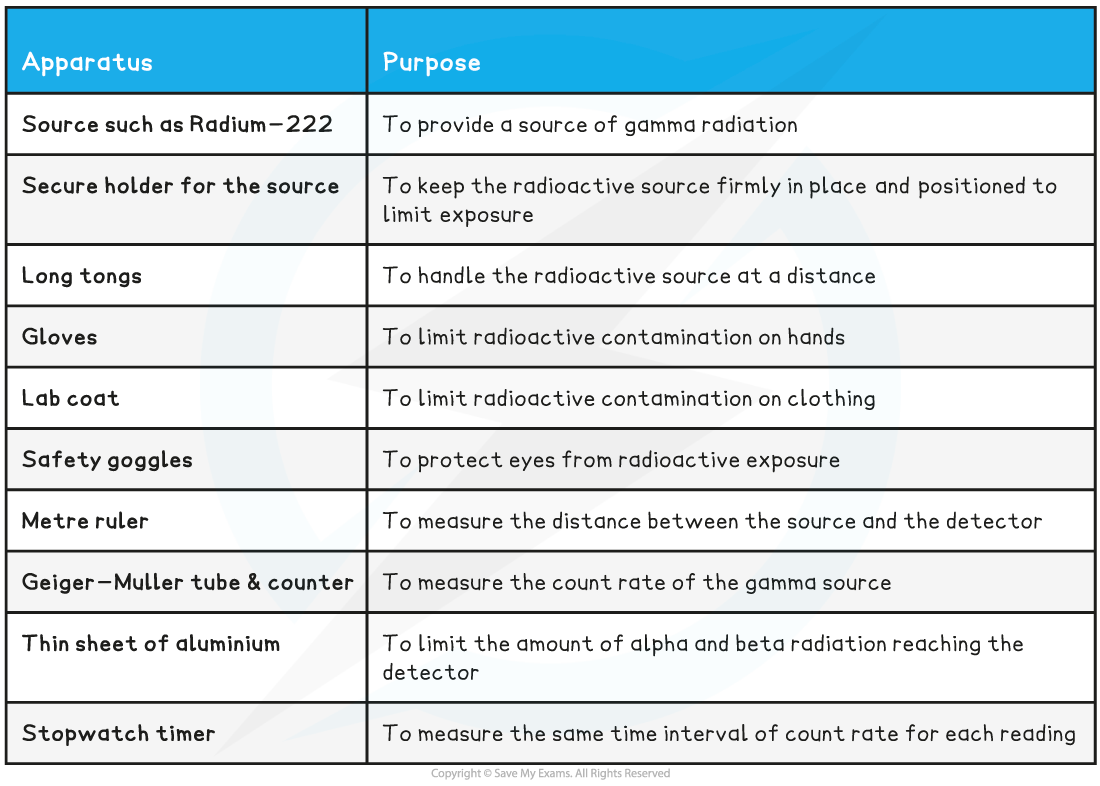
Resolution of equipment:
Metre ruler = 1 mm
Stopwatch = 0.01 s
Method
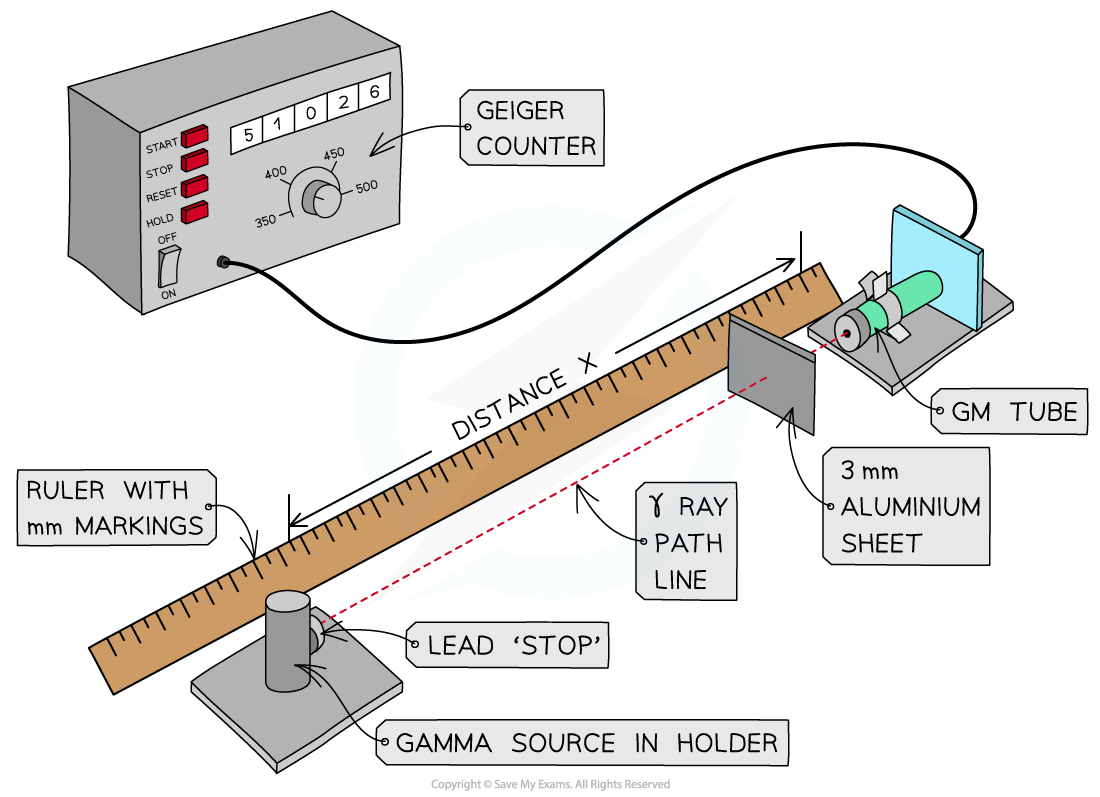
Set up for inverse-square law investigation
Measure the background radiation using a Geiger Muller tube without the gamma source in the room, take several readings and find an average
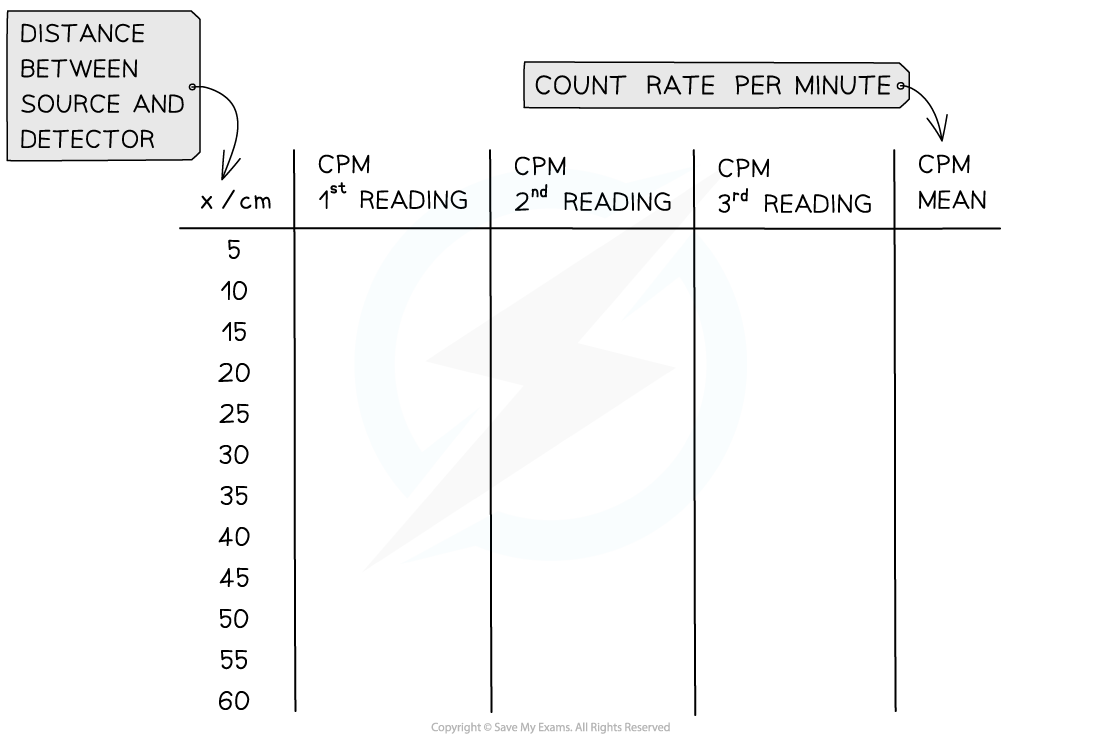
Next, put the gamma source at a set starting distance (e.g. 5 cm) from the GM tube and measure the number of counts in 60 seconds
Record 3 measurements for each distance and take an average
Repeat this for several distances going up in 5 cm intervals
A suitable table of results might look like this:
Analysing the Results
According to the inverse square law, the intensity, I, of the gamma radiation from a point source depends on the distance, x, from the source
Intensity is proportional to the corrected count rate, C, so:
Rearranging this equation gives:
Comparing this to the equation of a straight line, y = mx
y =
x =
(m)
Gradient = constant, k
Subtract the background radiation from each count rate reading to give the corrected count rate, C
Plot a graph of
against distance
If it is a straight-line graph, this shows they are directly proportional, and the inverse square relationship is confirmed
Graph for Inverse Square Law Experiment
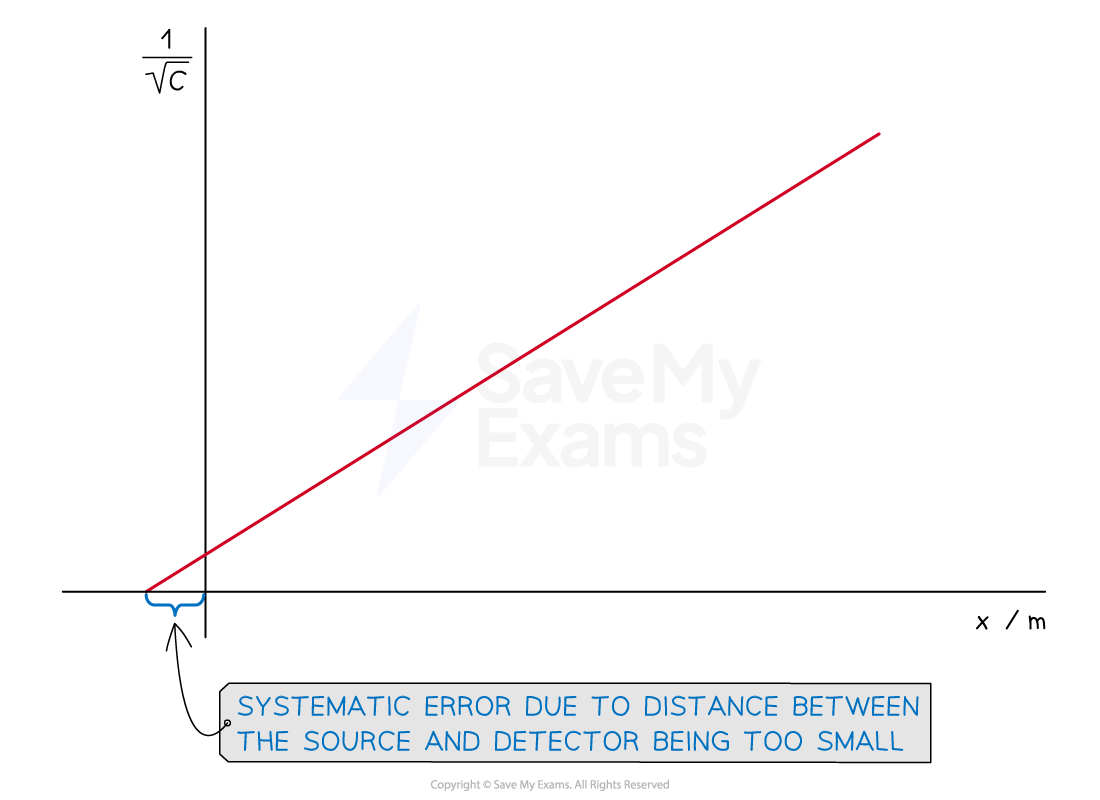
A straight-line graph verifies the inverse square relationship. If the line does not go through the origin, this indicates the presence of a systematic error in the measurement of distance
Evaluating the Experiment
Systematic errors:
The main source of systematic error in this experiment is in the measurement of distance
It is unlikely that the source is at the end of the tube, and it is unlikely that the detector is at the end of the GM tube
This means the measured distance is likely to be smaller than the actual distance
By plotting a graph of
against
, this discrepancy can be easily read off the graph where the line meets the negative x-axis
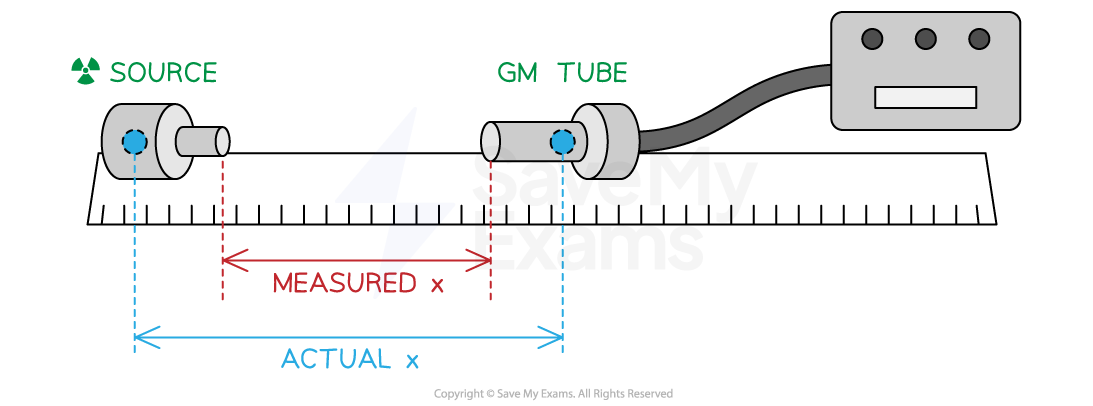
The exact positions of the gamma source and the detector in their sealed tubes are not known, so this gives rise to a systematic error in the measurement of distance
The Geiger counter may suffer from an issue called “dead time”
This is when multiple counts happen simultaneously within ~100 μs and the counter only registers one
This is a more common problem in older detectors, so using a more modern Geiger counter should reduce this problem
The source may not be a pure gamma emitter
To prevent any alpha or beta radiation from being measured, the Geiger-Muller tube should be shielded with a sheet of 2–3 mm aluminium
If alpha or beta emissions make it to the detector, this is likely to affect the shape of the graph, making it curve slightly
Random errors:
Radioactive decay is random, so repeat readings are vital in this experiment
Measure the count over the longest time span possible
A larger count helps reduce the statistical percentage uncertainty inherent in smaller readings
This is because the percentage error is proportional to the inverse-square root of the count
Safety Considerations
For the gamma source:
Reduce the exposure time by keeping it in a lead-lined box when not in use
Handle with long tongs
Do not point the source at anyone and keep a large distance (as activity reduces by an inverse square law)
Safety clothing such as a lab coat, gloves and goggles must be worn
Worked Example
A student measures the background radiation count in a laboratory and obtains the following readings:

The student is trying to verify the inverse square law of gamma radiation on a sample of Radium-226. He collects the following data:

Use this data to determine:
(a) if the student’s data follows an inverse square law
(b) the uncertainty in the gradient of the graph.

Answer:
Part (a)
Step 1: Determine a mean value of background radiation
Step 2: Calculate C (corrected average count rate) and C–1/2
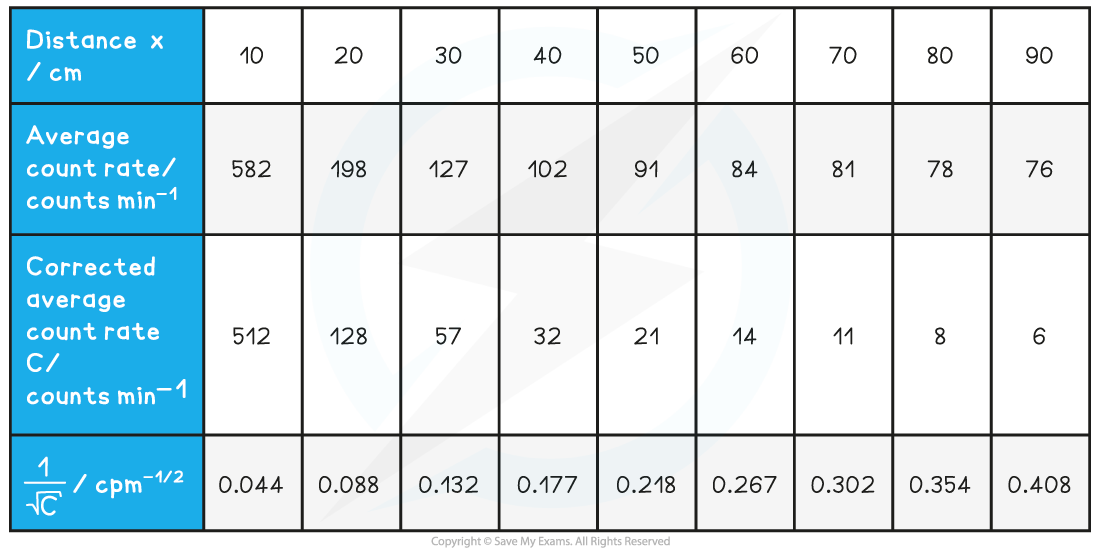
Step 3: Plot a graph of C–1/2 against x and draw a line of best fit
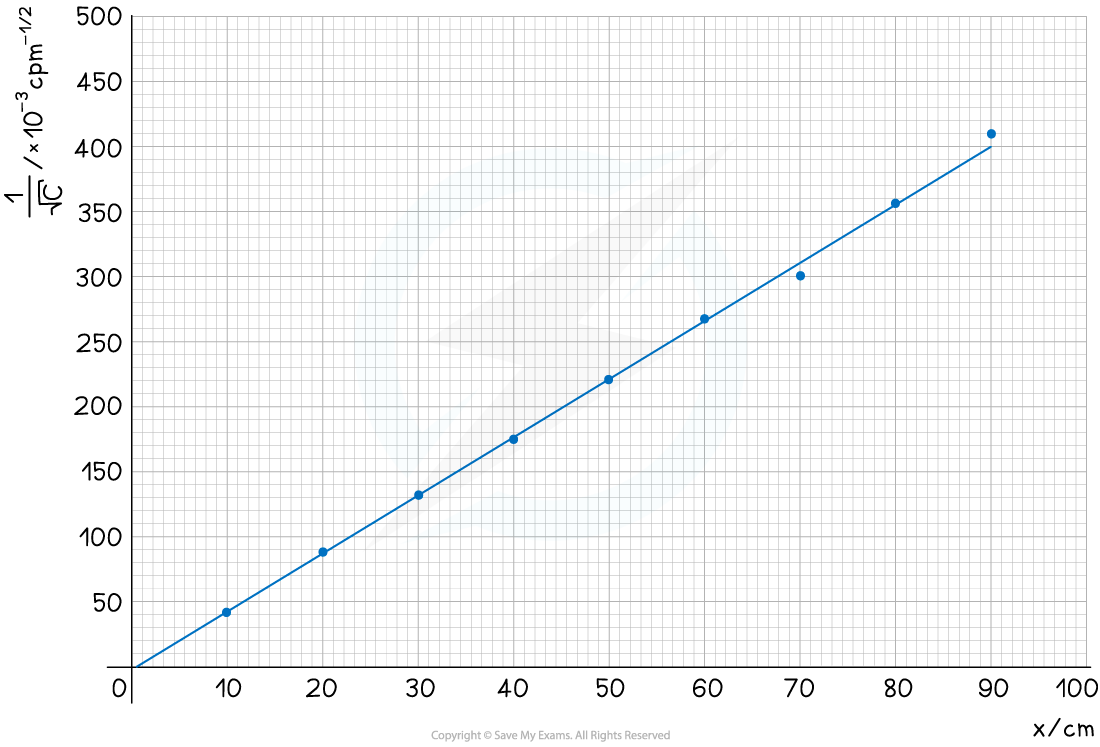
The graph shows C–1/2 is directly proportional to x, therefore, the data follows an inverse square law
Part (b)
Step 1: Determine the uncertainties in the readings
Uncertainty in the count rate:
Maximum value of C:
Error bars found from:
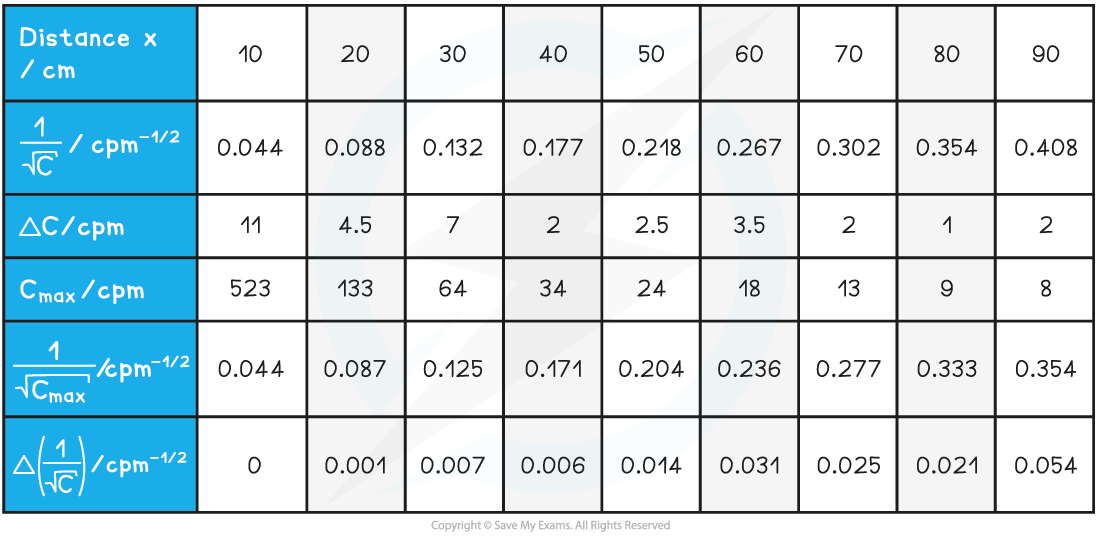
Step 2: Plot the error bars and draw a line of worst fit
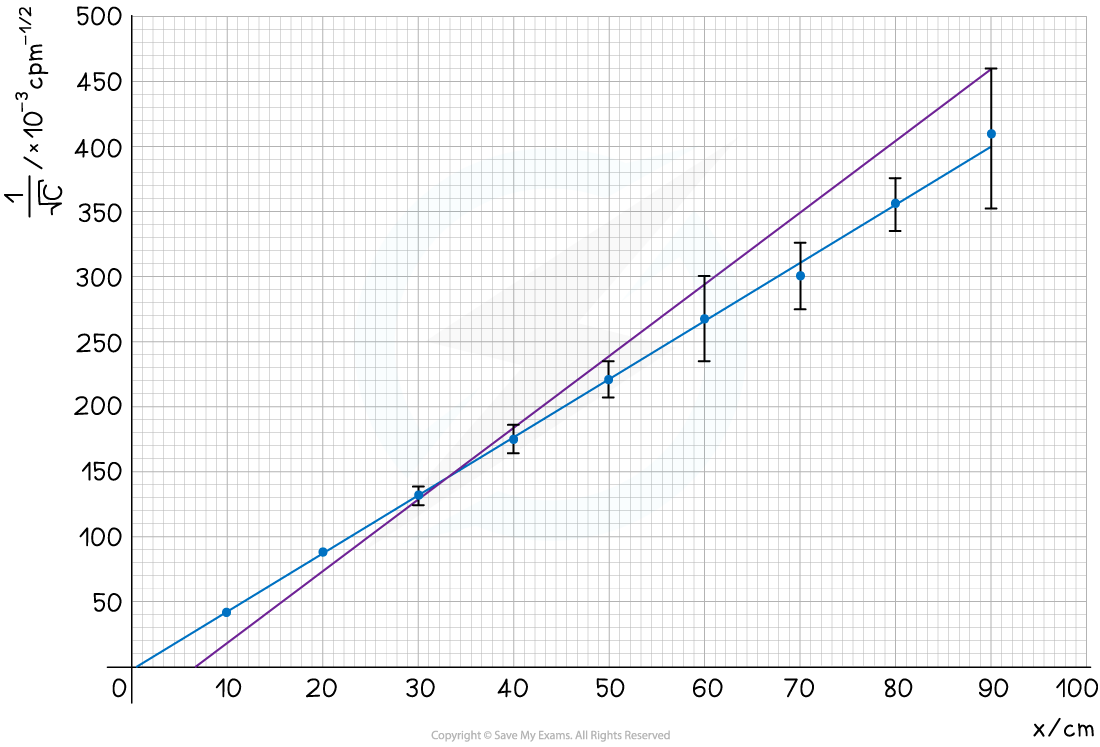
Step 3: Calculate the uncertainty in the gradient

Unlock more, it's free!
Did this page help you?