Motion Graphs (AQA A Level Physics): Revision Note
Exam code: 7408
Motion Graphs
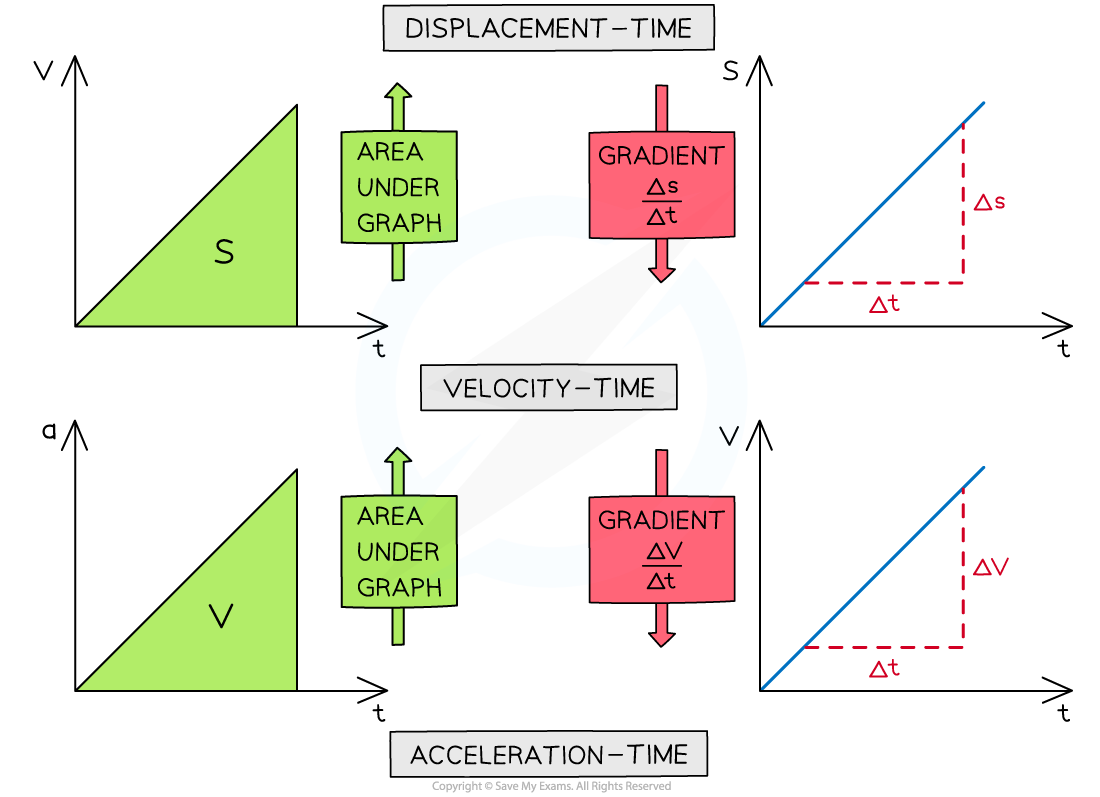
Gradients
The gradient of a displacement-time graph is the velocity
The gradient of a velocity-time graph is the acceleration
Area Under the Graph
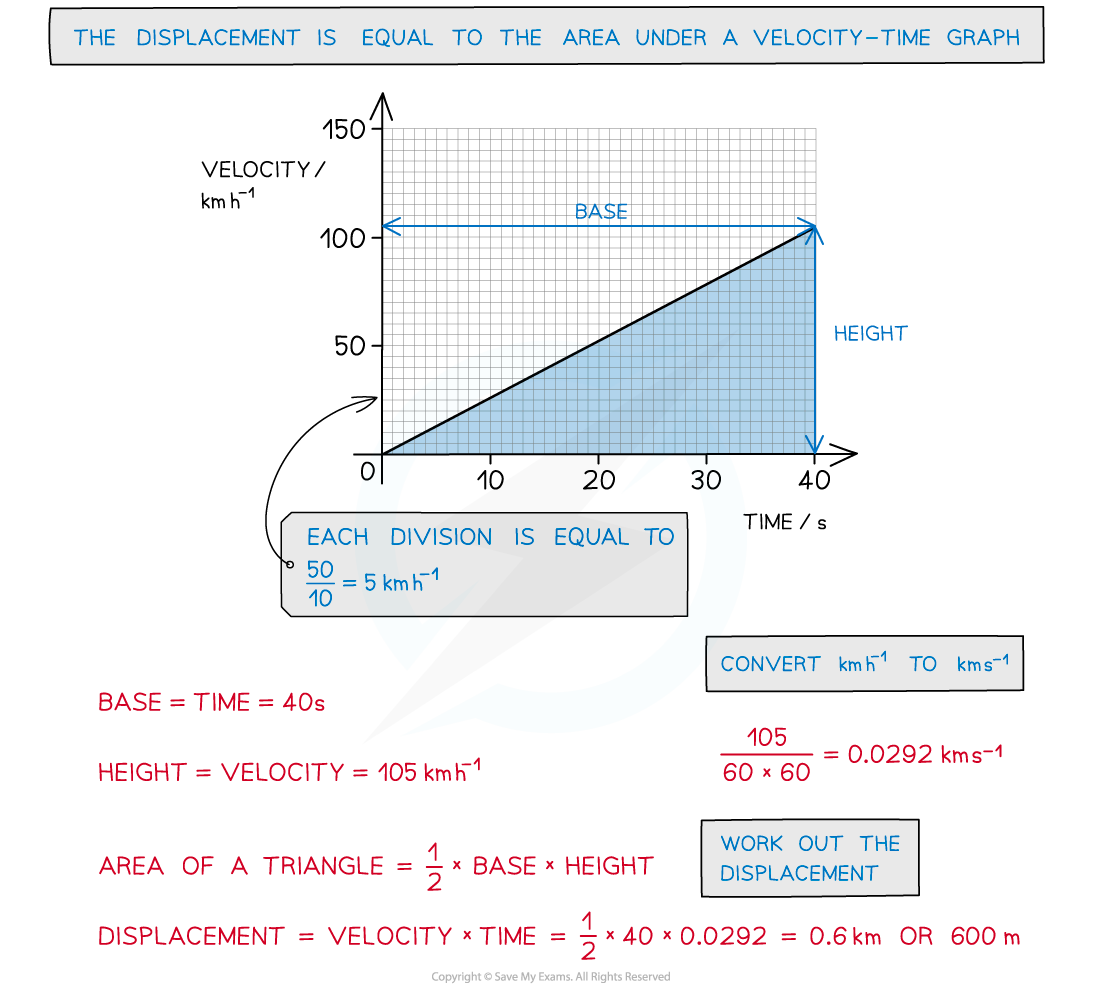
The area under a velocity-time graph is the displacement
The area under an acceleration-time graph is the velocity
Motion of a Bouncing Ball
For a bouncing ball, the acceleration due to gravity is always in the same direction (in a uniform gravitational field such as the Earth's surface)
This is assuming there are no other forces on the ball, such as air resistance
Since the ball changes its direction when it reaches its highest and lowest point, the direction of the velocity will change at these points
The vector nature of velocity means the ball will sometimes have a:
Positive velocity if it is travelling in the positive direction
Negative velocity if it is travelling in the negative direction
An example could be a ball bouncing from the ground back upwards and back down again
The positive direction is taken as upwards
This will be either stated in the question or can be chosen, as long as the direction is consistent throughout
Ignoring the effect of air resistance, the ball will reach the same height every time before bouncing from the ground again
When the ball is travelling upwards, it has a positive velocity which slowly decreases (decelerates) until it reaches its highest point
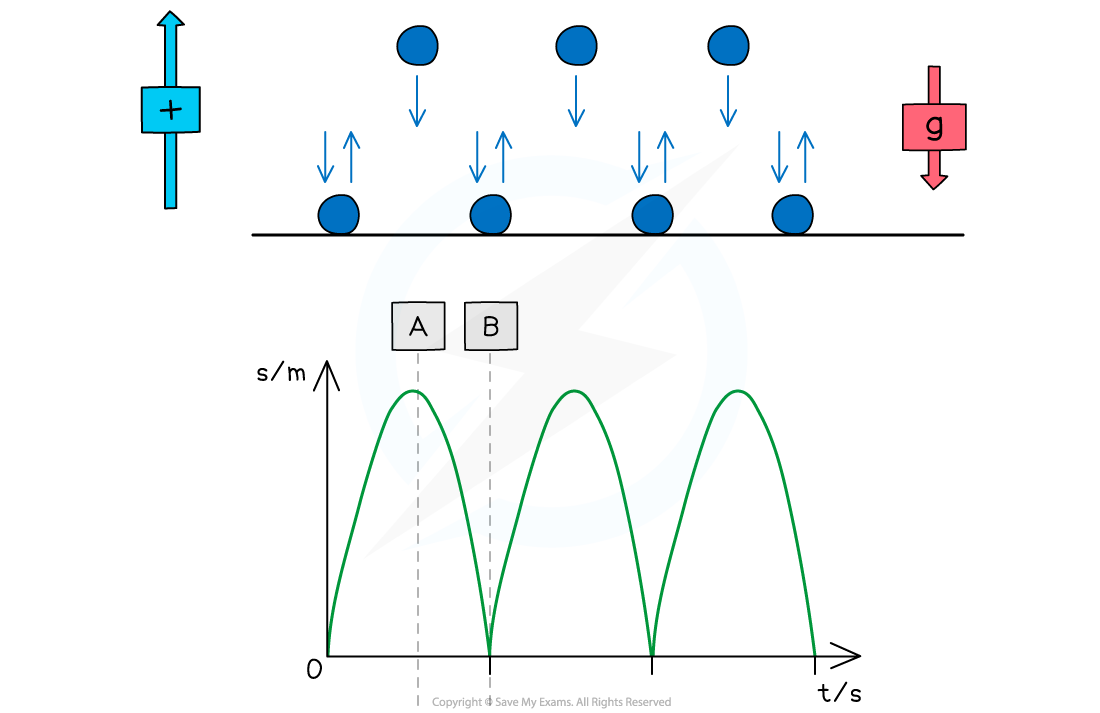
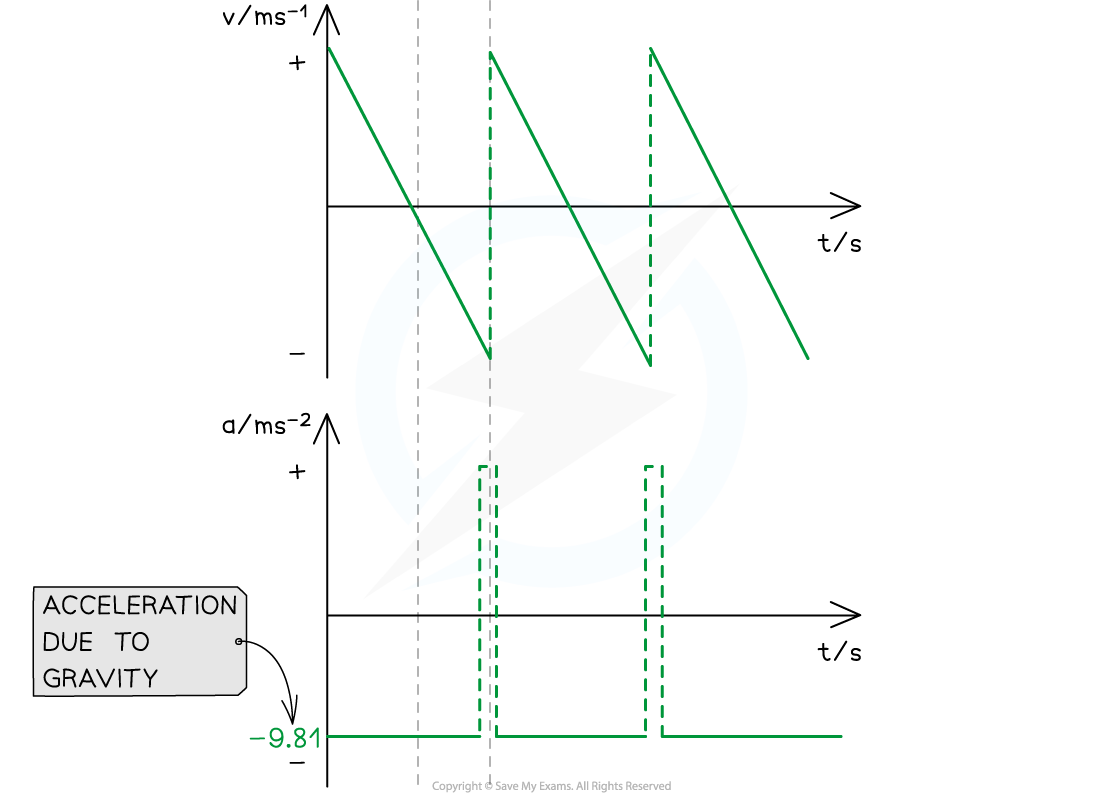
At point A (the highest point):
The ball is at its maximum displacement
The ball momentarily has zero velocity
The velocity changes from positive to negative as the ball changes direction
The acceleration, g, is still constant and directed vertically downwards
At point B (the lowest point):
The ball is at its minimum displacement (on the ground)
Its velocity changes instantaneously from negative to positive, but its speed (magnitude) remains the same
The change in direction causes a momentary acceleration (since acceleration = change in velocity / time)
Worked Example
The velocity-time graph of a vehicle travelling with uniform acceleration is shown in the diagram below.
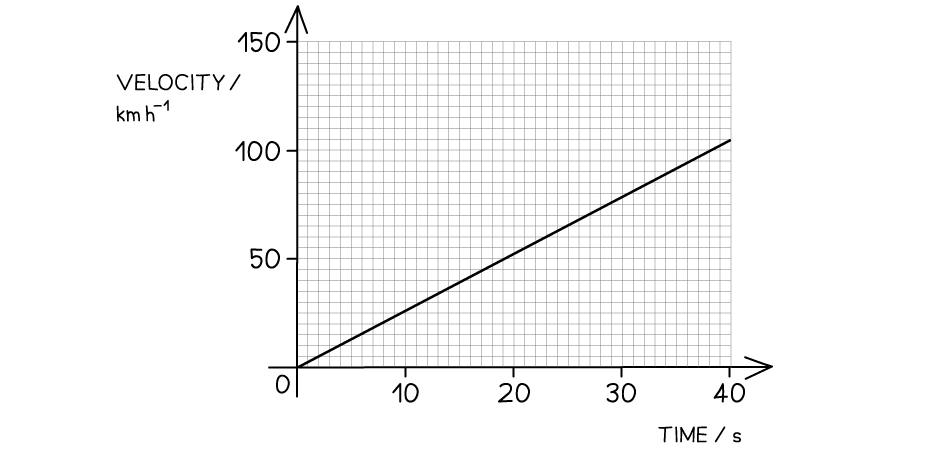
Calculate the displacement of the vehicle at 40 s.
Answer:
Examiner Tips and Tricks
Always check the values given on the y-axis of a motion graph - students often confuse displacement-time graphs and velocity-time graphs. The area under the graph can often be broken down into triangles, squares and rectangles, so make sure you are comfortable with calculating area!

Unlock more, it's free!
Did this page help you?