The Decibel Scale (AQA A Level Physics): Revision Note
Exam code: 7408
Relative Intensity Levels of Sound
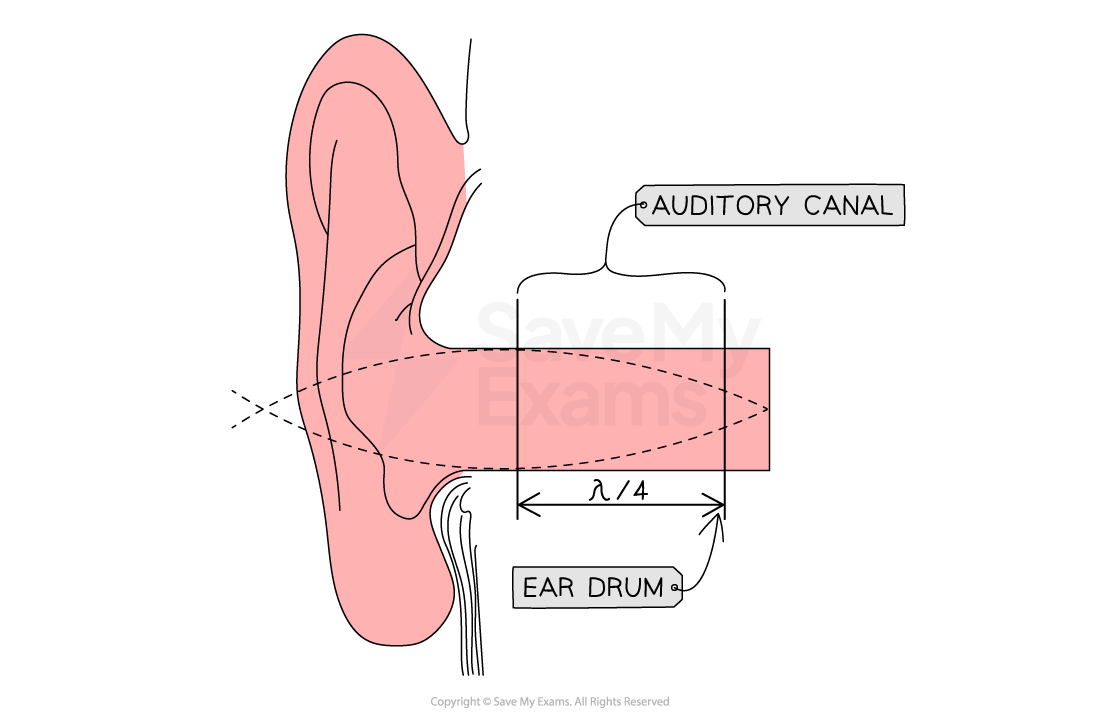
When the sound waves enter the auditory canal, a stationary wave is set up
This can be modelled as a tube with an antinode forming at the open end and a node forming at the closed end
As a result, the auditory canal acts as a closed tube resonator which enhances the sensitivity of sounds in specific ranges
In the case of human hearing, this is what enables us to hear sounds in the range of 20 Hz to 20,000 Hz
The highest sensitivity region is around 2 to 5 kHz, which corresponds to frequencies of speech
Resonance in the Auditory Canal

The auditory canal works as a closed tube resonator which is sensitive to specific ranges of frequencies
The Decibel Scale
The ear’s ability to detect small changes in sound intensity is referred to as its sensitivity
This is measured in decibels (dB)
The sensitivity of human hearing depends on the frequency of the sound
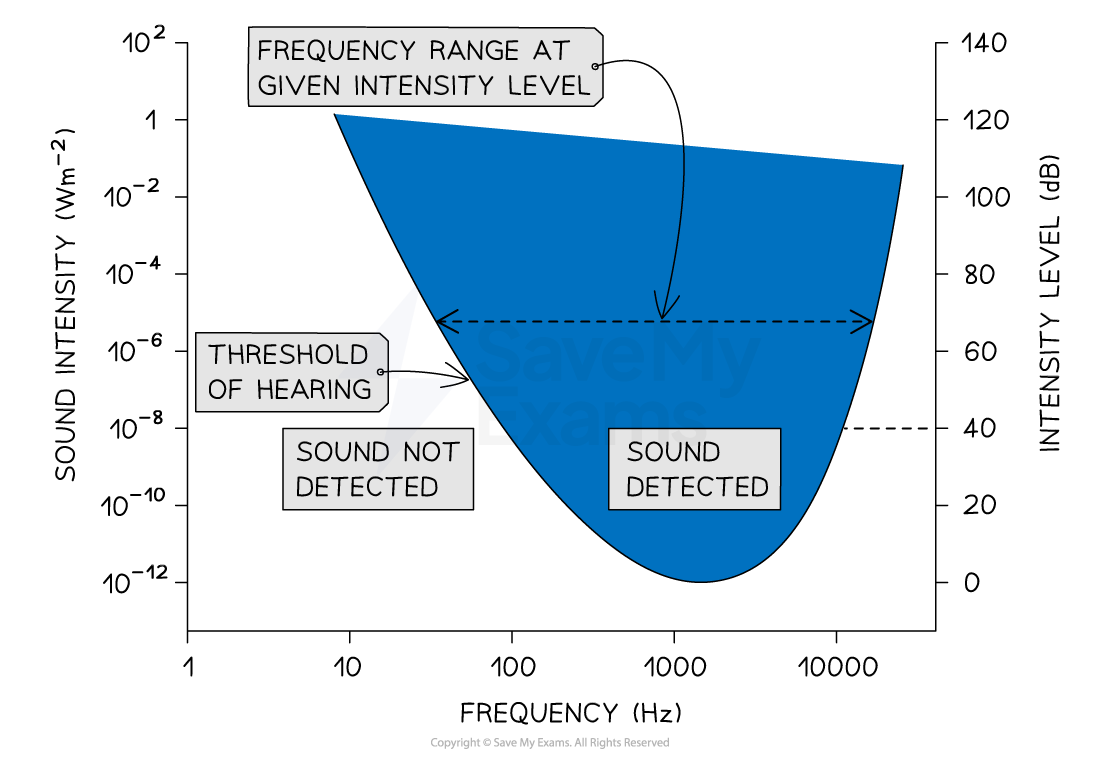
The graph of sound intensity and frequency shows that the ear is most sensitive to sounds with a frequency of about 3000 Hz
The Relationship between Sound Intensity and Frequency

The human ear is most sensitive to sounds with a frequency of around 3000 Hz
For frequencies much greater, or lower than 3000 Hz, the intensity of sound must be several orders of magnitude higher to be detected
This large range of intensities shows that the response of the ear is logarithmic
The decibel (dB) scale is also logarithmic
Hence, the decibel scale is a useful way of measuring the response of the human ear to changes in sound intensity
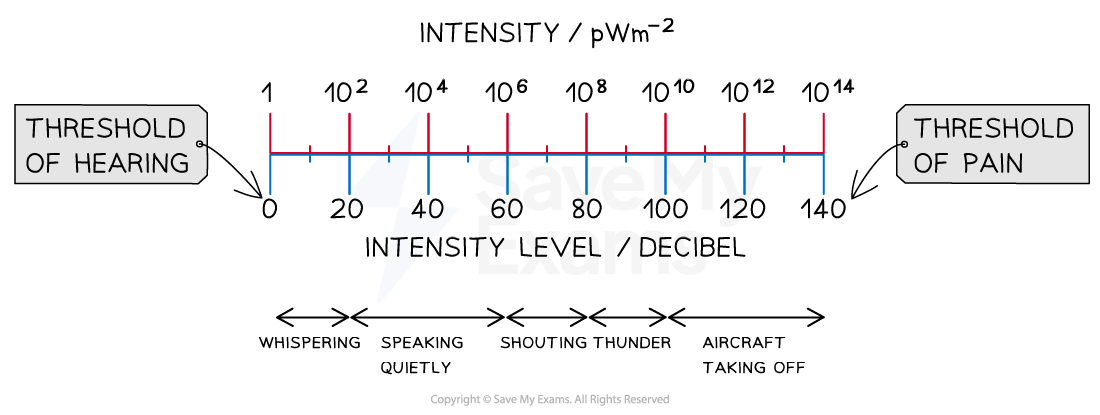
The Decibel Scale

The decibel scale is used to represent the large range of intensities that the ear can detect on a logarithmic scale
Worked Example
Give two reasons why logarithmic scales are used to measure the loudness of a sound.
Answer:
The ear can detect sounds over a very large range of intensities, across many orders of magnitude
This means the ear’s perception of loudness is logarithmic
Therefore, a logarithmic scale is a useful way to plot or analyse such a large range of numbers
For example, on the graph above:
The range of frequency of human hearing is ~20 to 20 000 Hz
So, frequency values are plotted on the axes in increments of 10 (1, 10, 100, 1000, etc)
In this range of frequencies, intensity values range from 10−12 to 102 W m−2
So, intensity value are plotted on the axes in increments of 100 (10−12, 10−10, 10−8, 10−6, etc)
Loudness & Decibels
Intensity of a sound wave is defined as:
The amount of sound energy that passes a point per second per unit area
Intensity can be described by the equation:
Where
= intensity of sound wave (W m−2)
= power, or energy transferred per second (W)
= area through which sound waves pass (m2)
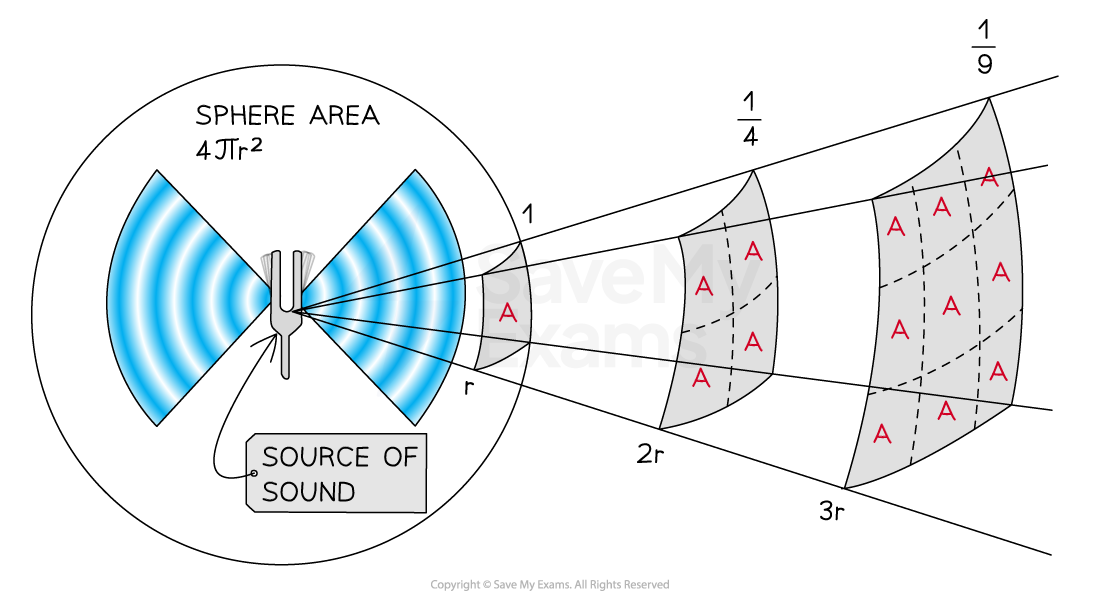
For a sound wave that spreads out uniformly in all directions, it can be assumed to propagate as a spherical shell
The surface area of a sphere is
The radius
of this sphere is equal to the distance between the source of the sound and the receiver
This means the intensity of the sound spreads out according to an inverse square law
Inverse Square Law of Sound Intensity

When the source of the sound is twice as far away, it has spread over four times the area, hence the intensity is four times smaller
The human ear can detect and respond to a very large range of intensities
The response of the ear to changes in sound intensity, or the perceived change in loudness, is directly proportional to the logarithm of the percentage change in intensity
perceived change in loudness
Where
= initial intensity of sound wave (W m−2)
= final intensity of sound wave (W m−2)
This is known as the logarithmic response of sound intensity
This means when the intensity of a sound doubles, and doubles again the loudness increases in fixed steps (for a given frequency)
For example, an increase in sound intensity from 1 × 10⁻¹² W m−2 to 2 × 10⁻¹² W m−2 is perceived to be the same change in loudness as 1 W m−2 to 2 W m−2
The threshold of hearing
is defined as:
The lowest intensity that a normal human ear can detect at a frequency of 1 kHz
This is equal to about 1 × 10⁻¹² W m−2
The intensity level of a sound can be defined as
intensity level = 10 log
Where:
Intensity level is measured in decibels (dB)
= intensity of the sound wave (W m−2)
= threshold of hearing intensity = 1 × 10⁻¹² W m−2
The threshold of hearing is assigned a sound level of 0 decibels, or 0 dB
An intensity level of 10 dB is 10 times louder than
, or 1 × 10⁻¹¹ W m−2
An intensity level of 20 dB is 100 times louder than
, or 1 × 10⁻¹⁰ W m−2
An intensity level of 30 dB is 1000 times louder than
, or 1 × 10⁻⁹ W m−2
Worked Example
Person A hears a sound of intensity level 95 dB. Person B hears the same sound at an intensity level of 82 dB whilst standing 20 m away from the source of the sound.
Calculate how far away person A is from the source of the sound.
Answer:
Step 1: Convert the intensity levels in dB into intensities
intensity level = 10 log
Intensity level of person A = 10 log
= 95 dB
Take logs of both sides:
Intensity level of person B = 10 log
= 82 dB
Take logs of both sides:
Step 2: Use the inverse square law of intensity to find the ratio of IA and IB
Intensity of a sound wave:
Since the source of the sound is the same, the value of power P is the same, so
Step 3: Rearrange and substitute values to find rA
Hence, person A is standing 4.5 m from the source of the sound
Worked Example
On the ground near an airport, the intensity level of an aircraft taking off is measured to be 120 dB.
Determine the intensity level, in dB, due to two aircraft taking off at the same time.
Threshold of hearing,
Answer:
Step 1: Convert the intensity level in dB into intensity
intensity level (dB) = 10 log
Intensity level due to each aircraft = 120 dB
Take logs of both sides:
Note: This is equivalent to
, but it is simpler to keep in terms of
Step 2: Add the intensities together to obtain the total intensity
Intensity due to both aircraft:
Step 3: Convert the intensity back into dB using the intensity level equation
intensity level (dB) =
intensity level due to both aircraft = 123 dB
Examiner Tips and Tricks
For two or more sounds, intensity levels in decibels cannot be added together to obtain a total intensity level, as this is not how logarithmic scales work. Remember to convert the values in decibels into intensities in W m−2, then you can add them together and convert back into decibels to obtain the intensity level of the combined sound waves.

Unlock more, it's free!
Did this page help you?