Probability Density Function (Cambridge (CIE) A Level Maths) : Revision Note

Did this video help you?
Calculating Probabilities using PDF
What is a probability density function (p.d.f.)?
For a continuous random variable , it is often possible to model probabilities using a function
This function is called a probability density function (p.d.f.)
For the continuous random variable,X , it would usually be denoted as a function of
 (such as f() or g() )
The distribution (or density) of probabilities can be illustrated by the graph of f(
)The graph does not need to start and end on the x-axis
For f(
) to represent a p.d.f. the following conditions must apply %3C%2Fmo%3E%3Cmo%3E%26%23x2265%3B%3C%2Fmo%3E%3Cmn%3E0%3C%2Fmn%3E%3C%2Fmstyle%3E%3C%2Fmath%3E--%3E%3Cdefs%3E%3Cstyle%20type%3D%22text%2Fcss%22%3E%40font-face%7Bfont-family%3A'math1070c425fd005e11aec1a90706d'%3Bsrc%3Aurl(data%3Afont%2Ftruetype%3Bcharset%3Dutf-8%3Bbase64%2CAAEAAAAMAIAAAwBAT1MvMi7iBBMAAADMAAAATmNtYXDEvmKUAAABHAAAADRjdnQgDVUNBwAAAVAAAAA6Z2x5ZoPi2VsAAAGMAAAAj2hlYWQQC2qxAAACHAAAADZoaGVhCGsXSAAAAlQAAAAkaG10eE2rRkcAAAJ4AAAACGxvY2EAHTwYAAACgAAAAAxtYXhwBT0FPgAAAowAAAAgbmFtZaBxlY4AAAKsAAABn3Bvc3QB9wD6AAAETAAAACBwcmVwa1uragAABGwAAAAUAAADSwGQAAUAAAQABAAAAAAABAAEAAAAAAAAAQEAAAAAAAAAAAAAAAAAAAAAAAAAAAAAAAAAAAAAACAgICAAAAAg1UADev96AAAD6ACWAAAAAAACAAEAAQAAABQAAwABAAAAFAAEACAAAAAEAAQAAQAAImX%2F%2FwAAImX%2F%2F92cAAEAAAAAAAABVAMsAIABAABWACoCWAIeAQ4BLAIsAFoBgAKAAKAA1ACAAAAAAAAAACsAVQCAAKsA1QEAASsABwAAAAIAVQAAAwADqwADAAcAADMRIRElIREhVQKr%2FasCAP4AA6v8VVUDAAADAID%2FqwKBAqsAAwAHAAsALxgBALEJAD%2BxCAXksQIF9LEBBPSxBgX0sQME5LEFBPSxBAX0sQcBEDyxAAYQPDAxARUBNRE1ARUBNSEVAoD%2BAAIB%2Ff8CAAGrVv8AVgGqVv8AVv5WVVUAAAEAAAABAADVeM5BXw889QADBAD%2F%2F%2F%2F%2F1joTc%2F%2F%2F%2F%2F%2FWOhNzAAD%2FIASAA6sAAAAKAAIAAQAAAAAAAQAAA%2Bj%2FagAAF3AAAP%2B2BIAAAQAAAAAAAAAAAAAAAAAAAAIDUgBVAwAAgAAAAAAAAAAoAAAAjwABAAAAAgBeAAUAAAAAAAIAgAQAAAAAAAQAAN4AAAAAAAAAFQECAAAAAAAAAAEAEgAAAAAAAAAAAAIADgASAAAAAAAAAAMAMAAgAAAAAAAAAAQAEgBQAAAAAAAAAAUAFgBiAAAAAAAAAAYACQB4AAAAAAAAAAgAHACBAAEAAAAAAAEAEgAAAAEAAAAAAAIADgASAAEAAAAAAAMAMAAgAAEAAAAAAAQAEgBQAAEAAAAAAAUAFgBiAAEAAAAAAAYACQB4AAEAAAAAAAgAHACBAAMAAQQJAAEAEgAAAAMAAQQJAAIADgASAAMAAQQJAAMAMAAgAAMAAQQJAAQAEgBQAAMAAQQJAAUAFgBiAAMAAQQJAAYACQB4AAMAAQQJAAgAHACBAE0AYQB0AGgAIABGAG8AbgB0AFIAZQBnAHUAbABhAHIATQBhAHQAaABzACAARgBvAHIAIABNAG8AcgBlACAATQBhAHQAaAAgAEYAbwBuAHQATQBhAHQAaAAgAEYAbwBuAHQAVgBlAHIAcwBpAG8AbgAgADEALgAwTWF0aF9Gb250AE0AYQB0AGgAcwAgAEYAbwByACAATQBvAHIAZQAAAwAAAAAAAAH0APoAAAAAAAAAAAAAAAAAAAAAAAAAALkHEQAAjYUYALIAAAAVFBOxAAE%2F)format('truetype')%3Bfont-weight%3Anormal%3Bfont-style%3Anormal%3B%7D%40font-face%7Bfont-family%3A'round_brackets18549f92a457f2409'%3Bsrc%3Aurl(data%3Afont%2Ftruetype%3Bcharset%3Dutf-8%3Bbase64%2CAAEAAAAMAIAAAwBAT1MvMjwHLFQAAADMAAAATmNtYXDf7xCrAAABHAAAADxjdnQgBAkDLgAAAVgAAAASZ2x5ZmAOz2cAAAFsAAABJGhlYWQOKih8AAACkAAAADZoaGVhCvgVwgAAAsgAAAAkaG10eCA6AAIAAALsAAAADGxvY2EAAARLAAAC%2BAAAABBtYXhwBIgEWQAAAwgAAAAgbmFtZXHR30MAAAMoAAACOXBvc3QDogHPAAAFZAAAACBwcmVwupWEAAAABYQAAAAHAAAGcgGQAAUAAAgACAAAAAAACAAIAAAAAAAAAQIAAAAAAAAAAAAAAAAAAAAAAAAAAAAAAAAAAAAAACAgICAAAAAo8AMGe%2F57AAAHPgGyAAAAAAACAAEAAQAAABQAAwABAAAAFAAEACgAAAAGAAQAAQACACgAKf%2F%2FAAAAKAAp%2F%2F%2F%2F2f%2FZAAEAAAAAAAAAAAFUAFYBAAAsAKgDgAAyAAcAAAACAAAAKgDVA1UAAwAHAAA1MxEjEyMRM9XVq4CAKgMr%2FQAC1QABAAD%2B0AIgBtAACQBNGAGwChCwA9SwAxCwAtSwChCwBdSwBRCwANSwAxCwBzywAhCwCDwAsAoQsAPUsAMQsAfUsAoQsAXUsAoQsADUsAMQsAI8sAcQsAg8MTAREAEzABEQASMAAZCQ%2FnABkJD%2BcALQ%2FZD%2BcAGQAnACcAGQ%2FnAAAQAA%2FtACIAbQAAkATRgBsAoQsAPUsAMQsALUsAoQsAXUsAUQsADUsAMQsAc8sAIQsAg8ALAKELAD1LADELAH1LAKELAF1LAKELAA1LADELACPLAHELAIPDEwARABIwAREAEzAAIg%2FnCQAZD%2BcJABkALQ%2FZD%2BcAGQAnACcAGQ%2FnAAAQAAAAEAAPW2NYFfDzz1AAMIAP%2F%2F%2F%2F%2FVre7u%2F%2F%2F%2F%2F9Wt7u4AAP7QA7cG0AAAAAoAAgABAAAAAAABAAAHPv5OAAAXcAAA%2F%2F4DtwABAAAAAAAAAAAAAAAAAAAAAwDVAAACIAAAAiAAAAAAAAAAAAAkAAAAowAAASQAAQAAAAMACgACAAAAAAACAIAEAAAAAAAEAABNAAAAAAAAABUBAgAAAAAAAAABAD4AAAAAAAAAAAACAA4APgAAAAAAAAADAFwATAAAAAAAAAAEAD4AqAAAAAAAAAAFABYA5gAAAAAAAAAGAB8A%2FAAAAAAAAAAIABwBGwABAAAAAAABAD4AAAABAAAAAAACAA4APgABAAAAAAADAFwATAABAAAAAAAEAD4AqAABAAAAAAAFABYA5gABAAAAAAAGAB8A%2FAABAAAAAAAIABwBGwADAAEECQABAD4AAAADAAEECQACAA4APgADAAEECQADAFwATAADAAEECQAEAD4AqAADAAEECQAFABYA5gADAAEECQAGAB8A%2FAADAAEECQAIABwBGwBSAG8AdQBuAGQAIABiAHIAYQBjAGsAZQB0AHMAIAB3AGkAdABoACAAYQBzAGMAZQBuAHQAIAAxADgANQA0AFIAZQBnAHUAbABhAHIATQBhAHQAaABzACAARgBvAHIAIABNAG8AcgBlACAAUgBvAHUAbgBkACAAYgByAGEAYwBrAGUAdABzACAAdwBpAHQAaAAgAGEAcwBjAGUAbgB0ACAAMQA4ADUANABSAG8AdQBuAGQAIABiAHIAYQBjAGsAZQB0AHMAIAB3AGkAdABoACAAYQBzAGMAZQBuAHQAIAAxADgANQA0AFYAZQByAHMAaQBvAG4AIAAyAC4AMFJvdW5kX2JyYWNrZXRzX3dpdGhfYXNjZW50XzE4NTQATQBhAHQAaABzACAARgBvAHIAIABNAG8AcgBlAAAAAAMAAAAAAAADnwHPAAAAAAAAAAAAAAAAAAAAAAAAAAC5B%2F8AAY2FAA%3D%3D)format('truetype')%3Bfont-weight%3Anormal%3Bfont-style%3Anormal%3B%7D%3C%2Fstyle%3E%3C%2Fdefs%3E%3Ctext%20font-family%3D%22Times%20New%20Roman%22%20font-size%3D%2216%22%20text-anchor%3D%22middle%22%20x%3D%222.5%22%20y%3D%2215%22%3Ef%3C%2Ftext%3E%3Ctext%20font-family%3D%22round_brackets18549f92a457f2409%22%20font-size%3D%2216%22%20text-anchor%3D%22middle%22%20x%3D%2210.5%22%20y%3D%2215%22%3E(%3C%2Ftext%3E%3Ctext%20font-family%3D%22Times%20New%20Roman%22%20font-size%3D%2216%22%20font-style%3D%22italic%22%20text-anchor%3D%22middle%22%20x%3D%2216.5%22%20y%3D%2215%22%3Ex%3C%2Ftext%3E%3Ctext%20font-family%3D%22round_brackets18549f92a457f2409%22%20font-size%3D%2216%22%20text-anchor%3D%22middle%22%20x%3D%2223.5%22%20y%3D%2215%22%3E)%3C%2Ftext%3E%3Ctext%20font-family%3D%22math1070c425fd005e11aec1a90706d%22%20font-size%3D%2214%22%20text-anchor%3D%22middle%22%20x%3D%2233.5%22%20y%3D%2215%22%3E%26%23x2265%3B%3C%2Ftext%3E%3Ctext%20font-family%3D%22Times%20New%20Roman%22%20font-size%3D%2216%22%20text-anchor%3D%22middle%22%20x%3D%2245.5%22%20y%3D%2215%22%3E0%3C%2Ftext%3E%3C%2Fsvg%3E) for all values of
for all values of This is the equivalent to
%3C%2Fmo%3E%3Cmo%3E%26%23x2265%3B%3C%2Fmo%3E%3Cmn%3E0%3C%2Fmn%3E%3C%2Fmstyle%3E%3C%2Fmath%3E--%3E%3Cdefs%3E%3Cstyle%20type%3D%22text%2Fcss%22%3E%40font-face%7Bfont-family%3A'math1d7f8e5e40db7230603be7e8c42'%3Bsrc%3Aurl(data%3Afont%2Ftruetype%3Bcharset%3Dutf-8%3Bbase64%2CAAEAAAAMAIAAAwBAT1MvMi7iBBMAAADMAAAATmNtYXDEvmKUAAABHAAAADxjdnQgDVUNBwAAAVgAAAA6Z2x5ZoPi2VsAAAGUAAABGWhlYWQQC2qxAAACsAAAADZoaGVhCGsXSAAAAugAAAAkaG10eE2rRkcAAAMMAAAADGxvY2EAHTwYAAADGAAAABBtYXhwBT0FPgAAAygAAAAgbmFtZaBxlY4AAANIAAABn3Bvc3QB9wD6AAAE6AAAACBwcmVwa1uragAABQgAAAAUAAADSwGQAAUAAAQABAAAAAAABAAEAAAAAAAAAQEAAAAAAAAAAAAAAAAAAAAAAAAAAAAAAAAAAAAAACAgICAAAAAg1UADev96AAAD6ACWAAAAAAACAAEAAQAAABQAAwABAAAAFAAEACgAAAAGAAQAAQACAD0iZf%2F%2FAAAAPSJl%2F%2F%2F%2FxN2dAAEAAAAAAAAAAAFUAywAgAEAAFYAKgJYAh4BDgEsAiwAWgGAAoAAoADUAIAAAAAAAAAAKwBVAIAAqwDVAQABKwAHAAAAAgBVAAADAAOrAAMABwAAMxEhESUhESFVAqv9qwIA%2FgADq%2FxVVQMAAAIAgADrAtUCFQADAAcAZRgBsAgQsAbUsAYQsAXUsAgQsAHUsAEQsADUsAYQsAc8sAUQsAQ8sAEQsAI8sAAQsAM8ALAIELAG1LAGELAH1LAHELAB1LABELAC1LAGELAFPLAHELAEPLABELAAPLACELADPDEwEyE1IR0BITWAAlX9qwJVAcBV1VVVAAMAgP%2BrAoECqwADAAcACwAvGAEAsQkAP7EIBeSxAgX0sQEE9LEGBfSxAwTksQUE9LEEBfSxBwEQPLEABhA8MDEBFQE1ETUBFQE1IRUCgP4AAgH9%2FwIAAatW%2FwBWAapW%2FwBW%2FlZVVQAAAAABAAAAAQAA1XjOQV8PPPUAAwQA%2F%2F%2F%2F%2F9Y6E3P%2F%2F%2F%2F%2F1joTcwAA%2FyAEgAOrAAAACgACAAEAAAAAAAEAAAPo%2F2oAABdwAAD%2FtgSAAAEAAAAAAAAAAAAAAAAAAAADA1IAVQNWAIADAACAAAAAAAAAACgAAACyAAABGQABAAAAAwBeAAUAAAAAAAIAgAQAAAAAAAQAAN4AAAAAAAAAFQECAAAAAAAAAAEAEgAAAAAAAAAAAAIADgASAAAAAAAAAAMAMAAgAAAAAAAAAAQAEgBQAAAAAAAAAAUAFgBiAAAAAAAAAAYACQB4AAAAAAAAAAgAHACBAAEAAAAAAAEAEgAAAAEAAAAAAAIADgASAAEAAAAAAAMAMAAgAAEAAAAAAAQAEgBQAAEAAAAAAAUAFgBiAAEAAAAAAAYACQB4AAEAAAAAAAgAHACBAAMAAQQJAAEAEgAAAAMAAQQJAAIADgASAAMAAQQJAAMAMAAgAAMAAQQJAAQAEgBQAAMAAQQJAAUAFgBiAAMAAQQJAAYACQB4AAMAAQQJAAgAHACBAE0AYQB0AGgAIABGAG8AbgB0AFIAZQBnAHUAbABhAHIATQBhAHQAaABzACAARgBvAHIAIABNAG8AcgBlACAATQBhAHQAaAAgAEYAbwBuAHQATQBhAHQAaAAgAEYAbwBuAHQAVgBlAHIAcwBpAG8AbgAgADEALgAwTWF0aF9Gb250AE0AYQB0AGgAcwAgAEYAbwByACAATQBvAHIAZQAAAwAAAAAAAAH0APoAAAAAAAAAAAAAAAAAAAAAAAAAALkHEQAAjYUYALIAAAAVFBOxAAE%2F)format('truetype')%3Bfont-weight%3Anormal%3Bfont-style%3Anormal%3B%7D%40font-face%7Bfont-family%3A'round_brackets18549f92a457f2409'%3Bsrc%3Aurl(data%3Afont%2Ftruetype%3Bcharset%3Dutf-8%3Bbase64%2CAAEAAAAMAIAAAwBAT1MvMjwHLFQAAADMAAAATmNtYXDf7xCrAAABHAAAADxjdnQgBAkDLgAAAVgAAAASZ2x5ZmAOz2cAAAFsAAABJGhlYWQOKih8AAACkAAAADZoaGVhCvgVwgAAAsgAAAAkaG10eCA6AAIAAALsAAAADGxvY2EAAARLAAAC%2BAAAABBtYXhwBIgEWQAAAwgAAAAgbmFtZXHR30MAAAMoAAACOXBvc3QDogHPAAAFZAAAACBwcmVwupWEAAAABYQAAAAHAAAGcgGQAAUAAAgACAAAAAAACAAIAAAAAAAAAQIAAAAAAAAAAAAAAAAAAAAAAAAAAAAAAAAAAAAAACAgICAAAAAo8AMGe%2F57AAAHPgGyAAAAAAACAAEAAQAAABQAAwABAAAAFAAEACgAAAAGAAQAAQACACgAKf%2F%2FAAAAKAAp%2F%2F%2F%2F2f%2FZAAEAAAAAAAAAAAFUAFYBAAAsAKgDgAAyAAcAAAACAAAAKgDVA1UAAwAHAAA1MxEjEyMRM9XVq4CAKgMr%2FQAC1QABAAD%2B0AIgBtAACQBNGAGwChCwA9SwAxCwAtSwChCwBdSwBRCwANSwAxCwBzywAhCwCDwAsAoQsAPUsAMQsAfUsAoQsAXUsAoQsADUsAMQsAI8sAcQsAg8MTAREAEzABEQASMAAZCQ%2FnABkJD%2BcALQ%2FZD%2BcAGQAnACcAGQ%2FnAAAQAA%2FtACIAbQAAkATRgBsAoQsAPUsAMQsALUsAoQsAXUsAUQsADUsAMQsAc8sAIQsAg8ALAKELAD1LADELAH1LAKELAF1LAKELAA1LADELACPLAHELAIPDEwARABIwAREAEzAAIg%2FnCQAZD%2BcJABkALQ%2FZD%2BcAGQAnACcAGQ%2FnAAAQAAAAEAAPW2NYFfDzz1AAMIAP%2F%2F%2F%2F%2FVre7u%2F%2F%2F%2F%2F9Wt7u4AAP7QA7cG0AAAAAoAAgABAAAAAAABAAAHPv5OAAAXcAAA%2F%2F4DtwABAAAAAAAAAAAAAAAAAAAAAwDVAAACIAAAAiAAAAAAAAAAAAAkAAAAowAAASQAAQAAAAMACgACAAAAAAACAIAEAAAAAAAEAABNAAAAAAAAABUBAgAAAAAAAAABAD4AAAAAAAAAAAACAA4APgAAAAAAAAADAFwATAAAAAAAAAAEAD4AqAAAAAAAAAAFABYA5gAAAAAAAAAGAB8A%2FAAAAAAAAAAIABwBGwABAAAAAAABAD4AAAABAAAAAAACAA4APgABAAAAAAADAFwATAABAAAAAAAEAD4AqAABAAAAAAAFABYA5gABAAAAAAAGAB8A%2FAABAAAAAAAIABwBGwADAAEECQABAD4AAAADAAEECQACAA4APgADAAEECQADAFwATAADAAEECQAEAD4AqAADAAEECQAFABYA5gADAAEECQAGAB8A%2FAADAAEECQAIABwBGwBSAG8AdQBuAGQAIABiAHIAYQBjAGsAZQB0AHMAIAB3AGkAdABoACAAYQBzAGMAZQBuAHQAIAAxADgANQA0AFIAZQBnAHUAbABhAHIATQBhAHQAaABzACAARgBvAHIAIABNAG8AcgBlACAAUgBvAHUAbgBkACAAYgByAGEAYwBrAGUAdABzACAAdwBpAHQAaAAgAGEAcwBjAGUAbgB0ACAAMQA4ADUANABSAG8AdQBuAGQAIABiAHIAYQBjAGsAZQB0AHMAIAB3AGkAdABoACAAYQBzAGMAZQBuAHQAIAAxADgANQA0AFYAZQByAHMAaQBvAG4AIAAyAC4AMFJvdW5kX2JyYWNrZXRzX3dpdGhfYXNjZW50XzE4NTQATQBhAHQAaABzACAARgBvAHIAIABNAG8AcgBlAAAAAAMAAAAAAAADnwHPAAAAAAAAAAAAAAAAAAAAAAAAAAC5B%2F8AAY2FAA%3D%3D)format('truetype')%3Bfont-weight%3Anormal%3Bfont-style%3Anormal%3B%7D%3C%2Fstyle%3E%3C%2Fdefs%3E%3Ctext%20font-family%3D%22Times%20New%20Roman%22%20font-size%3D%2216%22%20font-style%3D%22italic%22%20text-anchor%3D%22middle%22%20x%3D%224.5%22%20y%3D%2215%22%3EP%3C%2Ftext%3E%3Ctext%20font-family%3D%22round_brackets18549f92a457f2409%22%20font-size%3D%2216%22%20text-anchor%3D%22middle%22%20x%3D%2213.5%22%20y%3D%2215%22%3E(%3C%2Ftext%3E%3Ctext%20font-family%3D%22Times%20New%20Roman%22%20font-size%3D%2216%22%20font-style%3D%22italic%22%20text-anchor%3D%22middle%22%20x%3D%2221.5%22%20y%3D%2215%22%3EX%3C%2Ftext%3E%3Ctext%20font-family%3D%22math1d7f8e5e40db7230603be7e8c42%22%20font-size%3D%2214%22%20text-anchor%3D%22middle%22%20x%3D%2236.5%22%20y%3D%2215%22%3E%3D%3C%2Ftext%3E%3Ctext%20font-family%3D%22Times%20New%20Roman%22%20font-size%3D%2216%22%20font-style%3D%22italic%22%20text-anchor%3D%22middle%22%20x%3D%2248.5%22%20y%3D%2215%22%3Ex%3C%2Ftext%3E%3Ctext%20font-family%3D%22round_brackets18549f92a457f2409%22%20font-size%3D%2216%22%20text-anchor%3D%22middle%22%20x%3D%2255.5%22%20y%3D%2215%22%3E)%3C%2Ftext%3E%3Ctext%20font-family%3D%22math1d7f8e5e40db7230603be7e8c42%22%20font-size%3D%2214%22%20text-anchor%3D%22middle%22%20x%3D%2265.5%22%20y%3D%2215%22%3E%26%23x2265%3B%3C%2Ftext%3E%3Ctext%20font-family%3D%22Times%20New%20Roman%22%20font-size%3D%2216%22%20text-anchor%3D%22middle%22%20x%3D%2277.5%22%20y%3D%2215%22%3E0%3C%2Ftext%3E%3C%2Fsvg%3E) for a discrete random variable
for a discrete random variable
The area under the graph must total 1
![]()
This is equivalent to

%3C%2Fmo%3E%3Cmo%3E%3D%3C%2Fmo%3E%3Cmn%3E1%3C%2Fmn%3E%3C%2Fmstyle%3E%3C%2Fmath%3E--%3E%3Cdefs%3E%3Cstyle%20type%3D%22text%2Fcss%22%3E%40font-face%7Bfont-family%3A'math17f39f8317fbdb1988ef4c628eb'%3Bsrc%3Aurl(data%3Afont%2Ftruetype%3Bcharset%3Dutf-8%3Bbase64%2CAAEAAAAMAIAAAwBAT1MvMi7iBBMAAADMAAAATmNtYXDEvmKUAAABHAAAADRjdnQgDVUNBwAAAVAAAAA6Z2x5ZoPi2VsAAAGMAAAAsmhlYWQQC2qxAAACQAAAADZoaGVhCGsXSAAAAngAAAAkaG10eE2rRkcAAAKcAAAACGxvY2EAHTwYAAACpAAAAAxtYXhwBT0FPgAAArAAAAAgbmFtZaBxlY4AAALQAAABn3Bvc3QB9wD6AAAEcAAAACBwcmVwa1uragAABJAAAAAUAAADSwGQAAUAAAQABAAAAAAABAAEAAAAAAAAAQEAAAAAAAAAAAAAAAAAAAAAAAAAAAAAAAAAAAAAACAgICAAAAAg1UADev96AAAD6ACWAAAAAAACAAEAAQAAABQAAwABAAAAFAAEACAAAAAEAAQAAQAAAD3%2F%2FwAAAD3%2F%2F%2F%2FEAAEAAAAAAAABVAMsAIABAABWACoCWAIeAQ4BLAIsAFoBgAKAAKAA1ACAAAAAAAAAACsAVQCAAKsA1QEAASsABwAAAAIAVQAAAwADqwADAAcAADMRIRElIREhVQKr%2FasCAP4AA6v8VVUDAAACAIAA6wLVAhUAAwAHAGUYAbAIELAG1LAGELAF1LAIELAB1LABELAA1LAGELAHPLAFELAEPLABELACPLAAELADPACwCBCwBtSwBhCwB9SwBxCwAdSwARCwAtSwBhCwBTywBxCwBDywARCwADywAhCwAzwxMBMhNSEdASE1gAJV%2FasCVQHAVdVVVQAAAAEAAAABAADVeM5BXw889QADBAD%2F%2F%2F%2F%2F1joTc%2F%2F%2F%2F%2F%2FWOhNzAAD%2FIASAA6sAAAAKAAIAAQAAAAAAAQAAA%2Bj%2FagAAF3AAAP%2B2BIAAAQAAAAAAAAAAAAAAAAAAAAIDUgBVA1YAgAAAAAAAAAAoAAAAsgABAAAAAgBeAAUAAAAAAAIAgAQAAAAAAAQAAN4AAAAAAAAAFQECAAAAAAAAAAEAEgAAAAAAAAAAAAIADgASAAAAAAAAAAMAMAAgAAAAAAAAAAQAEgBQAAAAAAAAAAUAFgBiAAAAAAAAAAYACQB4AAAAAAAAAAgAHACBAAEAAAAAAAEAEgAAAAEAAAAAAAIADgASAAEAAAAAAAMAMAAgAAEAAAAAAAQAEgBQAAEAAAAAAAUAFgBiAAEAAAAAAAYACQB4AAEAAAAAAAgAHACBAAMAAQQJAAEAEgAAAAMAAQQJAAIADgASAAMAAQQJAAMAMAAgAAMAAQQJAAQAEgBQAAMAAQQJAAUAFgBiAAMAAQQJAAYACQB4AAMAAQQJAAgAHACBAE0AYQB0AGgAIABGAG8AbgB0AFIAZQBnAHUAbABhAHIATQBhAHQAaABzACAARgBvAHIAIABNAG8AcgBlACAATQBhAHQAaAAgAEYAbwBuAHQATQBhAHQAaAAgAEYAbwBuAHQAVgBlAHIAcwBpAG8AbgAgADEALgAwTWF0aF9Gb250AE0AYQB0AGgAcwAgAEYAbwByACAATQBvAHIAZQAAAwAAAAAAAAH0APoAAAAAAAAAAAAAAAAAAAAAAAAAALkHEQAAjYUYALIAAAAVFBOxAAE%2F)format('truetype')%3Bfont-weight%3Anormal%3Bfont-style%3Anormal%3B%7D%40font-face%7Bfont-family%3A'round_brackets18549f92a457f2409'%3Bsrc%3Aurl(data%3Afont%2Ftruetype%3Bcharset%3Dutf-8%3Bbase64%2CAAEAAAAMAIAAAwBAT1MvMjwHLFQAAADMAAAATmNtYXDf7xCrAAABHAAAADxjdnQgBAkDLgAAAVgAAAASZ2x5ZmAOz2cAAAFsAAABJGhlYWQOKih8AAACkAAAADZoaGVhCvgVwgAAAsgAAAAkaG10eCA6AAIAAALsAAAADGxvY2EAAARLAAAC%2BAAAABBtYXhwBIgEWQAAAwgAAAAgbmFtZXHR30MAAAMoAAACOXBvc3QDogHPAAAFZAAAACBwcmVwupWEAAAABYQAAAAHAAAGcgGQAAUAAAgACAAAAAAACAAIAAAAAAAAAQIAAAAAAAAAAAAAAAAAAAAAAAAAAAAAAAAAAAAAACAgICAAAAAo8AMGe%2F57AAAHPgGyAAAAAAACAAEAAQAAABQAAwABAAAAFAAEACgAAAAGAAQAAQACACgAKf%2F%2FAAAAKAAp%2F%2F%2F%2F2f%2FZAAEAAAAAAAAAAAFUAFYBAAAsAKgDgAAyAAcAAAACAAAAKgDVA1UAAwAHAAA1MxEjEyMRM9XVq4CAKgMr%2FQAC1QABAAD%2B0AIgBtAACQBNGAGwChCwA9SwAxCwAtSwChCwBdSwBRCwANSwAxCwBzywAhCwCDwAsAoQsAPUsAMQsAfUsAoQsAXUsAoQsADUsAMQsAI8sAcQsAg8MTAREAEzABEQASMAAZCQ%2FnABkJD%2BcALQ%2FZD%2BcAGQAnACcAGQ%2FnAAAQAA%2FtACIAbQAAkATRgBsAoQsAPUsAMQsALUsAoQsAXUsAUQsADUsAMQsAc8sAIQsAg8ALAKELAD1LADELAH1LAKELAF1LAKELAA1LADELACPLAHELAIPDEwARABIwAREAEzAAIg%2FnCQAZD%2BcJABkALQ%2FZD%2BcAGQAnACcAGQ%2FnAAAQAAAAEAAPW2NYFfDzz1AAMIAP%2F%2F%2F%2F%2FVre7u%2F%2F%2F%2F%2F9Wt7u4AAP7QA7cG0AAAAAoAAgABAAAAAAABAAAHPv5OAAAXcAAA%2F%2F4DtwABAAAAAAAAAAAAAAAAAAAAAwDVAAACIAAAAiAAAAAAAAAAAAAkAAAAowAAASQAAQAAAAMACgACAAAAAAACAIAEAAAAAAAEAABNAAAAAAAAABUBAgAAAAAAAAABAD4AAAAAAAAAAAACAA4APgAAAAAAAAADAFwATAAAAAAAAAAEAD4AqAAAAAAAAAAFABYA5gAAAAAAAAAGAB8A%2FAAAAAAAAAAIABwBGwABAAAAAAABAD4AAAABAAAAAAACAA4APgABAAAAAAADAFwATAABAAAAAAAEAD4AqAABAAAAAAAFABYA5gABAAAAAAAGAB8A%2FAABAAAAAAAIABwBGwADAAEECQABAD4AAAADAAEECQACAA4APgADAAEECQADAFwATAADAAEECQAEAD4AqAADAAEECQAFABYA5gADAAEECQAGAB8A%2FAADAAEECQAIABwBGwBSAG8AdQBuAGQAIABiAHIAYQBjAGsAZQB0AHMAIAB3AGkAdABoACAAYQBzAGMAZQBuAHQAIAAxADgANQA0AFIAZQBnAHUAbABhAHIATQBhAHQAaABzACAARgBvAHIAIABNAG8AcgBlACAAUgBvAHUAbgBkACAAYgByAGEAYwBrAGUAdABzACAAdwBpAHQAaAAgAGEAcwBjAGUAbgB0ACAAMQA4ADUANABSAG8AdQBuAGQAIABiAHIAYQBjAGsAZQB0AHMAIAB3AGkAdABoACAAYQBzAGMAZQBuAHQAIAAxADgANQA0AFYAZQByAHMAaQBvAG4AIAAyAC4AMFJvdW5kX2JyYWNrZXRzX3dpdGhfYXNjZW50XzE4NTQATQBhAHQAaABzACAARgBvAHIAIABNAG8AcgBlAAAAAAMAAAAAAAADnwHPAAAAAAAAAAAAAAAAAAAAAAAAAAC5B%2F8AAY2FAA%3D%3D)format('truetype')%3Bfont-weight%3Anormal%3Bfont-style%3Anormal%3B%7D%3C%2Fstyle%3E%3C%2Fdefs%3E%3Ctext%20font-family%3D%22Times%20New%20Roman%22%20font-size%3D%2216%22%20text-anchor%3D%22middle%22%20x%3D%224.5%22%20y%3D%2215%22%3EP%3C%2Ftext%3E%3Ctext%20font-family%3D%22round_brackets18549f92a457f2409%22%20font-size%3D%2216%22%20text-anchor%3D%22middle%22%20x%3D%2212.5%22%20y%3D%2215%22%3E(%3C%2Ftext%3E%3Ctext%20font-family%3D%22Times%20New%20Roman%22%20font-size%3D%2216%22%20font-style%3D%22italic%22%20text-anchor%3D%22middle%22%20x%3D%2220.5%22%20y%3D%2215%22%3EX%3C%2Ftext%3E%3Ctext%20font-family%3D%22math17f39f8317fbdb1988ef4c628eb%22%20font-size%3D%2214%22%20text-anchor%3D%22middle%22%20x%3D%2235.5%22%20y%3D%2215%22%3E%3D%3C%2Ftext%3E%3Ctext%20font-family%3D%22Times%20New%20Roman%22%20font-size%3D%2216%22%20font-style%3D%22italic%22%20text-anchor%3D%22middle%22%20x%3D%2247.5%22%20y%3D%2215%22%3Ex%3C%2Ftext%3E%3Ctext%20font-family%3D%22round_brackets18549f92a457f2409%22%20font-size%3D%2216%22%20text-anchor%3D%22middle%22%20x%3D%2254.5%22%20y%3D%2215%22%3E)%3C%2Ftext%3E%3Ctext%20font-family%3D%22math17f39f8317fbdb1988ef4c628eb%22%20font-size%3D%2214%22%20text-anchor%3D%22middle%22%20x%3D%2265.5%22%20y%3D%2215%22%3E%3D%3C%2Ftext%3E%3Ctext%20font-family%3D%22Times%20New%20Roman%22%20font-size%3D%2216%22%20text-anchor%3D%22middle%22%20x%3D%2277.5%22%20y%3D%2215%22%3E1%3C%2Ftext%3E%3C%2Fsvg%3E) for a discrete random variable
for a discrete random variable
How do I find probabilities using a probability density function (p.d.f.)?
The probability that the continuous random variable
 lies in the interval
format('truetype')%3Bfont-weight%3Anormal%3Bfont-style%3Anormal%3B%7D%3C%2Fstyle%3E%3C%2Fdefs%3E%3Ctext%20font-family%3D%22Times%20New%20Roman%22%20font-size%3D%2216%22%20font-style%3D%22italic%22%20text-anchor%3D%22middle%22%20x%3D%223.5%22%20y%3D%2215%22%3Ea%3C%2Ftext%3E%3Ctext%20font-family%3D%22math1a36adbc35e69b22acbf9f834a0%22%20font-size%3D%2214%22%20text-anchor%3D%22middle%22%20x%3D%2215.5%22%20y%3D%2215%22%3E%26%23x2264%3B%3C%2Ftext%3E%3Ctext%20font-family%3D%22Times%20New%20Roman%22%20font-size%3D%2216%22%20font-style%3D%22italic%22%20text-anchor%3D%22middle%22%20x%3D%2229.5%22%20y%3D%2215%22%3EX%3C%2Ftext%3E%3Ctext%20font-family%3D%22math1a36adbc35e69b22acbf9f834a0%22%20font-size%3D%2214%22%20text-anchor%3D%22middle%22%20x%3D%2243.5%22%20y%3D%2215%22%3E%26%23x2264%3B%3C%2Ftext%3E%3Ctext%20font-family%3D%22Times%20New%20Roman%22%20font-size%3D%2216%22%20font-style%3D%22italic%22%20text-anchor%3D%22middle%22%20x%3D%2255.5%22%20y%3D%2215%22%3Eb%3C%2Ftext%3E%3C%2Fsvg%3E) , where has the probability density function f() , is given by
, where has the probability density function f() , is given by
![]()
As with the normal distribution
%3C%2Fmo%3E%3Cmo%3E%3D%3C%2Fmo%3E%3Cmi%3EP%3C%2Fmi%3E%3Cmo%3E(%3C%2Fmo%3E%3Cmi%3Ea%3C%2Fmi%3E%3Cmo%3E%26lt%3B%3C%2Fmo%3E%3Cmi%3EX%3C%2Fmi%3E%3Cmo%3E%26lt%3B%3C%2Fmo%3E%3Cmi%3Eb%3C%2Fmi%3E%3Cmo%3E)%3C%2Fmo%3E%3C%2Fmstyle%3E%3C%2Fmath%3E--%3E%3Cdefs%3E%3Cstyle%20type%3D%22text%2Fcss%22%3E%40font-face%7Bfont-family%3A'math11daff391a550f9600c8318be97'%3Bsrc%3Aurl(data%3Afont%2Ftruetype%3Bcharset%3Dutf-8%3Bbase64%2CAAEAAAAMAIAAAwBAT1MvMi7iBBMAAADMAAAATmNtYXDEvmKUAAABHAAAAERjdnQgDVUNBwAAAWAAAAA6Z2x5ZoPi2VsAAAGcAAABv2hlYWQQC2qxAAADXAAAADZoaGVhCGsXSAAAA5QAAAAkaG10eE2rRkcAAAO4AAAAEGxvY2EAHTwYAAADyAAAABRtYXhwBT0FPgAAA9wAAAAgbmFtZaBxlY4AAAP8AAABn3Bvc3QB9wD6AAAFnAAAACBwcmVwa1uragAABbwAAAAUAAADSwGQAAUAAAQABAAAAAAABAAEAAAAAAAAAQEAAAAAAAAAAAAAAAAAAAAAAAAAAAAAAAAAAAAAACAgICAAAAAg1UADev96AAAD6ACWAAAAAAACAAEAAQAAABQAAwABAAAAFAAEADAAAAAIAAgAAgAAADwAPSJk%2F%2F8AAAA8AD0iZP%2F%2F%2F8X%2Fxd2fAAEAAAAAAAAAAAAAAVQDLACAAQAAVgAqAlgCHgEOASwCLABaAYACgACgANQAgAAAAAAAAAArAFUAgACrANUBAAErAAcAAAACAFUAAAMAA6sAAwAHAAAzESERJSERIVUCq%2F2rAgD%2BAAOr%2FFVVAwAAAgCAAFUCgAKrAAUACwBsGLBBGgCxAAATELEABuSxAAETELAJPLEBBfWwCjywABCxBQP1sQIF7bEEA%2FWxAwXtsAoQsQsD9bEIBe2xBgP1sQcF7QGwDBCxAQP2sgkACjw8PLEFBPWyAggLPDw8sQQE9bIGBwM8PDyxDQPmEwcFFzUnATUNARc3gQEBAP%2F%2FAQD%2FAP8AAf8Bq1aAgFaAASpWgIBWgAACAIAA6wLVAhUAAwAHAGUYAbAIELAG1LAGELAF1LAIELAB1LABELAA1LAGELAHPLAFELAEPLABELACPLAAELADPACwCBCwBtSwBhCwB9SwBxCwAdSwARCwAtSwBhCwBTywBxCwBDywARCwADywAhCwAzwxMBMhNSEdASE1gAJV%2FasCVQHAVdVVVQADAID%2FqwKAAqsAAwAHAAsALxgBALEJAD%2BxCAXksQIF9LEBBPSxBgX0sQME5LEFBPSxBAX0sQcBEDyxAAYQPDAxEwcBNRM1ARcBNSEVgQEB%2FwH%2BAAEB%2F%2F4AAatW%2FwBWAapW%2FwBW%2FlZVVQAAAQAAAAEAANV4zkFfDzz1AAMEAP%2F%2F%2F%2F%2FWOhNz%2F%2F%2F%2F%2F9Y6E3MAAP8gBIADqwAAAAoAAgABAAAAAAABAAAD6P9qAAAXcAAA%2F7YEgAABAAAAAAAAAAAAAAAAAAAABANSAFUDAACAA1YAgAMAAIAAAAAAAAAAKAAAAMwAAAFWAAABvwABAAAABABeAAUAAAAAAAIAgAQAAAAAAAQAAN4AAAAAAAAAFQECAAAAAAAAAAEAEgAAAAAAAAAAAAIADgASAAAAAAAAAAMAMAAgAAAAAAAAAAQAEgBQAAAAAAAAAAUAFgBiAAAAAAAAAAYACQB4AAAAAAAAAAgAHACBAAEAAAAAAAEAEgAAAAEAAAAAAAIADgASAAEAAAAAAAMAMAAgAAEAAAAAAAQAEgBQAAEAAAAAAAUAFgBiAAEAAAAAAAYACQB4AAEAAAAAAAgAHACBAAMAAQQJAAEAEgAAAAMAAQQJAAIADgASAAMAAQQJAAMAMAAgAAMAAQQJAAQAEgBQAAMAAQQJAAUAFgBiAAMAAQQJAAYACQB4AAMAAQQJAAgAHACBAE0AYQB0AGgAIABGAG8AbgB0AFIAZQBnAHUAbABhAHIATQBhAHQAaABzACAARgBvAHIAIABNAG8AcgBlACAATQBhAHQAaAAgAEYAbwBuAHQATQBhAHQAaAAgAEYAbwBuAHQAVgBlAHIAcwBpAG8AbgAgADEALgAwTWF0aF9Gb250AE0AYQB0AGgAcwAgAEYAbwByACAATQBvAHIAZQAAAwAAAAAAAAH0APoAAAAAAAAAAAAAAAAAAAAAAAAAALkHEQAAjYUYALIAAAAVFBOxAAE%2F)format('truetype')%3Bfont-weight%3Anormal%3Bfont-style%3Anormal%3B%7D%40font-face%7Bfont-family%3A'round_brackets18549f92a457f2409'%3Bsrc%3Aurl(data%3Afont%2Ftruetype%3Bcharset%3Dutf-8%3Bbase64%2CAAEAAAAMAIAAAwBAT1MvMjwHLFQAAADMAAAATmNtYXDf7xCrAAABHAAAADxjdnQgBAkDLgAAAVgAAAASZ2x5ZmAOz2cAAAFsAAABJGhlYWQOKih8AAACkAAAADZoaGVhCvgVwgAAAsgAAAAkaG10eCA6AAIAAALsAAAADGxvY2EAAARLAAAC%2BAAAABBtYXhwBIgEWQAAAwgAAAAgbmFtZXHR30MAAAMoAAACOXBvc3QDogHPAAAFZAAAACBwcmVwupWEAAAABYQAAAAHAAAGcgGQAAUAAAgACAAAAAAACAAIAAAAAAAAAQIAAAAAAAAAAAAAAAAAAAAAAAAAAAAAAAAAAAAAACAgICAAAAAo8AMGe%2F57AAAHPgGyAAAAAAACAAEAAQAAABQAAwABAAAAFAAEACgAAAAGAAQAAQACACgAKf%2F%2FAAAAKAAp%2F%2F%2F%2F2f%2FZAAEAAAAAAAAAAAFUAFYBAAAsAKgDgAAyAAcAAAACAAAAKgDVA1UAAwAHAAA1MxEjEyMRM9XVq4CAKgMr%2FQAC1QABAAD%2B0AIgBtAACQBNGAGwChCwA9SwAxCwAtSwChCwBdSwBRCwANSwAxCwBzywAhCwCDwAsAoQsAPUsAMQsAfUsAoQsAXUsAoQsADUsAMQsAI8sAcQsAg8MTAREAEzABEQASMAAZCQ%2FnABkJD%2BcALQ%2FZD%2BcAGQAnACcAGQ%2FnAAAQAA%2FtACIAbQAAkATRgBsAoQsAPUsAMQsALUsAoQsAXUsAUQsADUsAMQsAc8sAIQsAg8ALAKELAD1LADELAH1LAKELAF1LAKELAA1LADELACPLAHELAIPDEwARABIwAREAEzAAIg%2FnCQAZD%2BcJABkALQ%2FZD%2BcAGQAnACcAGQ%2FnAAAQAAAAEAAPW2NYFfDzz1AAMIAP%2F%2F%2F%2F%2FVre7u%2F%2F%2F%2F%2F9Wt7u4AAP7QA7cG0AAAAAoAAgABAAAAAAABAAAHPv5OAAAXcAAA%2F%2F4DtwABAAAAAAAAAAAAAAAAAAAAAwDVAAACIAAAAiAAAAAAAAAAAAAkAAAAowAAASQAAQAAAAMACgACAAAAAAACAIAEAAAAAAAEAABNAAAAAAAAABUBAgAAAAAAAAABAD4AAAAAAAAAAAACAA4APgAAAAAAAAADAFwATAAAAAAAAAAEAD4AqAAAAAAAAAAFABYA5gAAAAAAAAAGAB8A%2FAAAAAAAAAAIABwBGwABAAAAAAABAD4AAAABAAAAAAACAA4APgABAAAAAAADAFwATAABAAAAAAAEAD4AqAABAAAAAAAFABYA5gABAAAAAAAGAB8A%2FAABAAAAAAAIABwBGwADAAEECQABAD4AAAADAAEECQACAA4APgADAAEECQADAFwATAADAAEECQAEAD4AqAADAAEECQAFABYA5gADAAEECQAGAB8A%2FAADAAEECQAIABwBGwBSAG8AdQBuAGQAIABiAHIAYQBjAGsAZQB0AHMAIAB3AGkAdABoACAAYQBzAGMAZQBuAHQAIAAxADgANQA0AFIAZQBnAHUAbABhAHIATQBhAHQAaABzACAARgBvAHIAIABNAG8AcgBlACAAUgBvAHUAbgBkACAAYgByAGEAYwBrAGUAdABzACAAdwBpAHQAaAAgAGEAcwBjAGUAbgB0ACAAMQA4ADUANABSAG8AdQBuAGQAIABiAHIAYQBjAGsAZQB0AHMAIAB3AGkAdABoACAAYQBzAGMAZQBuAHQAIAAxADgANQA0AFYAZQByAHMAaQBvAG4AIAAyAC4AMFJvdW5kX2JyYWNrZXRzX3dpdGhfYXNjZW50XzE4NTQATQBhAHQAaABzACAARgBvAHIAIABNAG8AcgBlAAAAAAMAAAAAAAADnwHPAAAAAAAAAAAAAAAAAAAAAAAAAAC5B%2F8AAY2FAA%3D%3D)format('truetype')%3Bfont-weight%3Anormal%3Bfont-style%3Anormal%3B%7D%3C%2Fstyle%3E%3C%2Fdefs%3E%3Ctext%20font-family%3D%22Times%20New%20Roman%22%20font-size%3D%2216%22%20font-style%3D%22italic%22%20text-anchor%3D%22middle%22%20x%3D%224.5%22%20y%3D%2215%22%3EP%3C%2Ftext%3E%3Ctext%20font-family%3D%22round_brackets18549f92a457f2409%22%20font-size%3D%2216%22%20text-anchor%3D%22middle%22%20x%3D%2213.5%22%20y%3D%2215%22%3E(%3C%2Ftext%3E%3Ctext%20font-family%3D%22Times%20New%20Roman%22%20font-size%3D%2216%22%20font-style%3D%22italic%22%20text-anchor%3D%22middle%22%20x%3D%2218.5%22%20y%3D%2215%22%3Ea%3C%2Ftext%3E%3Ctext%20font-family%3D%22math11daff391a550f9600c8318be97%22%20font-size%3D%2214%22%20text-anchor%3D%22middle%22%20x%3D%2230.5%22%20y%3D%2215%22%3E%26%23x2264%3B%3C%2Ftext%3E%3Ctext%20font-family%3D%22Times%20New%20Roman%22%20font-size%3D%2216%22%20font-style%3D%22italic%22%20text-anchor%3D%22middle%22%20x%3D%2244.5%22%20y%3D%2215%22%3EX%3C%2Ftext%3E%3Ctext%20font-family%3D%22math11daff391a550f9600c8318be97%22%20font-size%3D%2214%22%20text-anchor%3D%22middle%22%20x%3D%2258.5%22%20y%3D%2215%22%3E%26%23x2264%3B%3C%2Ftext%3E%3Ctext%20font-family%3D%22Times%20New%20Roman%22%20font-size%3D%2216%22%20font-style%3D%22italic%22%20text-anchor%3D%22middle%22%20x%3D%2270.5%22%20y%3D%2215%22%3Eb%3C%2Ftext%3E%3Ctext%20font-family%3D%22round_brackets18549f92a457f2409%22%20font-size%3D%2216%22%20text-anchor%3D%22middle%22%20x%3D%2277.5%22%20y%3D%2215%22%3E)%3C%2Ftext%3E%3Ctext%20font-family%3D%22math11daff391a550f9600c8318be97%22%20font-size%3D%2214%22%20text-anchor%3D%22middle%22%20x%3D%2288.5%22%20y%3D%2215%22%3E%3D%3C%2Ftext%3E%3Ctext%20font-family%3D%22Times%20New%20Roman%22%20font-size%3D%2216%22%20font-style%3D%22italic%22%20text-anchor%3D%22middle%22%20x%3D%22100.5%22%20y%3D%2215%22%3EP%3C%2Ftext%3E%3Ctext%20font-family%3D%22round_brackets18549f92a457f2409%22%20font-size%3D%2216%22%20text-anchor%3D%22middle%22%20x%3D%22109.5%22%20y%3D%2215%22%3E(%3C%2Ftext%3E%3Ctext%20font-family%3D%22Times%20New%20Roman%22%20font-size%3D%2216%22%20font-style%3D%22italic%22%20text-anchor%3D%22middle%22%20x%3D%22114.5%22%20y%3D%2215%22%3Ea%3C%2Ftext%3E%3Ctext%20font-family%3D%22math11daff391a550f9600c8318be97%22%20font-size%3D%2214%22%20text-anchor%3D%22middle%22%20x%3D%22126.5%22%20y%3D%2215%22%3E%26lt%3B%3C%2Ftext%3E%3Ctext%20font-family%3D%22Times%20New%20Roman%22%20font-size%3D%2216%22%20font-style%3D%22italic%22%20text-anchor%3D%22middle%22%20x%3D%22140.5%22%20y%3D%2215%22%3EX%3C%2Ftext%3E%3Ctext%20font-family%3D%22math11daff391a550f9600c8318be97%22%20font-size%3D%2214%22%20text-anchor%3D%22middle%22%20x%3D%22154.5%22%20y%3D%2215%22%3E%26lt%3B%3C%2Ftext%3E%3Ctext%20font-family%3D%22Times%20New%20Roman%22%20font-size%3D%2216%22%20font-style%3D%22italic%22%20text-anchor%3D%22middle%22%20x%3D%22166.5%22%20y%3D%2215%22%3Eb%3C%2Ftext%3E%3Ctext%20font-family%3D%22round_brackets18549f92a457f2409%22%20font-size%3D%2216%22%20text-anchor%3D%22middle%22%20x%3D%22173.5%22%20y%3D%2215%22%3E)%3C%2Ftext%3E%3C%2Fsvg%3E)
for any continuous random variable,
%3C%2Fmo%3E%3Cmo%3E%26%23xA0%3B%3C%2Fmo%3E%3Cmo%3E%3D%3C%2Fmo%3E%3Cmo%3E%26%23xA0%3B%3C%2Fmo%3E%3Cmn%3E0%3C%2Fmn%3E%3C%2Fmstyle%3E%3C%2Fmath%3E--%3E%3Cdefs%3E%3Cstyle%20type%3D%22text%2Fcss%22%3E%40font-face%7Bfont-family%3A'math17f39f8317fbdb1988ef4c628eb'%3Bsrc%3Aurl(data%3Afont%2Ftruetype%3Bcharset%3Dutf-8%3Bbase64%2CAAEAAAAMAIAAAwBAT1MvMi7iBBMAAADMAAAATmNtYXDEvmKUAAABHAAAADRjdnQgDVUNBwAAAVAAAAA6Z2x5ZoPi2VsAAAGMAAAAsmhlYWQQC2qxAAACQAAAADZoaGVhCGsXSAAAAngAAAAkaG10eE2rRkcAAAKcAAAACGxvY2EAHTwYAAACpAAAAAxtYXhwBT0FPgAAArAAAAAgbmFtZaBxlY4AAALQAAABn3Bvc3QB9wD6AAAEcAAAACBwcmVwa1uragAABJAAAAAUAAADSwGQAAUAAAQABAAAAAAABAAEAAAAAAAAAQEAAAAAAAAAAAAAAAAAAAAAAAAAAAAAAAAAAAAAACAgICAAAAAg1UADev96AAAD6ACWAAAAAAACAAEAAQAAABQAAwABAAAAFAAEACAAAAAEAAQAAQAAAD3%2F%2FwAAAD3%2F%2F%2F%2FEAAEAAAAAAAABVAMsAIABAABWACoCWAIeAQ4BLAIsAFoBgAKAAKAA1ACAAAAAAAAAACsAVQCAAKsA1QEAASsABwAAAAIAVQAAAwADqwADAAcAADMRIRElIREhVQKr%2FasCAP4AA6v8VVUDAAACAIAA6wLVAhUAAwAHAGUYAbAIELAG1LAGELAF1LAIELAB1LABELAA1LAGELAHPLAFELAEPLABELACPLAAELADPACwCBCwBtSwBhCwB9SwBxCwAdSwARCwAtSwBhCwBTywBxCwBDywARCwADywAhCwAzwxMBMhNSEdASE1gAJV%2FasCVQHAVdVVVQAAAAEAAAABAADVeM5BXw889QADBAD%2F%2F%2F%2F%2F1joTc%2F%2F%2F%2F%2F%2FWOhNzAAD%2FIASAA6sAAAAKAAIAAQAAAAAAAQAAA%2Bj%2FagAAF3AAAP%2B2BIAAAQAAAAAAAAAAAAAAAAAAAAIDUgBVA1YAgAAAAAAAAAAoAAAAsgABAAAAAgBeAAUAAAAAAAIAgAQAAAAAAAQAAN4AAAAAAAAAFQECAAAAAAAAAAEAEgAAAAAAAAAAAAIADgASAAAAAAAAAAMAMAAgAAAAAAAAAAQAEgBQAAAAAAAAAAUAFgBiAAAAAAAAAAYACQB4AAAAAAAAAAgAHACBAAEAAAAAAAEAEgAAAAEAAAAAAAIADgASAAEAAAAAAAMAMAAgAAEAAAAAAAQAEgBQAAEAAAAAAAUAFgBiAAEAAAAAAAYACQB4AAEAAAAAAAgAHACBAAMAAQQJAAEAEgAAAAMAAQQJAAIADgASAAMAAQQJAAMAMAAgAAMAAQQJAAQAEgBQAAMAAQQJAAUAFgBiAAMAAQQJAAYACQB4AAMAAQQJAAgAHACBAE0AYQB0AGgAIABGAG8AbgB0AFIAZQBnAHUAbABhAHIATQBhAHQAaABzACAARgBvAHIAIABNAG8AcgBlACAATQBhAHQAaAAgAEYAbwBuAHQATQBhAHQAaAAgAEYAbwBuAHQAVgBlAHIAcwBpAG8AbgAgADEALgAwTWF0aF9Gb250AE0AYQB0AGgAcwAgAEYAbwByACAATQBvAHIAZQAAAwAAAAAAAAH0APoAAAAAAAAAAAAAAAAAAAAAAAAAALkHEQAAjYUYALIAAAAVFBOxAAE%2F)format('truetype')%3Bfont-weight%3Anormal%3Bfont-style%3Anormal%3B%7D%40font-face%7Bfont-family%3A'round_brackets18549f92a457f2409'%3Bsrc%3Aurl(data%3Afont%2Ftruetype%3Bcharset%3Dutf-8%3Bbase64%2CAAEAAAAMAIAAAwBAT1MvMjwHLFQAAADMAAAATmNtYXDf7xCrAAABHAAAADxjdnQgBAkDLgAAAVgAAAASZ2x5ZmAOz2cAAAFsAAABJGhlYWQOKih8AAACkAAAADZoaGVhCvgVwgAAAsgAAAAkaG10eCA6AAIAAALsAAAADGxvY2EAAARLAAAC%2BAAAABBtYXhwBIgEWQAAAwgAAAAgbmFtZXHR30MAAAMoAAACOXBvc3QDogHPAAAFZAAAACBwcmVwupWEAAAABYQAAAAHAAAGcgGQAAUAAAgACAAAAAAACAAIAAAAAAAAAQIAAAAAAAAAAAAAAAAAAAAAAAAAAAAAAAAAAAAAACAgICAAAAAo8AMGe%2F57AAAHPgGyAAAAAAACAAEAAQAAABQAAwABAAAAFAAEACgAAAAGAAQAAQACACgAKf%2F%2FAAAAKAAp%2F%2F%2F%2F2f%2FZAAEAAAAAAAAAAAFUAFYBAAAsAKgDgAAyAAcAAAACAAAAKgDVA1UAAwAHAAA1MxEjEyMRM9XVq4CAKgMr%2FQAC1QABAAD%2B0AIgBtAACQBNGAGwChCwA9SwAxCwAtSwChCwBdSwBRCwANSwAxCwBzywAhCwCDwAsAoQsAPUsAMQsAfUsAoQsAXUsAoQsADUsAMQsAI8sAcQsAg8MTAREAEzABEQASMAAZCQ%2FnABkJD%2BcALQ%2FZD%2BcAGQAnACcAGQ%2FnAAAQAA%2FtACIAbQAAkATRgBsAoQsAPUsAMQsALUsAoQsAXUsAUQsADUsAMQsAc8sAIQsAg8ALAKELAD1LADELAH1LAKELAF1LAKELAA1LADELACPLAHELAIPDEwARABIwAREAEzAAIg%2FnCQAZD%2BcJABkALQ%2FZD%2BcAGQAnACcAGQ%2FnAAAQAAAAEAAPW2NYFfDzz1AAMIAP%2F%2F%2F%2F%2FVre7u%2F%2F%2F%2F%2F9Wt7u4AAP7QA7cG0AAAAAoAAgABAAAAAAABAAAHPv5OAAAXcAAA%2F%2F4DtwABAAAAAAAAAAAAAAAAAAAAAwDVAAACIAAAAiAAAAAAAAAAAAAkAAAAowAAASQAAQAAAAMACgACAAAAAAACAIAEAAAAAAAEAABNAAAAAAAAABUBAgAAAAAAAAABAD4AAAAAAAAAAAACAA4APgAAAAAAAAADAFwATAAAAAAAAAAEAD4AqAAAAAAAAAAFABYA5gAAAAAAAAAGAB8A%2FAAAAAAAAAAIABwBGwABAAAAAAABAD4AAAABAAAAAAACAA4APgABAAAAAAADAFwATAABAAAAAAAEAD4AqAABAAAAAAAFABYA5gABAAAAAAAGAB8A%2FAABAAAAAAAIABwBGwADAAEECQABAD4AAAADAAEECQACAA4APgADAAEECQADAFwATAADAAEECQAEAD4AqAADAAEECQAFABYA5gADAAEECQAGAB8A%2FAADAAEECQAIABwBGwBSAG8AdQBuAGQAIABiAHIAYQBjAGsAZQB0AHMAIAB3AGkAdABoACAAYQBzAGMAZQBuAHQAIAAxADgANQA0AFIAZQBnAHUAbABhAHIATQBhAHQAaABzACAARgBvAHIAIABNAG8AcgBlACAAUgBvAHUAbgBkACAAYgByAGEAYwBrAGUAdABzACAAdwBpAHQAaAAgAGEAcwBjAGUAbgB0ACAAMQA4ADUANABSAG8AdQBuAGQAIABiAHIAYQBjAGsAZQB0AHMAIAB3AGkAdABoACAAYQBzAGMAZQBuAHQAIAAxADgANQA0AFYAZQByAHMAaQBvAG4AIAAyAC4AMFJvdW5kX2JyYWNrZXRzX3dpdGhfYXNjZW50XzE4NTQATQBhAHQAaABzACAARgBvAHIAIABNAG8AcgBlAAAAAAMAAAAAAAADnwHPAAAAAAAAAAAAAAAAAAAAAAAAAAC5B%2F8AAY2FAA%3D%3D)format('truetype')%3Bfont-weight%3Anormal%3Bfont-style%3Anormal%3B%7D%3C%2Fstyle%3E%3C%2Fdefs%3E%3Ctext%20font-family%3D%22Times%20New%20Roman%22%20font-size%3D%2216%22%20text-anchor%3D%22middle%22%20x%3D%224.5%22%20y%3D%2215%22%3EP%3C%2Ftext%3E%3Ctext%20font-family%3D%22round_brackets18549f92a457f2409%22%20font-size%3D%2216%22%20text-anchor%3D%22middle%22%20x%3D%2212.5%22%20y%3D%2215%22%3E(%3C%2Ftext%3E%3Ctext%20font-family%3D%22Times%20New%20Roman%22%20font-size%3D%2216%22%20font-style%3D%22italic%22%20text-anchor%3D%22middle%22%20x%3D%2220.5%22%20y%3D%2215%22%3EX%3C%2Ftext%3E%3Ctext%20font-family%3D%22math17f39f8317fbdb1988ef4c628eb%22%20font-size%3D%2214%22%20text-anchor%3D%22middle%22%20x%3D%2235.5%22%20y%3D%2215%22%3E%3D%3C%2Ftext%3E%3Ctext%20font-family%3D%22Times%20New%20Roman%22%20font-size%3D%2216%22%20font-style%3D%22italic%22%20text-anchor%3D%22middle%22%20x%3D%2247.5%22%20y%3D%2215%22%3En%3C%2Ftext%3E%3Ctext%20font-family%3D%22round_brackets18549f92a457f2409%22%20font-size%3D%2216%22%20text-anchor%3D%22middle%22%20x%3D%2254.5%22%20y%3D%2215%22%3E)%3C%2Ftext%3E%3Ctext%20font-family%3D%22math17f39f8317fbdb1988ef4c628eb%22%20font-size%3D%2214%22%20text-anchor%3D%22middle%22%20x%3D%2269.5%22%20y%3D%2215%22%3E%3D%3C%2Ftext%3E%3Ctext%20font-family%3D%22Times%20New%20Roman%22%20font-size%3D%2216%22%20text-anchor%3D%22middle%22%20x%3D%2285.5%22%20y%3D%2215%22%3E0%3C%2Ftext%3E%3C%2Fsvg%3E) for all values of n
for all values of nOne way to think of this is that
format('truetype')%3Bfont-weight%3Anormal%3Bfont-style%3Anormal%3B%7D%3C%2Fstyle%3E%3C%2Fdefs%3E%3Ctext%20font-family%3D%22Times%20New%20Roman%22%20font-size%3D%2216%22%20font-style%3D%22italic%22%20text-anchor%3D%22middle%22%20x%3D%223.5%22%20y%3D%2215%22%3Ea%3C%2Ftext%3E%3Ctext%20font-family%3D%22math17f39f8317fbdb1988ef4c628eb%22%20font-size%3D%2214%22%20text-anchor%3D%22middle%22%20x%3D%2216.5%22%20y%3D%2215%22%3E%3D%3C%2Ftext%3E%3Ctext%20font-family%3D%22Times%20New%20Roman%22%20font-size%3D%2216%22%20font-style%3D%22italic%22%20text-anchor%3D%22middle%22%20x%3D%2228.5%22%20y%3D%2215%22%3Eb%3C%2Ftext%3E%3C%2Fsvg%3E) in the integral above
in the integral above
How do I solve problems using the PDF?
Some questions may ask for justification of the use of a given function for a probability density function
In such cases check that the function meets the two conditions
%3C%2Fmo%3E%3Cmo%3E%26%23x2265%3B%3C%2Fmo%3E%3Cmn%3E0%3C%2Fmn%3E%3C%2Fmstyle%3E%3C%2Fmath%3E--%3E%3Cdefs%3E%3Cstyle%20type%3D%22text%2Fcss%22%3E%40font-face%7Bfont-family%3A'math1070c425fd005e11aec1a90706d'%3Bsrc%3Aurl(data%3Afont%2Ftruetype%3Bcharset%3Dutf-8%3Bbase64%2CAAEAAAAMAIAAAwBAT1MvMi7iBBMAAADMAAAATmNtYXDEvmKUAAABHAAAADRjdnQgDVUNBwAAAVAAAAA6Z2x5ZoPi2VsAAAGMAAAAj2hlYWQQC2qxAAACHAAAADZoaGVhCGsXSAAAAlQAAAAkaG10eE2rRkcAAAJ4AAAACGxvY2EAHTwYAAACgAAAAAxtYXhwBT0FPgAAAowAAAAgbmFtZaBxlY4AAAKsAAABn3Bvc3QB9wD6AAAETAAAACBwcmVwa1uragAABGwAAAAUAAADSwGQAAUAAAQABAAAAAAABAAEAAAAAAAAAQEAAAAAAAAAAAAAAAAAAAAAAAAAAAAAAAAAAAAAACAgICAAAAAg1UADev96AAAD6ACWAAAAAAACAAEAAQAAABQAAwABAAAAFAAEACAAAAAEAAQAAQAAImX%2F%2FwAAImX%2F%2F92cAAEAAAAAAAABVAMsAIABAABWACoCWAIeAQ4BLAIsAFoBgAKAAKAA1ACAAAAAAAAAACsAVQCAAKsA1QEAASsABwAAAAIAVQAAAwADqwADAAcAADMRIRElIREhVQKr%2FasCAP4AA6v8VVUDAAADAID%2FqwKBAqsAAwAHAAsALxgBALEJAD%2BxCAXksQIF9LEBBPSxBgX0sQME5LEFBPSxBAX0sQcBEDyxAAYQPDAxARUBNRE1ARUBNSEVAoD%2BAAIB%2Ff8CAAGrVv8AVgGqVv8AVv5WVVUAAAEAAAABAADVeM5BXw889QADBAD%2F%2F%2F%2F%2F1joTc%2F%2F%2F%2F%2F%2FWOhNzAAD%2FIASAA6sAAAAKAAIAAQAAAAAAAQAAA%2Bj%2FagAAF3AAAP%2B2BIAAAQAAAAAAAAAAAAAAAAAAAAIDUgBVAwAAgAAAAAAAAAAoAAAAjwABAAAAAgBeAAUAAAAAAAIAgAQAAAAAAAQAAN4AAAAAAAAAFQECAAAAAAAAAAEAEgAAAAAAAAAAAAIADgASAAAAAAAAAAMAMAAgAAAAAAAAAAQAEgBQAAAAAAAAAAUAFgBiAAAAAAAAAAYACQB4AAAAAAAAAAgAHACBAAEAAAAAAAEAEgAAAAEAAAAAAAIADgASAAEAAAAAAAMAMAAgAAEAAAAAAAQAEgBQAAEAAAAAAAUAFgBiAAEAAAAAAAYACQB4AAEAAAAAAAgAHACBAAMAAQQJAAEAEgAAAAMAAQQJAAIADgASAAMAAQQJAAMAMAAgAAMAAQQJAAQAEgBQAAMAAQQJAAUAFgBiAAMAAQQJAAYACQB4AAMAAQQJAAgAHACBAE0AYQB0AGgAIABGAG8AbgB0AFIAZQBnAHUAbABhAHIATQBhAHQAaABzACAARgBvAHIAIABNAG8AcgBlACAATQBhAHQAaAAgAEYAbwBuAHQATQBhAHQAaAAgAEYAbwBuAHQAVgBlAHIAcwBpAG8AbgAgADEALgAwTWF0aF9Gb250AE0AYQB0AGgAcwAgAEYAbwByACAATQBvAHIAZQAAAwAAAAAAAAH0APoAAAAAAAAAAAAAAAAAAAAAAAAAALkHEQAAjYUYALIAAAAVFBOxAAE%2F)format('truetype')%3Bfont-weight%3Anormal%3Bfont-style%3Anormal%3B%7D%40font-face%7Bfont-family%3A'round_brackets18549f92a457f2409'%3Bsrc%3Aurl(data%3Afont%2Ftruetype%3Bcharset%3Dutf-8%3Bbase64%2CAAEAAAAMAIAAAwBAT1MvMjwHLFQAAADMAAAATmNtYXDf7xCrAAABHAAAADxjdnQgBAkDLgAAAVgAAAASZ2x5ZmAOz2cAAAFsAAABJGhlYWQOKih8AAACkAAAADZoaGVhCvgVwgAAAsgAAAAkaG10eCA6AAIAAALsAAAADGxvY2EAAARLAAAC%2BAAAABBtYXhwBIgEWQAAAwgAAAAgbmFtZXHR30MAAAMoAAACOXBvc3QDogHPAAAFZAAAACBwcmVwupWEAAAABYQAAAAHAAAGcgGQAAUAAAgACAAAAAAACAAIAAAAAAAAAQIAAAAAAAAAAAAAAAAAAAAAAAAAAAAAAAAAAAAAACAgICAAAAAo8AMGe%2F57AAAHPgGyAAAAAAACAAEAAQAAABQAAwABAAAAFAAEACgAAAAGAAQAAQACACgAKf%2F%2FAAAAKAAp%2F%2F%2F%2F2f%2FZAAEAAAAAAAAAAAFUAFYBAAAsAKgDgAAyAAcAAAACAAAAKgDVA1UAAwAHAAA1MxEjEyMRM9XVq4CAKgMr%2FQAC1QABAAD%2B0AIgBtAACQBNGAGwChCwA9SwAxCwAtSwChCwBdSwBRCwANSwAxCwBzywAhCwCDwAsAoQsAPUsAMQsAfUsAoQsAXUsAoQsADUsAMQsAI8sAcQsAg8MTAREAEzABEQASMAAZCQ%2FnABkJD%2BcALQ%2FZD%2BcAGQAnACcAGQ%2FnAAAQAA%2FtACIAbQAAkATRgBsAoQsAPUsAMQsALUsAoQsAXUsAUQsADUsAMQsAc8sAIQsAg8ALAKELAD1LADELAH1LAKELAF1LAKELAA1LADELACPLAHELAIPDEwARABIwAREAEzAAIg%2FnCQAZD%2BcJABkALQ%2FZD%2BcAGQAnACcAGQ%2FnAAAQAAAAEAAPW2NYFfDzz1AAMIAP%2F%2F%2F%2F%2FVre7u%2F%2F%2F%2F%2F9Wt7u4AAP7QA7cG0AAAAAoAAgABAAAAAAABAAAHPv5OAAAXcAAA%2F%2F4DtwABAAAAAAAAAAAAAAAAAAAAAwDVAAACIAAAAiAAAAAAAAAAAAAkAAAAowAAASQAAQAAAAMACgACAAAAAAACAIAEAAAAAAAEAABNAAAAAAAAABUBAgAAAAAAAAABAD4AAAAAAAAAAAACAA4APgAAAAAAAAADAFwATAAAAAAAAAAEAD4AqAAAAAAAAAAFABYA5gAAAAAAAAAGAB8A%2FAAAAAAAAAAIABwBGwABAAAAAAABAD4AAAABAAAAAAACAA4APgABAAAAAAADAFwATAABAAAAAAAEAD4AqAABAAAAAAAFABYA5gABAAAAAAAGAB8A%2FAABAAAAAAAIABwBGwADAAEECQABAD4AAAADAAEECQACAA4APgADAAEECQADAFwATAADAAEECQAEAD4AqAADAAEECQAFABYA5gADAAEECQAGAB8A%2FAADAAEECQAIABwBGwBSAG8AdQBuAGQAIABiAHIAYQBjAGsAZQB0AHMAIAB3AGkAdABoACAAYQBzAGMAZQBuAHQAIAAxADgANQA0AFIAZQBnAHUAbABhAHIATQBhAHQAaABzACAARgBvAHIAIABNAG8AcgBlACAAUgBvAHUAbgBkACAAYgByAGEAYwBrAGUAdABzACAAdwBpAHQAaAAgAGEAcwBjAGUAbgB0ACAAMQA4ADUANABSAG8AdQBuAGQAIABiAHIAYQBjAGsAZQB0AHMAIAB3AGkAdABoACAAYQBzAGMAZQBuAHQAIAAxADgANQA0AFYAZQByAHMAaQBvAG4AIAAyAC4AMFJvdW5kX2JyYWNrZXRzX3dpdGhfYXNjZW50XzE4NTQATQBhAHQAaABzACAARgBvAHIAIABNAG8AcgBlAAAAAAMAAAAAAAADnwHPAAAAAAAAAAAAAAAAAAAAAAAAAAC5B%2F8AAY2FAA%3D%3D)format('truetype')%3Bfont-weight%3Anormal%3Bfont-style%3Anormal%3B%7D%3C%2Fstyle%3E%3C%2Fdefs%3E%3Ctext%20font-family%3D%22Times%20New%20Roman%22%20font-size%3D%2216%22%20text-anchor%3D%22middle%22%20x%3D%222.5%22%20y%3D%2215%22%3Ef%3C%2Ftext%3E%3Ctext%20font-family%3D%22round_brackets18549f92a457f2409%22%20font-size%3D%2216%22%20text-anchor%3D%22middle%22%20x%3D%2210.5%22%20y%3D%2215%22%3E(%3C%2Ftext%3E%3Ctext%20font-family%3D%22Times%20New%20Roman%22%20font-size%3D%2216%22%20text-anchor%3D%22middle%22%20x%3D%2216.5%22%20y%3D%2215%22%3Ex%3C%2Ftext%3E%3Ctext%20font-family%3D%22round_brackets18549f92a457f2409%22%20font-size%3D%2216%22%20text-anchor%3D%22middle%22%20x%3D%2222.5%22%20y%3D%2215%22%3E)%3C%2Ftext%3E%3Ctext%20font-family%3D%22math1070c425fd005e11aec1a90706d%22%20font-size%3D%2214%22%20text-anchor%3D%22middle%22%20x%3D%2232.5%22%20y%3D%2215%22%3E%26%23x2265%3B%3C%2Ftext%3E%3Ctext%20font-family%3D%22Times%20New%20Roman%22%20font-size%3D%2216%22%20text-anchor%3D%22middle%22%20x%3D%2244.5%22%20y%3D%2215%22%3E0%3C%2Ftext%3E%3C%2Fsvg%3E) for all values of and the total area under the graph is 1
for all values of and the total area under the graph is 1
If asked to find a probability
STEP 1
Identify the probability density function, f(), this may be given as a graph, an equation or as a piecewise function
e.g. ![]()
STEP 2
Identify the range of for a particular problem
Remember that ![]()
Question: Can you explain why this is so?
(Answer is at end of this section)
STEP 3
Sketching the graph of y = f() if simple may help to find the probabilityLook for basic shapes such as triangles or rectangles; finding areas of these is easy and avoids integration
Look for symmetry in the graph that may make the problem easier
Integrate f(
) and evaluate it between the two limits for the required probability
Trickier problems may involve finding a limit of the integral given its value
i.e. one of the values in the range of X, given the probability
e.g. Find the value of given
given %3C%2Fmo%3E%3Cmo%3E%3D%3C%2Fmo%3E%3Cmn%3E0%3C%2Fmn%3E%3Cmo%3E.%3C%2Fmo%3E%3Cmn%3E09%3C%2Fmn%3E%3C%2Fmstyle%3E%3C%2Fmath%3E--%3E%3Cdefs%3E%3Cstyle%20type%3D%22text%2Fcss%22%3E%40font-face%7Bfont-family%3A'math15ce32a8e0161ed97fec212618b'%3Bsrc%3Aurl(data%3Afont%2Ftruetype%3Bcharset%3Dutf-8%3Bbase64%2CAAEAAAAMAIAAAwBAT1MvMi7iBBMAAADMAAAATmNtYXDEvmKUAAABHAAAAERjdnQgDVUNBwAAAWAAAAA6Z2x5ZoPi2VsAAAGcAAABYWhlYWQQC2qxAAADAAAAADZoaGVhCGsXSAAAAzgAAAAkaG10eE2rRkcAAANcAAAAEGxvY2EAHTwYAAADbAAAABRtYXhwBT0FPgAAA4AAAAAgbmFtZaBxlY4AAAOgAAABn3Bvc3QB9wD6AAAFQAAAACBwcmVwa1uragAABWAAAAAUAAADSwGQAAUAAAQABAAAAAAABAAEAAAAAAAAAQEAAAAAAAAAAAAAAAAAAAAAAAAAAAAAAAAAAAAAACAgICAAAAAg1UADev96AAAD6ACWAAAAAAACAAEAAQAAABQAAwABAAAAFAAEADAAAAAIAAgAAgAAAC4APSJk%2F%2F8AAAAuAD0iZP%2F%2F%2F9P%2Fxd2fAAEAAAAAAAAAAAAAAVQDLACAAQAAVgAqAlgCHgEOASwCLABaAYACgACgANQAgAAAAAAAAAArAFUAgACrANUBAAErAAcAAAACAFUAAAMAA6sAAwAHAAAzESERJSERIVUCq%2F2rAgD%2BAAOr%2FFVVAwAAAQAgAAAAoACAAAMALxgBsAQQsAPUsAMQsALUsAMQsAA8sAIQsAE8ALAEELAD1LADELACPLAAELABPDAxNzMVIyCAgICAAAIAgADrAtUCFQADAAcAZRgBsAgQsAbUsAYQsAXUsAgQsAHUsAEQsADUsAYQsAc8sAUQsAQ8sAEQsAI8sAAQsAM8ALAIELAG1LAGELAH1LAHELAB1LABELAC1LAGELAFPLAHELAEPLABELAAPLACELADPDEwEyE1IR0BITWAAlX9qwJVAcBV1VVVAAMAgP%2BrAoACqwADAAcACwAvGAEAsQkAP7EIBeSxAgX0sQEE9LEGBfSxAwTksQUE9LEEBfSxBwEQPLEABhA8MDETBwE1EzUBFwE1IRWBAQH%2FAf4AAQH%2F%2FgABq1b%2FAFYBqlb%2FAFb%2BVlVVAAAAAAEAAAABAADVeM5BXw889QADBAD%2F%2F%2F%2F%2F1joTc%2F%2F%2F%2F%2F%2FWOhNzAAD%2FIASAA6sAAAAKAAIAAQAAAAAAAQAAA%2Bj%2FagAAF3AAAP%2B2BIAAAQAAAAAAAAAAAAAAAAAAAAQDUgBVAMgAIANWAIADAACAAAAAAAAAACgAAABuAAAA%2BAAAAWEAAQAAAAQAXgAFAAAAAAACAIAEAAAAAAAEAADeAAAAAAAAABUBAgAAAAAAAAABABIAAAAAAAAAAAACAA4AEgAAAAAAAAADADAAIAAAAAAAAAAEABIAUAAAAAAAAAAFABYAYgAAAAAAAAAGAAkAeAAAAAAAAAAIABwAgQABAAAAAAABABIAAAABAAAAAAACAA4AEgABAAAAAAADADAAIAABAAAAAAAEABIAUAABAAAAAAAFABYAYgABAAAAAAAGAAkAeAABAAAAAAAIABwAgQADAAEECQABABIAAAADAAEECQACAA4AEgADAAEECQADADAAIAADAAEECQAEABIAUAADAAEECQAFABYAYgADAAEECQAGAAkAeAADAAEECQAIABwAgQBNAGEAdABoACAARgBvAG4AdABSAGUAZwB1AGwAYQByAE0AYQB0AGgAcwAgAEYAbwByACAATQBvAHIAZQAgAE0AYQB0AGgAIABGAG8AbgB0AE0AYQB0AGgAIABGAG8AbgB0AFYAZQByAHMAaQBvAG4AIAAxAC4AME1hdGhfRm9udABNAGEAdABoAHMAIABGAG8AcgAgAE0AbwByAGUAAAMAAAAAAAAB9AD6AAAAAAAAAAAAAAAAAAAAAAAAAAC5BxEAAI2FGACyAAAAFRQTsQABPw%3D%3D)format('truetype')%3Bfont-weight%3Anormal%3Bfont-style%3Anormal%3B%7D%40font-face%7Bfont-family%3A'round_brackets18549f92a457f2409'%3Bsrc%3Aurl(data%3Afont%2Ftruetype%3Bcharset%3Dutf-8%3Bbase64%2CAAEAAAAMAIAAAwBAT1MvMjwHLFQAAADMAAAATmNtYXDf7xCrAAABHAAAADxjdnQgBAkDLgAAAVgAAAASZ2x5ZmAOz2cAAAFsAAABJGhlYWQOKih8AAACkAAAADZoaGVhCvgVwgAAAsgAAAAkaG10eCA6AAIAAALsAAAADGxvY2EAAARLAAAC%2BAAAABBtYXhwBIgEWQAAAwgAAAAgbmFtZXHR30MAAAMoAAACOXBvc3QDogHPAAAFZAAAACBwcmVwupWEAAAABYQAAAAHAAAGcgGQAAUAAAgACAAAAAAACAAIAAAAAAAAAQIAAAAAAAAAAAAAAAAAAAAAAAAAAAAAAAAAAAAAACAgICAAAAAo8AMGe%2F57AAAHPgGyAAAAAAACAAEAAQAAABQAAwABAAAAFAAEACgAAAAGAAQAAQACACgAKf%2F%2FAAAAKAAp%2F%2F%2F%2F2f%2FZAAEAAAAAAAAAAAFUAFYBAAAsAKgDgAAyAAcAAAACAAAAKgDVA1UAAwAHAAA1MxEjEyMRM9XVq4CAKgMr%2FQAC1QABAAD%2B0AIgBtAACQBNGAGwChCwA9SwAxCwAtSwChCwBdSwBRCwANSwAxCwBzywAhCwCDwAsAoQsAPUsAMQsAfUsAoQsAXUsAoQsADUsAMQsAI8sAcQsAg8MTAREAEzABEQASMAAZCQ%2FnABkJD%2BcALQ%2FZD%2BcAGQAnACcAGQ%2FnAAAQAA%2FtACIAbQAAkATRgBsAoQsAPUsAMQsALUsAoQsAXUsAUQsADUsAMQsAc8sAIQsAg8ALAKELAD1LADELAH1LAKELAF1LAKELAA1LADELACPLAHELAIPDEwARABIwAREAEzAAIg%2FnCQAZD%2BcJABkALQ%2FZD%2BcAGQAnACcAGQ%2FnAAAQAAAAEAAPW2NYFfDzz1AAMIAP%2F%2F%2F%2F%2FVre7u%2F%2F%2F%2F%2F9Wt7u4AAP7QA7cG0AAAAAoAAgABAAAAAAABAAAHPv5OAAAXcAAA%2F%2F4DtwABAAAAAAAAAAAAAAAAAAAAAwDVAAACIAAAAiAAAAAAAAAAAAAkAAAAowAAASQAAQAAAAMACgACAAAAAAACAIAEAAAAAAAEAABNAAAAAAAAABUBAgAAAAAAAAABAD4AAAAAAAAAAAACAA4APgAAAAAAAAADAFwATAAAAAAAAAAEAD4AqAAAAAAAAAAFABYA5gAAAAAAAAAGAB8A%2FAAAAAAAAAAIABwBGwABAAAAAAABAD4AAAABAAAAAAACAA4APgABAAAAAAADAFwATAABAAAAAAAEAD4AqAABAAAAAAAFABYA5gABAAAAAAAGAB8A%2FAABAAAAAAAIABwBGwADAAEECQABAD4AAAADAAEECQACAA4APgADAAEECQADAFwATAADAAEECQAEAD4AqAADAAEECQAFABYA5gADAAEECQAGAB8A%2FAADAAEECQAIABwBGwBSAG8AdQBuAGQAIABiAHIAYQBjAGsAZQB0AHMAIAB3AGkAdABoACAAYQBzAGMAZQBuAHQAIAAxADgANQA0AFIAZQBnAHUAbABhAHIATQBhAHQAaABzACAARgBvAHIAIABNAG8AcgBlACAAUgBvAHUAbgBkACAAYgByAGEAYwBrAGUAdABzACAAdwBpAHQAaAAgAGEAcwBjAGUAbgB0ACAAMQA4ADUANABSAG8AdQBuAGQAIABiAHIAYQBjAGsAZQB0AHMAIAB3AGkAdABoACAAYQBzAGMAZQBuAHQAIAAxADgANQA0AFYAZQByAHMAaQBvAG4AIAAyAC4AMFJvdW5kX2JyYWNrZXRzX3dpdGhfYXNjZW50XzE4NTQATQBhAHQAaABzACAARgBvAHIAIABNAG8AcgBlAAAAAAMAAAAAAAADnwHPAAAAAAAAAAAAAAAAAAAAAAAAAAC5B%2F8AAY2FAA%3D%3D)format('truetype')%3Bfont-weight%3Anormal%3Bfont-style%3Anormal%3B%7D%3C%2Fstyle%3E%3C%2Fdefs%3E%3Ctext%20font-family%3D%22Times%20New%20Roman%22%20font-size%3D%2216%22%20text-anchor%3D%22middle%22%20x%3D%224.5%22%20y%3D%2215%22%3EP%3C%2Ftext%3E%3Ctext%20font-family%3D%22round_brackets18549f92a457f2409%22%20font-size%3D%2216%22%20text-anchor%3D%22middle%22%20x%3D%2212.5%22%20y%3D%2215%22%3E(%3C%2Ftext%3E%3Ctext%20font-family%3D%22Times%20New%20Roman%22%20font-size%3D%2216%22%20text-anchor%3D%22middle%22%20x%3D%2218.5%22%20y%3D%2215%22%3E0%3C%2Ftext%3E%3Ctext%20font-family%3D%22math15ce32a8e0161ed97fec212618b%22%20font-size%3D%2214%22%20text-anchor%3D%22middle%22%20x%3D%2229.5%22%20y%3D%2215%22%3E%26%23x2264%3B%3C%2Ftext%3E%3Ctext%20font-family%3D%22Times%20New%20Roman%22%20font-size%3D%2216%22%20font-style%3D%22italic%22%20text-anchor%3D%22middle%22%20x%3D%2243.5%22%20y%3D%2215%22%3EX%3C%2Ftext%3E%3Ctext%20font-family%3D%22math15ce32a8e0161ed97fec212618b%22%20font-size%3D%2214%22%20text-anchor%3D%22middle%22%20x%3D%2257.5%22%20y%3D%2215%22%3E%26%23x2264%3B%3C%2Ftext%3E%3Ctext%20font-family%3D%22Times%20New%20Roman%22%20font-size%3D%2216%22%20font-style%3D%22italic%22%20text-anchor%3D%22middle%22%20x%3D%2268.5%22%20y%3D%2215%22%3Ea%3C%2Ftext%3E%3Ctext%20font-family%3D%22round_brackets18549f92a457f2409%22%20font-size%3D%2216%22%20text-anchor%3D%22middle%22%20x%3D%2275.5%22%20y%3D%2215%22%3E)%3C%2Ftext%3E%3Ctext%20font-family%3D%22math15ce32a8e0161ed97fec212618b%22%20font-size%3D%2214%22%20text-anchor%3D%22middle%22%20x%3D%2286.5%22%20y%3D%2215%22%3E%3D%3C%2Ftext%3E%3Ctext%20font-family%3D%22Times%20New%20Roman%22%20font-size%3D%2216%22%20text-anchor%3D%22middle%22%20x%3D%2298.5%22%20y%3D%2215%22%3E0%3C%2Ftext%3E%3Ctext%20font-family%3D%22math15ce32a8e0161ed97fec212618b%22%20font-size%3D%2214%22%20text-anchor%3D%22middle%22%20x%3D%22104.5%22%20y%3D%2215%22%3E.%3C%2Ftext%3E%3Ctext%20font-family%3D%22Times%20New%20Roman%22%20font-size%3D%2216%22%20text-anchor%3D%22middle%22%20x%3D%22115.5%22%20y%3D%2215%22%3E09%3C%2Ftext%3E%3C%2Fsvg%3E)
Answer to question in STEP 2:
Since%3C%2Fmo%3E%3Cmo%3E%3D%3C%2Fmo%3E%3Cmi%20mathvariant%3D%22normal%22%3EP%3C%2Fmi%3E%3Cmo%3E(%3C%2Fmo%3E%3Cmi%3EX%3C%2Fmi%3E%3Cmo%3E%3D%3C%2Fmo%3E%3Cmi%3Eb%3C%2Fmi%3E%3Cmo%3E)%3C%2Fmo%3E%3Cmo%3E%3D%3C%2Fmo%3E%3Cmn%3E0%3C%2Fmn%3E%3Cmo%3E%2C%3C%2Fmo%3E%3Cmo%3E%26%23xA0%3B%3C%2Fmo%3E%3Cmi%20mathvariant%3D%22normal%22%3EP%3C%2Fmi%3E%3Cmo%3E(%3C%2Fmo%3E%3Cmi%3Ea%3C%2Fmi%3E%3Cmo%3E%26%23x2264%3B%3C%2Fmo%3E%3Cmi%3EX%3C%2Fmi%3E%3Cmo%3E%26%23x2264%3B%3C%2Fmo%3E%3Cmi%3Eb%3C%2Fmi%3E%3Cmo%3E)%3C%2Fmo%3E%3Cmo%3E%3D%3C%2Fmo%3E%3Cmi%20mathvariant%3D%22normal%22%3EP%3C%2Fmi%3E%3Cmo%3E(%3C%2Fmo%3E%3Cmi%3Ea%3C%2Fmi%3E%3Cmo%3E%26lt%3B%3C%2Fmo%3E%3Cmi%3EX%3C%2Fmi%3E%3Cmo%3E%26lt%3B%3C%2Fmo%3E%3Cmi%3Eb%3C%2Fmi%3E%3Cmo%3E)%3C%2Fmo%3E%3C%2Fmstyle%3E%3C%2Fmath%3E--%3E%3Cdefs%3E%3Cstyle%20type%3D%22text%2Fcss%22%3E%40font-face%7Bfont-family%3A'math1595b5ca43595c4d2275abe88ce'%3Bsrc%3Aurl(data%3Afont%2Ftruetype%3Bcharset%3Dutf-8%3Bbase64%2CAAEAAAAMAIAAAwBAT1MvMi7iBBMAAADMAAAATmNtYXDEvmKUAAABHAAAAExjdnQgDVUNBwAAAWgAAAA6Z2x5ZoPi2VsAAAGkAAAB6WhlYWQQC2qxAAADkAAAADZoaGVhCGsXSAAAA8gAAAAkaG10eE2rRkcAAAPsAAAAFGxvY2EAHTwYAAAEAAAAABhtYXhwBT0FPgAABBgAAAAgbmFtZaBxlY4AAAQ4AAABn3Bvc3QB9wD6AAAF2AAAACBwcmVwa1uragAABfgAAAAUAAADSwGQAAUAAAQABAAAAAAABAAEAAAAAAAAAQEAAAAAAAAAAAAAAAAAAAAAAAAAAAAAAAAAAAAAACAgICAAAAAg1UADev96AAAD6ACWAAAAAAACAAEAAQAAABQAAwABAAAAFAAEADgAAAAKAAgAAgACACwAPAA9ImT%2F%2FwAAACwAPAA9ImT%2F%2F%2F%2FV%2F8b%2Fxt2gAAEAAAAAAAAAAAAAAAABVAMsAIABAABWACoCWAIeAQ4BLAIsAFoBgAKAAKAA1ACAAAAAAAAAACsAVQCAAKsA1QEAASsABwAAAAIAVQAAAwADqwADAAcAADMRIRElIREhVQKr%2FasCAP4AA6v8VVUDAAABAFX%2FZADVAIAACgAAMzUzFRQGByc%2BATdVgC8vGx4eAYB6PVEUKQ40MQACAIAAVQKAAqsABQALAGwYsEEaALEAABMQsQAG5LEAARMQsAk8sQEF9bAKPLAAELEFA%2FWxAgXtsQQD9bEDBe2wChCxCwP1sQgF7bEGA%2FWxBwXtAbAMELEBA%2FayCQAKPDw8sQUE9bICCAs8PDyxBAT1sgYHAzw8PLENA%2BYTBwUXNScBNQ0BFzeBAQEA%2F%2F8BAP8A%2FwAB%2FwGrVoCAVoABKlaAgFaAAAIAgADrAtUCFQADAAcAZRgBsAgQsAbUsAYQsAXUsAgQsAHUsAEQsADUsAYQsAc8sAUQsAQ8sAEQsAI8sAAQsAM8ALAIELAG1LAGELAH1LAHELAB1LABELAC1LAGELAFPLAHELAEPLABELAAPLACELADPDEwEyE1IR0BITWAAlX9qwJVAcBV1VVVAAMAgP%2BrAoACqwADAAcACwAvGAEAsQkAP7EIBeSxAgX0sQEE9LEGBfSxAwTksQUE9LEEBfSxBwEQPLEABhA8MDETBwE1EzUBFwE1IRWBAQH%2FAf4AAQH%2F%2FgABq1b%2FAFYBqlb%2FAFb%2BVlVVAAAAAAEAAAABAADVeM5BXw889QADBAD%2F%2F%2F%2F%2F1joTc%2F%2F%2F%2F%2F%2FWOhNzAAD%2FIASAA6sAAAAKAAIAAQAAAAAAAQAAA%2Bj%2FagAAF3AAAP%2B2BIAAAQAAAAAAAAAAAAAAAAAAAAUDUgBVATMAVQMAAIADVgCAAwAAgAAAAAAAAAAoAAAAUgAAAPYAAAGAAAAB6QABAAAABQBeAAUAAAAAAAIAgAQAAAAAAAQAAN4AAAAAAAAAFQECAAAAAAAAAAEAEgAAAAAAAAAAAAIADgASAAAAAAAAAAMAMAAgAAAAAAAAAAQAEgBQAAAAAAAAAAUAFgBiAAAAAAAAAAYACQB4AAAAAAAAAAgAHACBAAEAAAAAAAEAEgAAAAEAAAAAAAIADgASAAEAAAAAAAMAMAAgAAEAAAAAAAQAEgBQAAEAAAAAAAUAFgBiAAEAAAAAAAYACQB4AAEAAAAAAAgAHACBAAMAAQQJAAEAEgAAAAMAAQQJAAIADgASAAMAAQQJAAMAMAAgAAMAAQQJAAQAEgBQAAMAAQQJAAUAFgBiAAMAAQQJAAYACQB4AAMAAQQJAAgAHACBAE0AYQB0AGgAIABGAG8AbgB0AFIAZQBnAHUAbABhAHIATQBhAHQAaABzACAARgBvAHIAIABNAG8AcgBlACAATQBhAHQAaAAgAEYAbwBuAHQATQBhAHQAaAAgAEYAbwBuAHQAVgBlAHIAcwBpAG8AbgAgADEALgAwTWF0aF9Gb250AE0AYQB0AGgAcwAgAEYAbwByACAATQBvAHIAZQAAAwAAAAAAAAH0APoAAAAAAAAAAAAAAAAAAAAAAAAAALkHEQAAjYUYALIAAAAVFBOxAAE%2F)format('truetype')%3Bfont-weight%3Anormal%3Bfont-style%3Anormal%3B%7D%40font-face%7Bfont-family%3A'round_brackets18549f92a457f2409'%3Bsrc%3Aurl(data%3Afont%2Ftruetype%3Bcharset%3Dutf-8%3Bbase64%2CAAEAAAAMAIAAAwBAT1MvMjwHLFQAAADMAAAATmNtYXDf7xCrAAABHAAAADxjdnQgBAkDLgAAAVgAAAASZ2x5ZmAOz2cAAAFsAAABJGhlYWQOKih8AAACkAAAADZoaGVhCvgVwgAAAsgAAAAkaG10eCA6AAIAAALsAAAADGxvY2EAAARLAAAC%2BAAAABBtYXhwBIgEWQAAAwgAAAAgbmFtZXHR30MAAAMoAAACOXBvc3QDogHPAAAFZAAAACBwcmVwupWEAAAABYQAAAAHAAAGcgGQAAUAAAgACAAAAAAACAAIAAAAAAAAAQIAAAAAAAAAAAAAAAAAAAAAAAAAAAAAAAAAAAAAACAgICAAAAAo8AMGe%2F57AAAHPgGyAAAAAAACAAEAAQAAABQAAwABAAAAFAAEACgAAAAGAAQAAQACACgAKf%2F%2FAAAAKAAp%2F%2F%2F%2F2f%2FZAAEAAAAAAAAAAAFUAFYBAAAsAKgDgAAyAAcAAAACAAAAKgDVA1UAAwAHAAA1MxEjEyMRM9XVq4CAKgMr%2FQAC1QABAAD%2B0AIgBtAACQBNGAGwChCwA9SwAxCwAtSwChCwBdSwBRCwANSwAxCwBzywAhCwCDwAsAoQsAPUsAMQsAfUsAoQsAXUsAoQsADUsAMQsAI8sAcQsAg8MTAREAEzABEQASMAAZCQ%2FnABkJD%2BcALQ%2FZD%2BcAGQAnACcAGQ%2FnAAAQAA%2FtACIAbQAAkATRgBsAoQsAPUsAMQsALUsAoQsAXUsAUQsADUsAMQsAc8sAIQsAg8ALAKELAD1LADELAH1LAKELAF1LAKELAA1LADELACPLAHELAIPDEwARABIwAREAEzAAIg%2FnCQAZD%2BcJABkALQ%2FZD%2BcAGQAnACcAGQ%2FnAAAQAAAAEAAPW2NYFfDzz1AAMIAP%2F%2F%2F%2F%2FVre7u%2F%2F%2F%2F%2F9Wt7u4AAP7QA7cG0AAAAAoAAgABAAAAAAABAAAHPv5OAAAXcAAA%2F%2F4DtwABAAAAAAAAAAAAAAAAAAAAAwDVAAACIAAAAiAAAAAAAAAAAAAkAAAAowAAASQAAQAAAAMACgACAAAAAAACAIAEAAAAAAAEAABNAAAAAAAAABUBAgAAAAAAAAABAD4AAAAAAAAAAAACAA4APgAAAAAAAAADAFwATAAAAAAAAAAEAD4AqAAAAAAAAAAFABYA5gAAAAAAAAAGAB8A%2FAAAAAAAAAAIABwBGwABAAAAAAABAD4AAAABAAAAAAACAA4APgABAAAAAAADAFwATAABAAAAAAAEAD4AqAABAAAAAAAFABYA5gABAAAAAAAGAB8A%2FAABAAAAAAAIABwBGwADAAEECQABAD4AAAADAAEECQACAA4APgADAAEECQADAFwATAADAAEECQAEAD4AqAADAAEECQAFABYA5gADAAEECQAGAB8A%2FAADAAEECQAIABwBGwBSAG8AdQBuAGQAIABiAHIAYQBjAGsAZQB0AHMAIAB3AGkAdABoACAAYQBzAGMAZQBuAHQAIAAxADgANQA0AFIAZQBnAHUAbABhAHIATQBhAHQAaABzACAARgBvAHIAIABNAG8AcgBlACAAUgBvAHUAbgBkACAAYgByAGEAYwBrAGUAdABzACAAdwBpAHQAaAAgAGEAcwBjAGUAbgB0ACAAMQA4ADUANABSAG8AdQBuAGQAIABiAHIAYQBjAGsAZQB0AHMAIAB3AGkAdABoACAAYQBzAGMAZQBuAHQAIAAxADgANQA0AFYAZQByAHMAaQBvAG4AIAAyAC4AMFJvdW5kX2JyYWNrZXRzX3dpdGhfYXNjZW50XzE4NTQATQBhAHQAaABzACAARgBvAHIAIABNAG8AcgBlAAAAAAMAAAAAAAADnwHPAAAAAAAAAAAAAAAAAAAAAAAAAAC5B%2F8AAY2FAA%3D%3D)format('truetype')%3Bfont-weight%3Anormal%3Bfont-style%3Anormal%3B%7D%3C%2Fstyle%3E%3C%2Fdefs%3E%3Ctext%20font-family%3D%22Times%20New%20Roman%22%20font-size%3D%2216%22%20text-anchor%3D%22middle%22%20x%3D%224.5%22%20y%3D%2215%22%3EP%3C%2Ftext%3E%3Ctext%20font-family%3D%22round_brackets18549f92a457f2409%22%20font-size%3D%2216%22%20text-anchor%3D%22middle%22%20x%3D%2212.5%22%20y%3D%2215%22%3E(%3C%2Ftext%3E%3Ctext%20font-family%3D%22Times%20New%20Roman%22%20font-size%3D%2216%22%20font-style%3D%22italic%22%20text-anchor%3D%22middle%22%20x%3D%2220.5%22%20y%3D%2215%22%3EX%3C%2Ftext%3E%3Ctext%20font-family%3D%22math1595b5ca43595c4d2275abe88ce%22%20font-size%3D%2214%22%20text-anchor%3D%22middle%22%20x%3D%2235.5%22%20y%3D%2215%22%3E%3D%3C%2Ftext%3E%3Ctext%20font-family%3D%22Times%20New%20Roman%22%20font-size%3D%2216%22%20font-style%3D%22italic%22%20text-anchor%3D%22middle%22%20x%3D%2246.5%22%20y%3D%2215%22%3Ea%3C%2Ftext%3E%3Ctext%20font-family%3D%22round_brackets18549f92a457f2409%22%20font-size%3D%2216%22%20text-anchor%3D%22middle%22%20x%3D%2253.5%22%20y%3D%2215%22%3E)%3C%2Ftext%3E%3Ctext%20font-family%3D%22math1595b5ca43595c4d2275abe88ce%22%20font-size%3D%2214%22%20text-anchor%3D%22middle%22%20x%3D%2264.5%22%20y%3D%2215%22%3E%3D%3C%2Ftext%3E%3Ctext%20font-family%3D%22Times%20New%20Roman%22%20font-size%3D%2216%22%20text-anchor%3D%22middle%22%20x%3D%2276.5%22%20y%3D%2215%22%3EP%3C%2Ftext%3E%3Ctext%20font-family%3D%22round_brackets18549f92a457f2409%22%20font-size%3D%2216%22%20text-anchor%3D%22middle%22%20x%3D%2284.5%22%20y%3D%2215%22%3E(%3C%2Ftext%3E%3Ctext%20font-family%3D%22Times%20New%20Roman%22%20font-size%3D%2216%22%20font-style%3D%22italic%22%20text-anchor%3D%22middle%22%20x%3D%2292.5%22%20y%3D%2215%22%3EX%3C%2Ftext%3E%3Ctext%20font-family%3D%22math1595b5ca43595c4d2275abe88ce%22%20font-size%3D%2214%22%20text-anchor%3D%22middle%22%20x%3D%22107.5%22%20y%3D%2215%22%3E%3D%3C%2Ftext%3E%3Ctext%20font-family%3D%22Times%20New%20Roman%22%20font-size%3D%2216%22%20font-style%3D%22italic%22%20text-anchor%3D%22middle%22%20x%3D%22119.5%22%20y%3D%2215%22%3Eb%3C%2Ftext%3E%3Ctext%20font-family%3D%22round_brackets18549f92a457f2409%22%20font-size%3D%2216%22%20text-anchor%3D%22middle%22%20x%3D%22126.5%22%20y%3D%2215%22%3E)%3C%2Ftext%3E%3Ctext%20font-family%3D%22math1595b5ca43595c4d2275abe88ce%22%20font-size%3D%2214%22%20text-anchor%3D%22middle%22%20x%3D%22137.5%22%20y%3D%2215%22%3E%3D%3C%2Ftext%3E%3Ctext%20font-family%3D%22Times%20New%20Roman%22%20font-size%3D%2216%22%20text-anchor%3D%22middle%22%20x%3D%22149.5%22%20y%3D%2215%22%3E0%3C%2Ftext%3E%3Ctext%20font-family%3D%22math1595b5ca43595c4d2275abe88ce%22%20font-size%3D%2214%22%20text-anchor%3D%22middle%22%20x%3D%22155.5%22%20y%3D%2215%22%3E%2C%3C%2Ftext%3E%3Ctext%20font-family%3D%22Times%20New%20Roman%22%20font-size%3D%2216%22%20text-anchor%3D%22middle%22%20x%3D%22165.5%22%20y%3D%2215%22%3EP%3C%2Ftext%3E%3Ctext%20font-family%3D%22round_brackets18549f92a457f2409%22%20font-size%3D%2216%22%20text-anchor%3D%22middle%22%20x%3D%22173.5%22%20y%3D%2215%22%3E(%3C%2Ftext%3E%3Ctext%20font-family%3D%22Times%20New%20Roman%22%20font-size%3D%2216%22%20font-style%3D%22italic%22%20text-anchor%3D%22middle%22%20x%3D%22178.5%22%20y%3D%2215%22%3Ea%3C%2Ftext%3E%3Ctext%20font-family%3D%22math1595b5ca43595c4d2275abe88ce%22%20font-size%3D%2214%22%20text-anchor%3D%22middle%22%20x%3D%22190.5%22%20y%3D%2215%22%3E%26%23x2264%3B%3C%2Ftext%3E%3Ctext%20font-family%3D%22Times%20New%20Roman%22%20font-size%3D%2216%22%20font-style%3D%22italic%22%20text-anchor%3D%22middle%22%20x%3D%22204.5%22%20y%3D%2215%22%3EX%3C%2Ftext%3E%3Ctext%20font-family%3D%22math1595b5ca43595c4d2275abe88ce%22%20font-size%3D%2214%22%20text-anchor%3D%22middle%22%20x%3D%22218.5%22%20y%3D%2215%22%3E%26%23x2264%3B%3C%2Ftext%3E%3Ctext%20font-family%3D%22Times%20New%20Roman%22%20font-size%3D%2216%22%20font-style%3D%22italic%22%20text-anchor%3D%22middle%22%20x%3D%22230.5%22%20y%3D%2215%22%3Eb%3C%2Ftext%3E%3Ctext%20font-family%3D%22round_brackets18549f92a457f2409%22%20font-size%3D%2216%22%20text-anchor%3D%22middle%22%20x%3D%22237.5%22%20y%3D%2215%22%3E)%3C%2Ftext%3E%3Ctext%20font-family%3D%22math1595b5ca43595c4d2275abe88ce%22%20font-size%3D%2214%22%20text-anchor%3D%22middle%22%20x%3D%22248.5%22%20y%3D%2215%22%3E%3D%3C%2Ftext%3E%3Ctext%20font-family%3D%22Times%20New%20Roman%22%20font-size%3D%2216%22%20text-anchor%3D%22middle%22%20x%3D%22260.5%22%20y%3D%2215%22%3EP%3C%2Ftext%3E%3Ctext%20font-family%3D%22round_brackets18549f92a457f2409%22%20font-size%3D%2216%22%20text-anchor%3D%22middle%22%20x%3D%22268.5%22%20y%3D%2215%22%3E(%3C%2Ftext%3E%3Ctext%20font-family%3D%22Times%20New%20Roman%22%20font-size%3D%2216%22%20font-style%3D%22italic%22%20text-anchor%3D%22middle%22%20x%3D%22273.5%22%20y%3D%2215%22%3Ea%3C%2Ftext%3E%3Ctext%20font-family%3D%22math1595b5ca43595c4d2275abe88ce%22%20font-size%3D%2214%22%20text-anchor%3D%22middle%22%20x%3D%22285.5%22%20y%3D%2215%22%3E%26lt%3B%3C%2Ftext%3E%3Ctext%20font-family%3D%22Times%20New%20Roman%22%20font-size%3D%2216%22%20font-style%3D%22italic%22%20text-anchor%3D%22middle%22%20x%3D%22299.5%22%20y%3D%2215%22%3EX%3C%2Ftext%3E%3Ctext%20font-family%3D%22math1595b5ca43595c4d2275abe88ce%22%20font-size%3D%2214%22%20text-anchor%3D%22middle%22%20x%3D%22313.5%22%20y%3D%2215%22%3E%26lt%3B%3C%2Ftext%3E%3Ctext%20font-family%3D%22Times%20New%20Roman%22%20font-size%3D%2216%22%20font-style%3D%22italic%22%20text-anchor%3D%22middle%22%20x%3D%22325.5%22%20y%3D%2215%22%3Eb%3C%2Ftext%3E%3Ctext%20font-family%3D%22round_brackets18549f92a457f2409%22%20font-size%3D%2216%22%20text-anchor%3D%22middle%22%20x%3D%22332.5%22%20y%3D%2215%22%3E)%3C%2Ftext%3E%3C%2Fsvg%3E)
Worked Example
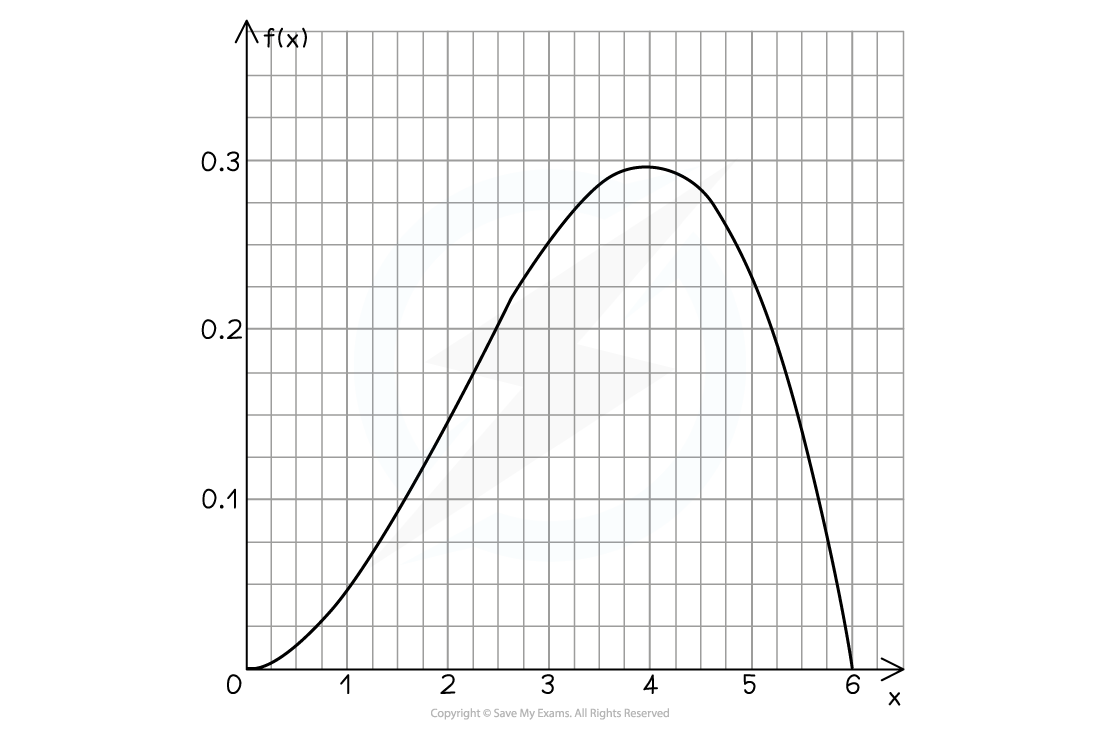
The continuous random variable, ![]() , has probability density function
, has probability density function
%3C%2Fmo%3E%3Cmo%3E%3D%3C%2Fmo%3E%3Cmfenced%20close%3D%22%22%20open%3D%22%7B%22%3E%3Cmtable%20columnalign%3D%22left%22%20columnspacing%3D%221.4ex%22%3E%3Cmtr%3E%3Cmtd%3E%3Cmn%3E0%3C%2Fmn%3E%3Cmo%3E.%3C%2Fmo%3E%3Cmn%3E08%3C%2Fmn%3E%3Cmi%3Ex%3C%2Fmi%3E%3C%2Fmtd%3E%3Cmtd%3E%3Cmn%3E0%3C%2Fmn%3E%3Cmo%3E%26%23x2264%3B%3C%2Fmo%3E%3Cmi%3Ex%3C%2Fmi%3E%3Cmo%3E%26%23x2264%3B%3C%2Fmo%3E%3Cmn%3E5%3C%2Fmn%3E%3C%2Fmtd%3E%3C%2Fmtr%3E%3Cmtr%3E%3Cmtd%3E%3Cmn%3E0%3C%2Fmn%3E%3C%2Fmtd%3E%3Cmtd%3E%3Cmi%3Eotherwise%3C%2Fmi%3E%3C%2Fmtd%3E%3C%2Fmtr%3E%3C%2Fmtable%3E%3C%2Fmfenced%3E%3C%2Fmath%3E--%3E%3Cdefs%3E%3Cstyle%20type%3D%22text%2Fcss%22%3E%40font-face%7Bfont-family%3A'math1a3e9e66d3b0fb1281f7814e8d5'%3Bsrc%3Aurl(data%3Afont%2Ftruetype%3Bcharset%3Dutf-8%3Bbase64%2CAAEAAAAMAIAAAwBAT1MvMi7iBBMAAADMAAAATmNtYXDEvmKUAAABHAAAAERjdnQgDVUNBwAAAWAAAAA6Z2x5ZoPi2VsAAAGcAAABYWhlYWQQC2qxAAADAAAAADZoaGVhCGsXSAAAAzgAAAAkaG10eE2rRkcAAANcAAAAEGxvY2EAHTwYAAADbAAAABRtYXhwBT0FPgAAA4AAAAAgbmFtZaBxlY4AAAOgAAABn3Bvc3QB9wD6AAAFQAAAACBwcmVwa1uragAABWAAAAAUAAADSwGQAAUAAAQABAAAAAAABAAEAAAAAAAAAQEAAAAAAAAAAAAAAAAAAAAAAAAAAAAAAAAAAAAAACAgICAAAAAg1UADev96AAAD6ACWAAAAAAACAAEAAQAAABQAAwABAAAAFAAEADAAAAAIAAgAAgAAAC4APSJk%2F%2F8AAAAuAD0iZP%2F%2F%2F9P%2Fxd2fAAEAAAAAAAAAAAAAAVQDLACAAQAAVgAqAlgCHgEOASwCLABaAYACgACgANQAgAAAAAAAAAArAFUAgACrANUBAAErAAcAAAACAFUAAAMAA6sAAwAHAAAzESERJSERIVUCq%2F2rAgD%2BAAOr%2FFVVAwAAAQAgAAAAoACAAAMALxgBsAQQsAPUsAMQsALUsAMQsAA8sAIQsAE8ALAEELAD1LADELACPLAAELABPDAxNzMVIyCAgICAAAIAgADrAtUCFQADAAcAZRgBsAgQsAbUsAYQsAXUsAgQsAHUsAEQsADUsAYQsAc8sAUQsAQ8sAEQsAI8sAAQsAM8ALAIELAG1LAGELAH1LAHELAB1LABELAC1LAGELAFPLAHELAEPLABELAAPLACELADPDEwEyE1IR0BITWAAlX9qwJVAcBV1VVVAAMAgP%2BrAoACqwADAAcACwAvGAEAsQkAP7EIBeSxAgX0sQEE9LEGBfSxAwTksQUE9LEEBfSxBwEQPLEABhA8MDETBwE1EzUBFwE1IRWBAQH%2FAf4AAQH%2F%2FgABq1b%2FAFYBqlb%2FAFb%2BVlVVAAAAAAEAAAABAADVeM5BXw889QADBAD%2F%2F%2F%2F%2F1joTc%2F%2F%2F%2F%2F%2FWOhNzAAD%2FIASAA6sAAAAKAAIAAQAAAAAAAQAAA%2Bj%2FagAAF3AAAP%2B2BIAAAQAAAAAAAAAAAAAAAAAAAAQDUgBVAMgAIANWAIADAACAAAAAAAAAACgAAABuAAAA%2BAAAAWEAAQAAAAQAXgAFAAAAAAACAIAEAAAAAAAEAADeAAAAAAAAABUBAgAAAAAAAAABABIAAAAAAAAAAAACAA4AEgAAAAAAAAADADAAIAAAAAAAAAAEABIAUAAAAAAAAAAFABYAYgAAAAAAAAAGAAkAeAAAAAAAAAAIABwAgQABAAAAAAABABIAAAABAAAAAAACAA4AEgABAAAAAAADADAAIAABAAAAAAAEABIAUAABAAAAAAAFABYAYgABAAAAAAAGAAkAeAABAAAAAAAIABwAgQADAAEECQABABIAAAADAAEECQACAA4AEgADAAEECQADADAAIAADAAEECQAEABIAUAADAAEECQAFABYAYgADAAEECQAGAAkAeAADAAEECQAIABwAgQBNAGEAdABoACAARgBvAG4AdABSAGUAZwB1AGwAYQByAE0AYQB0AGgAcwAgAEYAbwByACAATQBvAHIAZQAgAE0AYQB0AGgAIABGAG8AbgB0AE0AYQB0AGgAIABGAG8AbgB0AFYAZQByAHMAaQBvAG4AIAAxAC4AME1hdGhfRm9udABNAGEAdABoAHMAIABGAG8AcgAgAE0AbwByAGUAAAMAAAAAAAAB9AD6AAAAAAAAAAAAAAAAAAAAAAAAAAC5BxEAAI2FGACyAAAAFRQTsQABPw%3D%3D)format('truetype')%3Bfont-weight%3Anormal%3Bfont-style%3Anormal%3B%7D%40font-face%7Bfont-family%3A'brack_sm74a4ec520979a73b06ad972'%3Bsrc%3Aurl(data%3Afont%2Ftruetype%3Bcharset%3Dutf-8%3Bbase64%2CAAEAAAAMAIAAAwBAT1MvMi7PH4UAAADMAAAATmNtYXA3kjw6AAABHAAAAExjdnQgAQYDiAAAAWgAAAASZ2x5ZkyYQ7YAAAF8AAABLGhlYWQLyR8fAAACqAAAADZoaGVhAq0XCAAAAuAAAAAkaG10eDEjA%2FUAAAMEAAAAFGxvY2EAAEKZAAADGAAAABhtYXhwBJsEcQAAAzAAAAAgbmFtZW7QvZAAAANQAAAB5XBvc3QArQBVAAAFOAAAACBwcmVwu5WEAAAABVgAAAAHAAACDAGQAAUAAAQABAAAAAAABAAEAAAAAAAAAQEAAAAAAAAAAAAAAAAAAAAAAAAAAAAAAAAAAAAAACAgICAAAAAg9AMD%2FP%2F8AAABVAABAAAAAAACAAEAAQAAABQAAwABAAAAFAAEADgAAAAKAAgAAgACI6cjqCOpI6r%2F%2FwAAI6cjqCOpI6r%2F%2F9xa3FrcWtxaAAEAAAAAAAAAAAAAAAABVABUAQAAKwCMAIAAqAAHAAAAAgAAAAAA1QEBAAMABwAAMTMRIxcjNTPV1auAgAEB1qsAAQAAAAABAAFVAAcAIxgBsQAAP7EHAv2xAwf8sAQ8ALEAAD%2BwBzyxAwH2sQQE%2FTEwMTQ2NxUOARVrlWtAa8AqKivAQAAB%2F4AAAABVAVQACQAhGAGxBQA%2FsAE8sQYC%2FbAAPACxBQA%2FsAY8sQEBP7AAPDEwEyMUBxYVMzQnNlVVgIBVgIABVFVUVlVVVlQAAQAAAAABAAFUAAcAIxgBsQAAP7EHAv2xAwf8sAQ8ALEAAT%2BwBzyxAwH2sQQE%2FTEwERQWFzUuATVrlWtAAVRqwCorKcBAAAEAAAAAAFUBVAADACAYAbAEELAAPLADPLEBAvWwAjwAsAMvsAI8sQAB9bABPBEzESNVVQFU%2FqwAAQAAAAEAAIsesexfDzz1AAMEAP%2F%2F%2F%2F%2FVre5k%2F%2F%2F%2F%2F9Wt7mT%2FgP%2F%2FAdYBWAAAAAoAAgABAAAAAAABAAABVP%2F%2FAAAXcP%2BA%2F4AB1gABAAAAAAAAAAAAAAAAAAAABQDVAAABAAAAAQD%2FgAEAAAABAAAAAAAAAAAAACEAAABlAAAArgAAAPQAAAEsAAEAAAAFAAoAAgAAAAAAAgCABAAAAAAABAAAZQAAAAAAAAAVAQIAAAAAAAAAAQAmAAAAAAAAAAAAAgAOACYAAAAAAAAAAwBEADQAAAAAAAAABAAmAHgAAAAAAAAABQAWAJ4AAAAAAAAABgATALQAAAAAAAAACAAcAMcAAQAAAAAAAQAmAAAAAQAAAAAAAgAOACYAAQAAAAAAAwBEADQAAQAAAAAABAAmAHgAAQAAAAAABQAWAJ4AAQAAAAAABgATALQAAQAAAAAACAAcAMcAAwABBAkAAQAmAAAAAwABBAkAAgAOACYAAwABBAkAAwBEADQAAwABBAkABAAmAHgAAwABBAkABQAWAJ4AAwABBAkABgATALQAAwABBAkACAAcAMcAQgByAGEAYwBrAGUAdABzACAAcwBtAGEAbABsACAAcwBpAHoAZQBSAGUAZwB1AGwAYQByAE0AYQB0AGgAcwAgAEYAbwByACAATQBvAHIAZQAgAEIAcgBhAGMAawBlAHQAcwAgAHMAbQBhAGwAbAAgAHMAaQB6AGUAQgByAGEAYwBrAGUAdABzACAAcwBtAGEAbABsACAAcwBpAHoAZQBWAGUAcgBzAGkAbwBuACAAMgAuADBCcmFja2V0c19zbWFsbF9zaXplAE0AYQB0AGgAcwAgAEYAbwByACAATQBvAHIAZQAAAAADAAAAAAAAAKoAVQAAAAAAAAAAAAAAAAAAAAAAAAAAuQf%2FAAKNhQA%3D)format('truetype')%3Bfont-weight%3Anormal%3Bfont-style%3Anormal%3B%7D%40font-face%7Bfont-family%3A'round_brackets18549f92a457f2409'%3Bsrc%3Aurl(data%3Afont%2Ftruetype%3Bcharset%3Dutf-8%3Bbase64%2CAAEAAAAMAIAAAwBAT1MvMjwHLFQAAADMAAAATmNtYXDf7xCrAAABHAAAADxjdnQgBAkDLgAAAVgAAAASZ2x5ZmAOz2cAAAFsAAABJGhlYWQOKih8AAACkAAAADZoaGVhCvgVwgAAAsgAAAAkaG10eCA6AAIAAALsAAAADGxvY2EAAARLAAAC%2BAAAABBtYXhwBIgEWQAAAwgAAAAgbmFtZXHR30MAAAMoAAACOXBvc3QDogHPAAAFZAAAACBwcmVwupWEAAAABYQAAAAHAAAGcgGQAAUAAAgACAAAAAAACAAIAAAAAAAAAQIAAAAAAAAAAAAAAAAAAAAAAAAAAAAAAAAAAAAAACAgICAAAAAo8AMGe%2F57AAAHPgGyAAAAAAACAAEAAQAAABQAAwABAAAAFAAEACgAAAAGAAQAAQACACgAKf%2F%2FAAAAKAAp%2F%2F%2F%2F2f%2FZAAEAAAAAAAAAAAFUAFYBAAAsAKgDgAAyAAcAAAACAAAAKgDVA1UAAwAHAAA1MxEjEyMRM9XVq4CAKgMr%2FQAC1QABAAD%2B0AIgBtAACQBNGAGwChCwA9SwAxCwAtSwChCwBdSwBRCwANSwAxCwBzywAhCwCDwAsAoQsAPUsAMQsAfUsAoQsAXUsAoQsADUsAMQsAI8sAcQsAg8MTAREAEzABEQASMAAZCQ%2FnABkJD%2BcALQ%2FZD%2BcAGQAnACcAGQ%2FnAAAQAA%2FtACIAbQAAkATRgBsAoQsAPUsAMQsALUsAoQsAXUsAUQsADUsAMQsAc8sAIQsAg8ALAKELAD1LADELAH1LAKELAF1LAKELAA1LADELACPLAHELAIPDEwARABIwAREAEzAAIg%2FnCQAZD%2BcJABkALQ%2FZD%2BcAGQAnACcAGQ%2FnAAAQAAAAEAAPW2NYFfDzz1AAMIAP%2F%2F%2F%2F%2FVre7u%2F%2F%2F%2F%2F9Wt7u4AAP7QA7cG0AAAAAoAAgABAAAAAAABAAAHPv5OAAAXcAAA%2F%2F4DtwABAAAAAAAAAAAAAAAAAAAAAwDVAAACIAAAAiAAAAAAAAAAAAAkAAAAowAAASQAAQAAAAMACgACAAAAAAACAIAEAAAAAAAEAABNAAAAAAAAABUBAgAAAAAAAAABAD4AAAAAAAAAAAACAA4APgAAAAAAAAADAFwATAAAAAAAAAAEAD4AqAAAAAAAAAAFABYA5gAAAAAAAAAGAB8A%2FAAAAAAAAAAIABwBGwABAAAAAAABAD4AAAABAAAAAAACAA4APgABAAAAAAADAFwATAABAAAAAAAEAD4AqAABAAAAAAAFABYA5gABAAAAAAAGAB8A%2FAABAAAAAAAIABwBGwADAAEECQABAD4AAAADAAEECQACAA4APgADAAEECQADAFwATAADAAEECQAEAD4AqAADAAEECQAFABYA5gADAAEECQAGAB8A%2FAADAAEECQAIABwBGwBSAG8AdQBuAGQAIABiAHIAYQBjAGsAZQB0AHMAIAB3AGkAdABoACAAYQBzAGMAZQBuAHQAIAAxADgANQA0AFIAZQBnAHUAbABhAHIATQBhAHQAaABzACAARgBvAHIAIABNAG8AcgBlACAAUgBvAHUAbgBkACAAYgByAGEAYwBrAGUAdABzACAAdwBpAHQAaAAgAGEAcwBjAGUAbgB0ACAAMQA4ADUANABSAG8AdQBuAGQAIABiAHIAYQBjAGsAZQB0AHMAIAB3AGkAdABoACAAYQBzAGMAZQBuAHQAIAAxADgANQA0AFYAZQByAHMAaQBvAG4AIAAyAC4AMFJvdW5kX2JyYWNrZXRzX3dpdGhfYXNjZW50XzE4NTQATQBhAHQAaABzACAARgBvAHIAIABNAG8AcgBlAAAAAAMAAAAAAAADnwHPAAAAAAAAAAAAAAAAAAAAAAAAAAC5B%2F8AAY2FAA%3D%3D)format('truetype')%3Bfont-weight%3Anormal%3Bfont-style%3Anormal%3B%7D%3C%2Fstyle%3E%3C%2Fdefs%3E%3Ctext%20font-family%3D%22Times%20New%20Roman%22%20font-size%3D%2218%22%20text-anchor%3D%22middle%22%20x%3D%223.5%22%20y%3D%2233%22%3Ef%3C%2Ftext%3E%3Ctext%20font-family%3D%22round_brackets18549f92a457f2409%22%20font-size%3D%2218%22%20text-anchor%3D%22middle%22%20x%3D%2211.5%22%20y%3D%2233%22%3E(%3C%2Ftext%3E%3Ctext%20font-family%3D%22Times%20New%20Roman%22%20font-size%3D%2218%22%20font-style%3D%22italic%22%20text-anchor%3D%22middle%22%20x%3D%2218.5%22%20y%3D%2233%22%3Ex%3C%2Ftext%3E%3Ctext%20font-family%3D%22round_brackets18549f92a457f2409%22%20font-size%3D%2218%22%20text-anchor%3D%22middle%22%20x%3D%2226.5%22%20y%3D%2233%22%3E)%3C%2Ftext%3E%3Ctext%20font-family%3D%22math1a3e9e66d3b0fb1281f7814e8d5%22%20font-size%3D%2216%22%20text-anchor%3D%22middle%22%20x%3D%2238.5%22%20y%3D%2233%22%3E%3D%3C%2Ftext%3E%3Ctext%20font-family%3D%22brack_sm74a4ec520979a73b06ad972%22%20font-size%3D%2218%22%20text-anchor%3D%22start%22%20x%3D%2250.5%22%20y%3D%2213%22%3E%26%23x23A7%3B%3C%2Ftext%3E%3Ctext%20font-family%3D%22brack_sm74a4ec520979a73b06ad972%22%20font-size%3D%2218%22%20text-anchor%3D%22start%22%20x%3D%2250.5%22%20y%3D%2219%22%3E%26%23x23AA%3B%3C%2Ftext%3E%3Ctext%20font-family%3D%22brack_sm74a4ec520979a73b06ad972%22%20font-size%3D%2218%22%20text-anchor%3D%22start%22%20x%3D%2250.5%22%20y%3D%2225%22%3E%26%23x23AA%3B%3C%2Ftext%3E%3Ctext%20font-family%3D%22brack_sm74a4ec520979a73b06ad972%22%20font-size%3D%2218%22%20text-anchor%3D%22start%22%20x%3D%2250.5%22%20y%3D%2231%22%3E%26%23x23A8%3B%3C%2Ftext%3E%3Ctext%20font-family%3D%22brack_sm74a4ec520979a73b06ad972%22%20font-size%3D%2218%22%20text-anchor%3D%22start%22%20x%3D%2250.5%22%20y%3D%2237%22%3E%26%23x23AA%3B%3C%2Ftext%3E%3Ctext%20font-family%3D%22brack_sm74a4ec520979a73b06ad972%22%20font-size%3D%2218%22%20text-anchor%3D%22start%22%20x%3D%2250.5%22%20y%3D%2243%22%3E%26%23x23AA%3B%3C%2Ftext%3E%3Ctext%20font-family%3D%22brack_sm74a4ec520979a73b06ad972%22%20font-size%3D%2218%22%20text-anchor%3D%22start%22%20x%3D%2250.5%22%20y%3D%2249%22%3E%26%23x23A9%3B%3C%2Ftext%3E%3Ctext%20font-family%3D%22Times%20New%20Roman%22%20font-size%3D%2218%22%20text-anchor%3D%22middle%22%20x%3D%2264.5%22%20y%3D%2219%22%3E0%3C%2Ftext%3E%3Ctext%20font-family%3D%22math1a3e9e66d3b0fb1281f7814e8d5%22%20font-size%3D%2216%22%20text-anchor%3D%22middle%22%20x%3D%2271.5%22%20y%3D%2219%22%3E.%3C%2Ftext%3E%3Ctext%20font-family%3D%22Times%20New%20Roman%22%20font-size%3D%2218%22%20text-anchor%3D%22middle%22%20x%3D%2283.5%22%20y%3D%2219%22%3E08%3C%2Ftext%3E%3Ctext%20font-family%3D%22Times%20New%20Roman%22%20font-size%3D%2218%22%20font-style%3D%22italic%22%20text-anchor%3D%22middle%22%20x%3D%2296.5%22%20y%3D%2219%22%3Ex%3C%2Ftext%3E%3Ctext%20font-family%3D%22Times%20New%20Roman%22%20font-size%3D%2218%22%20text-anchor%3D%22middle%22%20x%3D%22121.5%22%20y%3D%2219%22%3E0%3C%2Ftext%3E%3Ctext%20font-family%3D%22math1a3e9e66d3b0fb1281f7814e8d5%22%20font-size%3D%2216%22%20text-anchor%3D%22middle%22%20x%3D%22134.5%22%20y%3D%2219%22%3E%26%23x2264%3B%3C%2Ftext%3E%3Ctext%20font-family%3D%22Times%20New%20Roman%22%20font-size%3D%2218%22%20font-style%3D%22italic%22%20text-anchor%3D%22middle%22%20x%3D%22146.5%22%20y%3D%2219%22%3Ex%3C%2Ftext%3E%3Ctext%20font-family%3D%22math1a3e9e66d3b0fb1281f7814e8d5%22%20font-size%3D%2216%22%20text-anchor%3D%22middle%22%20x%3D%22160.5%22%20y%3D%2219%22%3E%26%23x2264%3B%3C%2Ftext%3E%3Ctext%20font-family%3D%22Times%20New%20Roman%22%20font-size%3D%2218%22%20text-anchor%3D%22middle%22%20x%3D%22172.5%22%20y%3D%2219%22%3E5%3C%2Ftext%3E%3Ctext%20font-family%3D%22Times%20New%20Roman%22%20font-size%3D%2218%22%20text-anchor%3D%22middle%22%20x%3D%2264.5%22%20y%3D%2245%22%3E0%3C%2Ftext%3E%3Ctext%20font-family%3D%22Times%20New%20Roman%22%20font-size%3D%2218%22%20text-anchor%3D%22middle%22%20x%3D%22152.5%22%20y%3D%2245%22%3Eotherwise%3C%2Ftext%3E%3C%2Fsvg%3E)
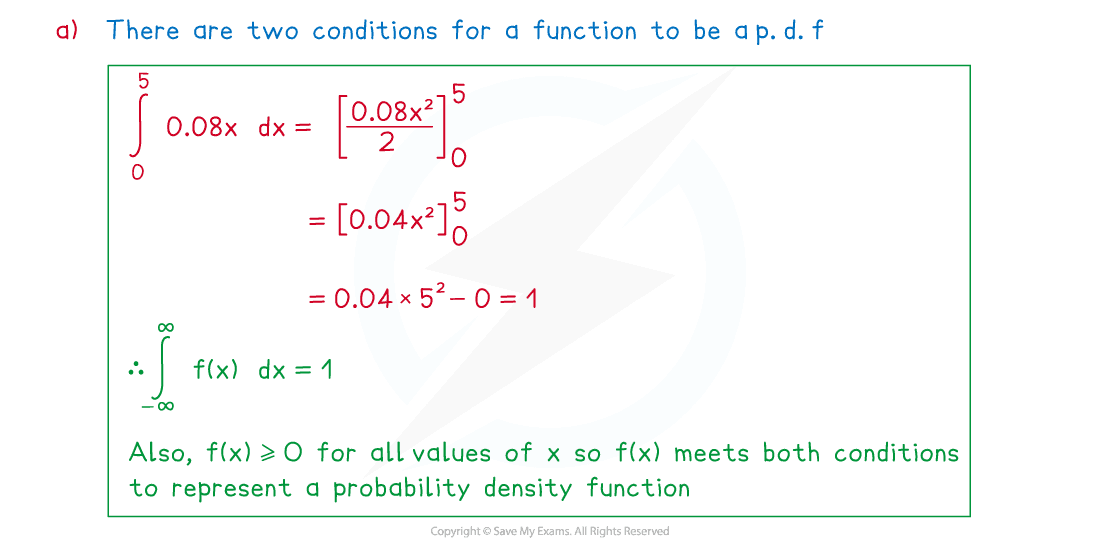
(a) Show that ![]() can represent a probability density function
can represent a probability density function
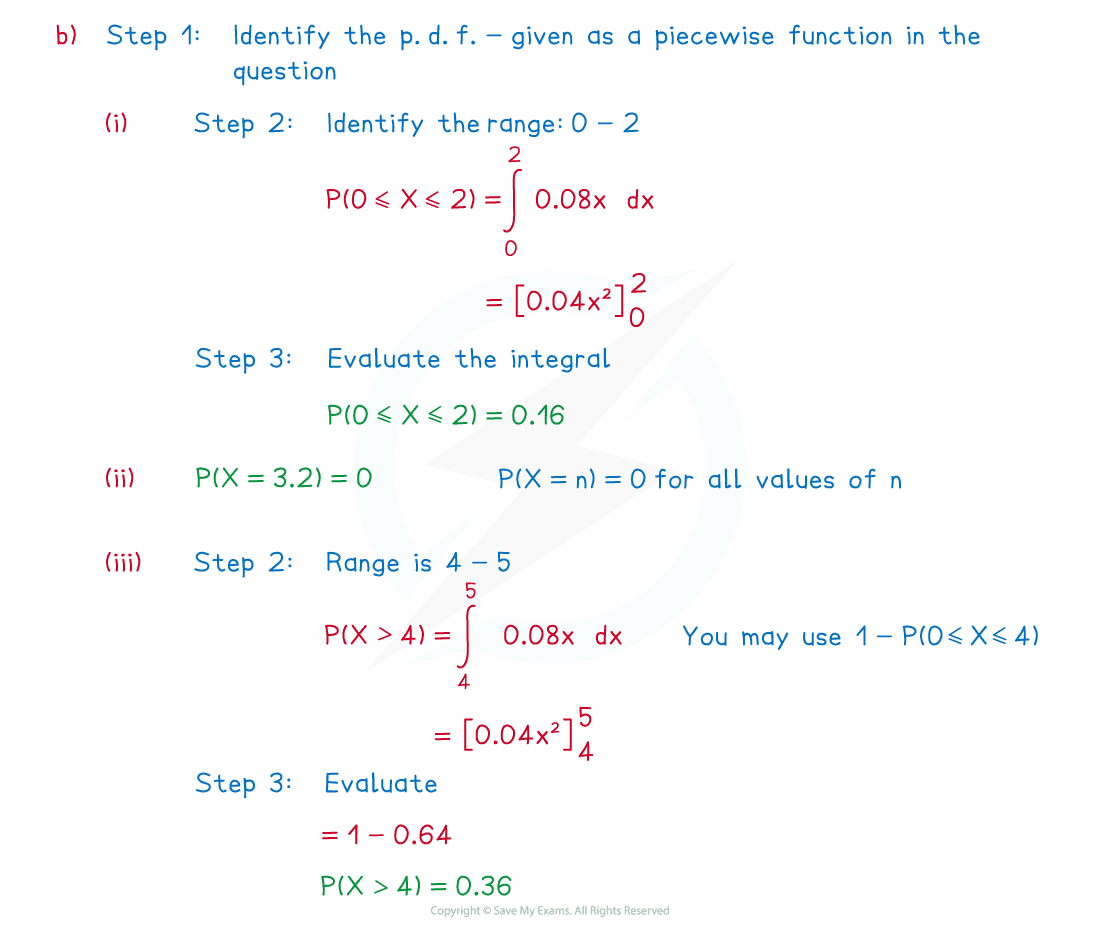
(b) Find
(i) ![]()
(ii) ![]()
(iii) ![]()
Examiner Tips and Tricks
If the graph is easy to draw, then a sketch of f(x) is helpful
This can highlight useful features such as the graph (and so probabilities) being symmetrical
Some p.d.f. graphs lead to common shapes such as triangles or rectangles whose areas are easy to find, avoiding the need for integration
Did this video help you?
Median and Mode of a CRV
What is meant by the median of a continuous random variable?
The median, m, of a continuous random variable, X , with probability density function f(x) is defined as the value of the continuous random variable X, such that
![]()
Since
%3C%2Fmo%3E%3Cmo%3E%3D%3C%2Fmo%3E%3Cmn%3E0%3C%2Fmn%3E%3C%2Fmstyle%3E%3C%2Fmath%3E--%3E%3Cdefs%3E%3Cstyle%20type%3D%22text%2Fcss%22%3E%40font-face%7Bfont-family%3A'math17f39f8317fbdb1988ef4c628eb'%3Bsrc%3Aurl(data%3Afont%2Ftruetype%3Bcharset%3Dutf-8%3Bbase64%2CAAEAAAAMAIAAAwBAT1MvMi7iBBMAAADMAAAATmNtYXDEvmKUAAABHAAAADRjdnQgDVUNBwAAAVAAAAA6Z2x5ZoPi2VsAAAGMAAAAsmhlYWQQC2qxAAACQAAAADZoaGVhCGsXSAAAAngAAAAkaG10eE2rRkcAAAKcAAAACGxvY2EAHTwYAAACpAAAAAxtYXhwBT0FPgAAArAAAAAgbmFtZaBxlY4AAALQAAABn3Bvc3QB9wD6AAAEcAAAACBwcmVwa1uragAABJAAAAAUAAADSwGQAAUAAAQABAAAAAAABAAEAAAAAAAAAQEAAAAAAAAAAAAAAAAAAAAAAAAAAAAAAAAAAAAAACAgICAAAAAg1UADev96AAAD6ACWAAAAAAACAAEAAQAAABQAAwABAAAAFAAEACAAAAAEAAQAAQAAAD3%2F%2FwAAAD3%2F%2F%2F%2FEAAEAAAAAAAABVAMsAIABAABWACoCWAIeAQ4BLAIsAFoBgAKAAKAA1ACAAAAAAAAAACsAVQCAAKsA1QEAASsABwAAAAIAVQAAAwADqwADAAcAADMRIRElIREhVQKr%2FasCAP4AA6v8VVUDAAACAIAA6wLVAhUAAwAHAGUYAbAIELAG1LAGELAF1LAIELAB1LABELAA1LAGELAHPLAFELAEPLABELACPLAAELADPACwCBCwBtSwBhCwB9SwBxCwAdSwARCwAtSwBhCwBTywBxCwBDywARCwADywAhCwAzwxMBMhNSEdASE1gAJV%2FasCVQHAVdVVVQAAAAEAAAABAADVeM5BXw889QADBAD%2F%2F%2F%2F%2F1joTc%2F%2F%2F%2F%2F%2FWOhNzAAD%2FIASAA6sAAAAKAAIAAQAAAAAAAQAAA%2Bj%2FagAAF3AAAP%2B2BIAAAQAAAAAAAAAAAAAAAAAAAAIDUgBVA1YAgAAAAAAAAAAoAAAAsgABAAAAAgBeAAUAAAAAAAIAgAQAAAAAAAQAAN4AAAAAAAAAFQECAAAAAAAAAAEAEgAAAAAAAAAAAAIADgASAAAAAAAAAAMAMAAgAAAAAAAAAAQAEgBQAAAAAAAAAAUAFgBiAAAAAAAAAAYACQB4AAAAAAAAAAgAHACBAAEAAAAAAAEAEgAAAAEAAAAAAAIADgASAAEAAAAAAAMAMAAgAAEAAAAAAAQAEgBQAAEAAAAAAAUAFgBiAAEAAAAAAAYACQB4AAEAAAAAAAgAHACBAAMAAQQJAAEAEgAAAAMAAQQJAAIADgASAAMAAQQJAAMAMAAgAAMAAQQJAAQAEgBQAAMAAQQJAAUAFgBiAAMAAQQJAAYACQB4AAMAAQQJAAgAHACBAE0AYQB0AGgAIABGAG8AbgB0AFIAZQBnAHUAbABhAHIATQBhAHQAaABzACAARgBvAHIAIABNAG8AcgBlACAATQBhAHQAaAAgAEYAbwBuAHQATQBhAHQAaAAgAEYAbwBuAHQAVgBlAHIAcwBpAG8AbgAgADEALgAwTWF0aF9Gb250AE0AYQB0AGgAcwAgAEYAbwByACAATQBvAHIAZQAAAwAAAAAAAAH0APoAAAAAAAAAAAAAAAAAAAAAAAAAALkHEQAAjYUYALIAAAAVFBOxAAE%2F)format('truetype')%3Bfont-weight%3Anormal%3Bfont-style%3Anormal%3B%7D%40font-face%7Bfont-family%3A'round_brackets18549f92a457f2409'%3Bsrc%3Aurl(data%3Afont%2Ftruetype%3Bcharset%3Dutf-8%3Bbase64%2CAAEAAAAMAIAAAwBAT1MvMjwHLFQAAADMAAAATmNtYXDf7xCrAAABHAAAADxjdnQgBAkDLgAAAVgAAAASZ2x5ZmAOz2cAAAFsAAABJGhlYWQOKih8AAACkAAAADZoaGVhCvgVwgAAAsgAAAAkaG10eCA6AAIAAALsAAAADGxvY2EAAARLAAAC%2BAAAABBtYXhwBIgEWQAAAwgAAAAgbmFtZXHR30MAAAMoAAACOXBvc3QDogHPAAAFZAAAACBwcmVwupWEAAAABYQAAAAHAAAGcgGQAAUAAAgACAAAAAAACAAIAAAAAAAAAQIAAAAAAAAAAAAAAAAAAAAAAAAAAAAAAAAAAAAAACAgICAAAAAo8AMGe%2F57AAAHPgGyAAAAAAACAAEAAQAAABQAAwABAAAAFAAEACgAAAAGAAQAAQACACgAKf%2F%2FAAAAKAAp%2F%2F%2F%2F2f%2FZAAEAAAAAAAAAAAFUAFYBAAAsAKgDgAAyAAcAAAACAAAAKgDVA1UAAwAHAAA1MxEjEyMRM9XVq4CAKgMr%2FQAC1QABAAD%2B0AIgBtAACQBNGAGwChCwA9SwAxCwAtSwChCwBdSwBRCwANSwAxCwBzywAhCwCDwAsAoQsAPUsAMQsAfUsAoQsAXUsAoQsADUsAMQsAI8sAcQsAg8MTAREAEzABEQASMAAZCQ%2FnABkJD%2BcALQ%2FZD%2BcAGQAnACcAGQ%2FnAAAQAA%2FtACIAbQAAkATRgBsAoQsAPUsAMQsALUsAoQsAXUsAUQsADUsAMQsAc8sAIQsAg8ALAKELAD1LADELAH1LAKELAF1LAKELAA1LADELACPLAHELAIPDEwARABIwAREAEzAAIg%2FnCQAZD%2BcJABkALQ%2FZD%2BcAGQAnACcAGQ%2FnAAAQAAAAEAAPW2NYFfDzz1AAMIAP%2F%2F%2F%2F%2FVre7u%2F%2F%2F%2F%2F9Wt7u4AAP7QA7cG0AAAAAoAAgABAAAAAAABAAAHPv5OAAAXcAAA%2F%2F4DtwABAAAAAAAAAAAAAAAAAAAAAwDVAAACIAAAAiAAAAAAAAAAAAAkAAAAowAAASQAAQAAAAMACgACAAAAAAACAIAEAAAAAAAEAABNAAAAAAAAABUBAgAAAAAAAAABAD4AAAAAAAAAAAACAA4APgAAAAAAAAADAFwATAAAAAAAAAAEAD4AqAAAAAAAAAAFABYA5gAAAAAAAAAGAB8A%2FAAAAAAAAAAIABwBGwABAAAAAAABAD4AAAABAAAAAAACAA4APgABAAAAAAADAFwATAABAAAAAAAEAD4AqAABAAAAAAAFABYA5gABAAAAAAAGAB8A%2FAABAAAAAAAIABwBGwADAAEECQABAD4AAAADAAEECQACAA4APgADAAEECQADAFwATAADAAEECQAEAD4AqAADAAEECQAFABYA5gADAAEECQAGAB8A%2FAADAAEECQAIABwBGwBSAG8AdQBuAGQAIABiAHIAYQBjAGsAZQB0AHMAIAB3AGkAdABoACAAYQBzAGMAZQBuAHQAIAAxADgANQA0AFIAZQBnAHUAbABhAHIATQBhAHQAaABzACAARgBvAHIAIABNAG8AcgBlACAAUgBvAHUAbgBkACAAYgByAGEAYwBrAGUAdABzACAAdwBpAHQAaAAgAGEAcwBjAGUAbgB0ACAAMQA4ADUANABSAG8AdQBuAGQAIABiAHIAYQBjAGsAZQB0AHMAIAB3AGkAdABoACAAYQBzAGMAZQBuAHQAIAAxADgANQA0AFYAZQByAHMAaQBvAG4AIAAyAC4AMFJvdW5kX2JyYWNrZXRzX3dpdGhfYXNjZW50XzE4NTQATQBhAHQAaABzACAARgBvAHIAIABNAG8AcgBlAAAAAAMAAAAAAAADnwHPAAAAAAAAAAAAAAAAAAAAAAAAAAC5B%2F8AAY2FAA%3D%3D)format('truetype')%3Bfont-weight%3Anormal%3Bfont-style%3Anormal%3B%7D%3C%2Fstyle%3E%3C%2Fdefs%3E%3Ctext%20font-family%3D%22Times%20New%20Roman%22%20font-size%3D%2216%22%20text-anchor%3D%22middle%22%20x%3D%224.5%22%20y%3D%2215%22%3EP%3C%2Ftext%3E%3Ctext%20font-family%3D%22round_brackets18549f92a457f2409%22%20font-size%3D%2216%22%20text-anchor%3D%22middle%22%20x%3D%2212.5%22%20y%3D%2215%22%3E(%3C%2Ftext%3E%3Ctext%20font-family%3D%22Times%20New%20Roman%22%20font-size%3D%2216%22%20font-style%3D%22italic%22%20text-anchor%3D%22middle%22%20x%3D%2220.5%22%20y%3D%2215%22%3EX%3C%2Ftext%3E%3Ctext%20font-family%3D%22math17f39f8317fbdb1988ef4c628eb%22%20font-size%3D%2214%22%20text-anchor%3D%22middle%22%20x%3D%2235.5%22%20y%3D%2215%22%3E%3D%3C%2Ftext%3E%3Ctext%20font-family%3D%22Times%20New%20Roman%22%20font-size%3D%2216%22%20font-style%3D%22italic%22%20text-anchor%3D%22middle%22%20x%3D%2249.5%22%20y%3D%2215%22%3Em%3C%2Ftext%3E%3Ctext%20font-family%3D%22round_brackets18549f92a457f2409%22%20font-size%3D%2216%22%20text-anchor%3D%22middle%22%20x%3D%2258.5%22%20y%3D%2215%22%3E)%3C%2Ftext%3E%3Ctext%20font-family%3D%22math17f39f8317fbdb1988ef4c628eb%22%20font-size%3D%2214%22%20text-anchor%3D%22middle%22%20x%3D%2269.5%22%20y%3D%2215%22%3E%3D%3C%2Ftext%3E%3Ctext%20font-family%3D%22Times%20New%20Roman%22%20font-size%3D%2216%22%20text-anchor%3D%22middle%22%20x%3D%2281.5%22%20y%3D%2215%22%3E0%3C%2Ftext%3E%3C%2Fsvg%3E) this can also be written as
this can also be written as %3C%2Fmo%3E%3Cmo%3E%3D%3C%2Fmo%3E%3Cmi%3EP%3C%2Fmi%3E%3Cmo%3E(%3C%2Fmo%3E%3Cmi%3EX%3C%2Fmi%3E%3Cmo%3E%26%23x2265%3B%3C%2Fmo%3E%3Cmi%3Em%3C%2Fmi%3E%3Cmo%3E)%3C%2Fmo%3E%3Cmo%3E%3D%3C%2Fmo%3E%3Cmn%3E0%3C%2Fmn%3E%3Cmo%3E.%3C%2Fmo%3E%3Cmn%3E5%3C%2Fmn%3E%3C%2Fmstyle%3E%3C%2Fmath%3E--%3E%3Cdefs%3E%3Cstyle%20type%3D%22text%2Fcss%22%3E%40font-face%7Bfont-family%3A'math1ba25f70797e438a8b168df37ca'%3Bsrc%3Aurl(data%3Afont%2Ftruetype%3Bcharset%3Dutf-8%3Bbase64%2CAAEAAAAMAIAAAwBAT1MvMi7iBBMAAADMAAAATmNtYXDEvmKUAAABHAAAAExjdnQgDVUNBwAAAWgAAAA6Z2x5ZoPi2VsAAAGkAAAByGhlYWQQC2qxAAADbAAAADZoaGVhCGsXSAAAA6QAAAAkaG10eE2rRkcAAAPIAAAAFGxvY2EAHTwYAAAD3AAAABhtYXhwBT0FPgAAA%2FQAAAAgbmFtZaBxlY4AAAQUAAABn3Bvc3QB9wD6AAAFtAAAACBwcmVwa1uragAABdQAAAAUAAADSwGQAAUAAAQABAAAAAAABAAEAAAAAAAAAQEAAAAAAAAAAAAAAAAAAAAAAAAAAAAAAAAAAAAAACAgICAAAAAg1UADev96AAAD6ACWAAAAAAACAAEAAQAAABQAAwABAAAAFAAEADgAAAAKAAgAAgACAC4APSJkImX%2F%2FwAAAC4APSJkImX%2F%2F%2F%2FT%2F8Xdn92fAAEAAAAAAAAAAAAAAAABVAMsAIABAABWACoCWAIeAQ4BLAIsAFoBgAKAAKAA1ACAAAAAAAAAACsAVQCAAKsA1QEAASsABwAAAAIAVQAAAwADqwADAAcAADMRIRElIREhVQKr%2FasCAP4AA6v8VVUDAAABACAAAACgAIAAAwAvGAGwBBCwA9SwAxCwAtSwAxCwADywAhCwATwAsAQQsAPUsAMQsAI8sAAQsAE8MDE3MxUjIICAgIAAAgCAAOsC1QIVAAMABwBlGAGwCBCwBtSwBhCwBdSwCBCwAdSwARCwANSwBhCwBzywBRCwBDywARCwAjywABCwAzwAsAgQsAbUsAYQsAfUsAcQsAHUsAEQsALUsAYQsAU8sAcQsAQ8sAEQsAA8sAIQsAM8MTATITUhHQEhNYACVf2rAlUBwFXVVVUAAwCA%2F6sCgAKrAAMABwALAC8YAQCxCQA%2FsQgF5LECBfSxAQT0sQYF9LEDBOSxBQT0sQQF9LEHARA8sQAGEDwwMRMHATUTNQEXATUhFYEBAf8B%2FgABAf%2F%2BAAGrVv8AVgGqVv8AVv5WVVUAAwCA%2F6sCgQKrAAMABwALAC8YAQCxCQA%2FsQgF5LECBfSxAQT0sQYF9LEDBOSxBQT0sQQF9LEHARA8sQAGEDwwMQEVATURNQEVATUhFQKA%2FgACAf3%2FAgABq1b%2FAFYBqlb%2FAFb%2BVlVVAAEAAAABAADVeM5BXw889QADBAD%2F%2F%2F%2F%2F1joTc%2F%2F%2F%2F%2F%2FWOhNzAAD%2FIASAA6sAAAAKAAIAAQAAAAAAAQAAA%2Bj%2FagAAF3AAAP%2B2BIAAAQAAAAAAAAAAAAAAAAAAAAUDUgBVAMgAIANWAIADAACAAwAAgAAAAAAAAAAoAAAAbgAAAPgAAAFhAAAByAABAAAABQBeAAUAAAAAAAIAgAQAAAAAAAQAAN4AAAAAAAAAFQECAAAAAAAAAAEAEgAAAAAAAAAAAAIADgASAAAAAAAAAAMAMAAgAAAAAAAAAAQAEgBQAAAAAAAAAAUAFgBiAAAAAAAAAAYACQB4AAAAAAAAAAgAHACBAAEAAAAAAAEAEgAAAAEAAAAAAAIADgASAAEAAAAAAAMAMAAgAAEAAAAAAAQAEgBQAAEAAAAAAAUAFgBiAAEAAAAAAAYACQB4AAEAAAAAAAgAHACBAAMAAQQJAAEAEgAAAAMAAQQJAAIADgASAAMAAQQJAAMAMAAgAAMAAQQJAAQAEgBQAAMAAQQJAAUAFgBiAAMAAQQJAAYACQB4AAMAAQQJAAgAHACBAE0AYQB0AGgAIABGAG8AbgB0AFIAZQBnAHUAbABhAHIATQBhAHQAaABzACAARgBvAHIAIABNAG8AcgBlACAATQBhAHQAaAAgAEYAbwBuAHQATQBhAHQAaAAgAEYAbwBuAHQAVgBlAHIAcwBpAG8AbgAgADEALgAwTWF0aF9Gb250AE0AYQB0AGgAcwAgAEYAbwByACAATQBvAHIAZQAAAwAAAAAAAAH0APoAAAAAAAAAAAAAAAAAAAAAAAAAALkHEQAAjYUYALIAAAAVFBOxAAE%2F)format('truetype')%3Bfont-weight%3Anormal%3Bfont-style%3Anormal%3B%7D%40font-face%7Bfont-family%3A'round_brackets18549f92a457f2409'%3Bsrc%3Aurl(data%3Afont%2Ftruetype%3Bcharset%3Dutf-8%3Bbase64%2CAAEAAAAMAIAAAwBAT1MvMjwHLFQAAADMAAAATmNtYXDf7xCrAAABHAAAADxjdnQgBAkDLgAAAVgAAAASZ2x5ZmAOz2cAAAFsAAABJGhlYWQOKih8AAACkAAAADZoaGVhCvgVwgAAAsgAAAAkaG10eCA6AAIAAALsAAAADGxvY2EAAARLAAAC%2BAAAABBtYXhwBIgEWQAAAwgAAAAgbmFtZXHR30MAAAMoAAACOXBvc3QDogHPAAAFZAAAACBwcmVwupWEAAAABYQAAAAHAAAGcgGQAAUAAAgACAAAAAAACAAIAAAAAAAAAQIAAAAAAAAAAAAAAAAAAAAAAAAAAAAAAAAAAAAAACAgICAAAAAo8AMGe%2F57AAAHPgGyAAAAAAACAAEAAQAAABQAAwABAAAAFAAEACgAAAAGAAQAAQACACgAKf%2F%2FAAAAKAAp%2F%2F%2F%2F2f%2FZAAEAAAAAAAAAAAFUAFYBAAAsAKgDgAAyAAcAAAACAAAAKgDVA1UAAwAHAAA1MxEjEyMRM9XVq4CAKgMr%2FQAC1QABAAD%2B0AIgBtAACQBNGAGwChCwA9SwAxCwAtSwChCwBdSwBRCwANSwAxCwBzywAhCwCDwAsAoQsAPUsAMQsAfUsAoQsAXUsAoQsADUsAMQsAI8sAcQsAg8MTAREAEzABEQASMAAZCQ%2FnABkJD%2BcALQ%2FZD%2BcAGQAnACcAGQ%2FnAAAQAA%2FtACIAbQAAkATRgBsAoQsAPUsAMQsALUsAoQsAXUsAUQsADUsAMQsAc8sAIQsAg8ALAKELAD1LADELAH1LAKELAF1LAKELAA1LADELACPLAHELAIPDEwARABIwAREAEzAAIg%2FnCQAZD%2BcJABkALQ%2FZD%2BcAGQAnACcAGQ%2FnAAAQAAAAEAAPW2NYFfDzz1AAMIAP%2F%2F%2F%2F%2FVre7u%2F%2F%2F%2F%2F9Wt7u4AAP7QA7cG0AAAAAoAAgABAAAAAAABAAAHPv5OAAAXcAAA%2F%2F4DtwABAAAAAAAAAAAAAAAAAAAAAwDVAAACIAAAAiAAAAAAAAAAAAAkAAAAowAAASQAAQAAAAMACgACAAAAAAACAIAEAAAAAAAEAABNAAAAAAAAABUBAgAAAAAAAAABAD4AAAAAAAAAAAACAA4APgAAAAAAAAADAFwATAAAAAAAAAAEAD4AqAAAAAAAAAAFABYA5gAAAAAAAAAGAB8A%2FAAAAAAAAAAIABwBGwABAAAAAAABAD4AAAABAAAAAAACAA4APgABAAAAAAADAFwATAABAAAAAAAEAD4AqAABAAAAAAAFABYA5gABAAAAAAAGAB8A%2FAABAAAAAAAIABwBGwADAAEECQABAD4AAAADAAEECQACAA4APgADAAEECQADAFwATAADAAEECQAEAD4AqAADAAEECQAFABYA5gADAAEECQAGAB8A%2FAADAAEECQAIABwBGwBSAG8AdQBuAGQAIABiAHIAYQBjAGsAZQB0AHMAIAB3AGkAdABoACAAYQBzAGMAZQBuAHQAIAAxADgANQA0AFIAZQBnAHUAbABhAHIATQBhAHQAaABzACAARgBvAHIAIABNAG8AcgBlACAAUgBvAHUAbgBkACAAYgByAGEAYwBrAGUAdABzACAAdwBpAHQAaAAgAGEAcwBjAGUAbgB0ACAAMQA4ADUANABSAG8AdQBuAGQAIABiAHIAYQBjAGsAZQB0AHMAIAB3AGkAdABoACAAYQBzAGMAZQBuAHQAIAAxADgANQA0AFYAZQByAHMAaQBvAG4AIAAyAC4AMFJvdW5kX2JyYWNrZXRzX3dpdGhfYXNjZW50XzE4NTQATQBhAHQAaABzACAARgBvAHIAIABNAG8AcgBlAAAAAAMAAAAAAAADnwHPAAAAAAAAAAAAAAAAAAAAAAAAAAC5B%2F8AAY2FAA%3D%3D)format('truetype')%3Bfont-weight%3Anormal%3Bfont-style%3Anormal%3B%7D%3C%2Fstyle%3E%3C%2Fdefs%3E%3Ctext%20font-family%3D%22Times%20New%20Roman%22%20font-size%3D%2216%22%20font-style%3D%22italic%22%20text-anchor%3D%22middle%22%20x%3D%224.5%22%20y%3D%2215%22%3EP%3C%2Ftext%3E%3Ctext%20font-family%3D%22round_brackets18549f92a457f2409%22%20font-size%3D%2216%22%20text-anchor%3D%22middle%22%20x%3D%2213.5%22%20y%3D%2215%22%3E(%3C%2Ftext%3E%3Ctext%20font-family%3D%22Times%20New%20Roman%22%20font-size%3D%2216%22%20font-style%3D%22italic%22%20text-anchor%3D%22middle%22%20x%3D%2221.5%22%20y%3D%2215%22%3EX%3C%2Ftext%3E%3Ctext%20font-family%3D%22math1ba25f70797e438a8b168df37ca%22%20font-size%3D%2214%22%20text-anchor%3D%22middle%22%20x%3D%2235.5%22%20y%3D%2215%22%3E%26%23x2264%3B%3C%2Ftext%3E%3Ctext%20font-family%3D%22Times%20New%20Roman%22%20font-size%3D%2216%22%20font-style%3D%22italic%22%20text-anchor%3D%22middle%22%20x%3D%2249.5%22%20y%3D%2215%22%3Em%3C%2Ftext%3E%3Ctext%20font-family%3D%22round_brackets18549f92a457f2409%22%20font-size%3D%2216%22%20text-anchor%3D%22middle%22%20x%3D%2258.5%22%20y%3D%2215%22%3E)%3C%2Ftext%3E%3Ctext%20font-family%3D%22math1ba25f70797e438a8b168df37ca%22%20font-size%3D%2214%22%20text-anchor%3D%22middle%22%20x%3D%2269.5%22%20y%3D%2215%22%3E%3D%3C%2Ftext%3E%3Ctext%20font-family%3D%22Times%20New%20Roman%22%20font-size%3D%2216%22%20font-style%3D%22italic%22%20text-anchor%3D%22middle%22%20x%3D%2281.5%22%20y%3D%2215%22%3EP%3C%2Ftext%3E%3Ctext%20font-family%3D%22round_brackets18549f92a457f2409%22%20font-size%3D%2216%22%20text-anchor%3D%22middle%22%20x%3D%2290.5%22%20y%3D%2215%22%3E(%3C%2Ftext%3E%3Ctext%20font-family%3D%22Times%20New%20Roman%22%20font-size%3D%2216%22%20font-style%3D%22italic%22%20text-anchor%3D%22middle%22%20x%3D%2298.5%22%20y%3D%2215%22%3EX%3C%2Ftext%3E%3Ctext%20font-family%3D%22math1ba25f70797e438a8b168df37ca%22%20font-size%3D%2214%22%20text-anchor%3D%22middle%22%20x%3D%22112.5%22%20y%3D%2215%22%3E%26%23x2265%3B%3C%2Ftext%3E%3Ctext%20font-family%3D%22Times%20New%20Roman%22%20font-size%3D%2216%22%20font-style%3D%22italic%22%20text-anchor%3D%22middle%22%20x%3D%22126.5%22%20y%3D%2215%22%3Em%3C%2Ftext%3E%3Ctext%20font-family%3D%22round_brackets18549f92a457f2409%22%20font-size%3D%2216%22%20text-anchor%3D%22middle%22%20x%3D%22135.5%22%20y%3D%2215%22%3E)%3C%2Ftext%3E%3Ctext%20font-family%3D%22math1ba25f70797e438a8b168df37ca%22%20font-size%3D%2214%22%20text-anchor%3D%22middle%22%20x%3D%22146.5%22%20y%3D%2215%22%3E%3D%3C%2Ftext%3E%3Ctext%20font-family%3D%22Times%20New%20Roman%22%20font-size%3D%2216%22%20text-anchor%3D%22middle%22%20x%3D%22158.5%22%20y%3D%2215%22%3E0%3C%2Ftext%3E%3Ctext%20font-family%3D%22math1ba25f70797e438a8b168df37ca%22%20font-size%3D%2214%22%20text-anchor%3D%22middle%22%20x%3D%22164.5%22%20y%3D%2215%22%3E.%3C%2Ftext%3E%3Ctext%20font-family%3D%22Times%20New%20Roman%22%20font-size%3D%2216%22%20text-anchor%3D%22middle%22%20x%3D%22171.5%22%20y%3D%2215%22%3E5%3C%2Ftext%3E%3C%2Fsvg%3E)
If the p.d.f. is symmetrical (i.e. the graph of y = f(x) is symmetrical) then the median will be halfway between the lower and upper limits of x
In such cases the graph of y=f(x) has axis of symmetry in the line x = m
How do I find the median of a continuous random variable?
By solving one of the equations to find m
![]()
and
%3C%2Fmo%3E%3Cmo%3E%26%23xA0%3B%3C%2Fmo%3E%3Cmi%3Edx%3C%2Fmi%3E%3Cmo%3E%3D%3C%2Fmo%3E%3Cmn%3E0%3C%2Fmn%3E%3Cmo%3E.%3C%2Fmo%3E%3Cmn%3E5%3C%2Fmn%3E%3C%2Fmath%3E--%3E%3Cdefs%3E%3Cstyle%20type%3D%22text%2Fcss%22%3E%40font-face%7Bfont-family%3A'math1734d4f53c2eef4805c06a74398'%3Bsrc%3Aurl(data%3Afont%2Ftruetype%3Bcharset%3Dutf-8%3Bbase64%2CAAEAAAAMAIAAAwBAT1MvMi7iBBMAAADMAAAATmNtYXDEvmKUAAABHAAAAExjdnQgDVUNBwAAAWgAAAA6Z2x5ZoPi2VsAAAGkAAACHmhlYWQQC2qxAAADxAAAADZoaGVhCGsXSAAAA%2FwAAAAkaG10eE2rRkcAAAQgAAAAFGxvY2EAHTwYAAAENAAAABhtYXhwBT0FPgAABEwAAAAgbmFtZaBxlY4AAARsAAABn3Bvc3QB9wD6AAAGDAAAACBwcmVwa1uragAABiwAAAAUAAADSwGQAAUAAAQABAAAAAAABAAEAAAAAAAAAQEAAAAAAAAAAAAAAAAAAAAAAAAAAAAAAAAAAAAAACAgICAAAAAg1UADev96AAAD6ACWAAAAAAACAAEAAQAAABQAAwABAAAAFAAEADgAAAAKAAgAAgACAC4APSIeIiv%2F%2FwAAAC4APSIeIiv%2F%2F%2F%2FT%2F8Xd5d3ZAAEAAAAAAAAAAAAAAAABVAMsAIABAABWACoCWAIeAQ4BLAIsAFoBgAKAAKAA1ACAAAAAAAAAACsAVQCAAKsA1QEAASsABwAAAAIAVQAAAwADqwADAAcAADMRIRElIREhVQKr%2FasCAP4AA6v8VVUDAAABACAAAACgAIAAAwAvGAGwBBCwA9SwAxCwAtSwAxCwADywAhCwATwAsAQQsAPUsAMQsAI8sAAQsAE8MDE3MxUjIICAgIAAAgCAAOsC1QIVAAMABwBlGAGwCBCwBtSwBhCwBdSwCBCwAdSwARCwANSwBhCwBzywBRCwBDywARCwAjywABCwAzwAsAgQsAbUsAYQsAfUsAcQsAHUsAEQsALUsAYQsAU8sAcQsAQ8sAEQsAA8sAIQsAM8MTATITUhHQEhNYACVf2rAlUBwFXVVVUAAwAAAIQD0AI8ACMAMwBDAAABNjc2MzIXFhUUBwYjIicmJyYnBgcGIyInJjU0NzYzMhcWFxYXFhcWMzI3NjU0JyYjIgcGByYnJiMiBwYVFBcWMzI3NgH3R2MsLmQ%2FMkU9WXxaEQ0GIUdkLC5kPzJFPVl8WhANB0lWKDc7TDEjPS47dF0Od1YoNztMMSM9Ljt0XQ0BrF4iEE89UF9DOkkMEAYlXSMQTz1QX0M6SA4OBlZkICs4KDRPNSdwDkplHyw4KDVPNChwDgABAEv%2FawILA0AAGQAAASYOAQMCDgEjJjQ2BiMWPgETEj4BMxYOATYB9TU1ICAgQDZAKlULNTU2ICAgQDVAKwFVCwMVFiuL%2FuD%2BwIogFUAVQBUrigEgAUCLIBVAFT8AAAABAAAAAQAA1XjOQV8PPPUAAwQA%2F%2F%2F%2F%2F9Y6E3P%2F%2F%2F%2F%2F1joTcwAA%2FyAEgAOrAAAACgACAAEAAAAAAAEAAAPo%2F2oAABdwAAD%2FtgSAAAEAAAAAAAAAAAAAAAAAAAAFA1IAVQDIACADVgCAA8AAAAH0AEsAAAAAAAAAKAAAAG4AAAD4AAABwAAAAh4AAQAAAAUAXgAFAAAAAAACAIAEAAAAAAAEAADeAAAAAAAAABUBAgAAAAAAAAABABIAAAAAAAAAAAACAA4AEgAAAAAAAAADADAAIAAAAAAAAAAEABIAUAAAAAAAAAAFABYAYgAAAAAAAAAGAAkAeAAAAAAAAAAIABwAgQABAAAAAAABABIAAAABAAAAAAACAA4AEgABAAAAAAADADAAIAABAAAAAAAEABIAUAABAAAAAAAFABYAYgABAAAAAAAGAAkAeAABAAAAAAAIABwAgQADAAEECQABABIAAAADAAEECQACAA4AEgADAAEECQADADAAIAADAAEECQAEABIAUAADAAEECQAFABYAYgADAAEECQAGAAkAeAADAAEECQAIABwAgQBNAGEAdABoACAARgBvAG4AdABSAGUAZwB1AGwAYQByAE0AYQB0AGgAcwAgAEYAbwByACAATQBvAHIAZQAgAE0AYQB0AGgAIABGAG8AbgB0AE0AYQB0AGgAIABGAG8AbgB0AFYAZQByAHMAaQBvAG4AIAAxAC4AME1hdGhfRm9udABNAGEAdABoAHMAIABGAG8AcgAgAE0AbwByAGUAAAMAAAAAAAAB9AD6AAAAAAAAAAAAAAAAAAAAAAAAAAC5BxEAAI2FGACyAAAAFRQTsQABPw%3D%3D)format('truetype')%3Bfont-weight%3Anormal%3Bfont-style%3Anormal%3B%7D%40font-face%7Bfont-family%3A'round_brackets18549f92a457f2409'%3Bsrc%3Aurl(data%3Afont%2Ftruetype%3Bcharset%3Dutf-8%3Bbase64%2CAAEAAAAMAIAAAwBAT1MvMjwHLFQAAADMAAAATmNtYXDf7xCrAAABHAAAADxjdnQgBAkDLgAAAVgAAAASZ2x5ZmAOz2cAAAFsAAABJGhlYWQOKih8AAACkAAAADZoaGVhCvgVwgAAAsgAAAAkaG10eCA6AAIAAALsAAAADGxvY2EAAARLAAAC%2BAAAABBtYXhwBIgEWQAAAwgAAAAgbmFtZXHR30MAAAMoAAACOXBvc3QDogHPAAAFZAAAACBwcmVwupWEAAAABYQAAAAHAAAGcgGQAAUAAAgACAAAAAAACAAIAAAAAAAAAQIAAAAAAAAAAAAAAAAAAAAAAAAAAAAAAAAAAAAAACAgICAAAAAo8AMGe%2F57AAAHPgGyAAAAAAACAAEAAQAAABQAAwABAAAAFAAEACgAAAAGAAQAAQACACgAKf%2F%2FAAAAKAAp%2F%2F%2F%2F2f%2FZAAEAAAAAAAAAAAFUAFYBAAAsAKgDgAAyAAcAAAACAAAAKgDVA1UAAwAHAAA1MxEjEyMRM9XVq4CAKgMr%2FQAC1QABAAD%2B0AIgBtAACQBNGAGwChCwA9SwAxCwAtSwChCwBdSwBRCwANSwAxCwBzywAhCwCDwAsAoQsAPUsAMQsAfUsAoQsAXUsAoQsADUsAMQsAI8sAcQsAg8MTAREAEzABEQASMAAZCQ%2FnABkJD%2BcALQ%2FZD%2BcAGQAnACcAGQ%2FnAAAQAA%2FtACIAbQAAkATRgBsAoQsAPUsAMQsALUsAoQsAXUsAUQsADUsAMQsAc8sAIQsAg8ALAKELAD1LADELAH1LAKELAF1LAKELAA1LADELACPLAHELAIPDEwARABIwAREAEzAAIg%2FnCQAZD%2BcJABkALQ%2FZD%2BcAGQAnACcAGQ%2FnAAAQAAAAEAAPW2NYFfDzz1AAMIAP%2F%2F%2F%2F%2FVre7u%2F%2F%2F%2F%2F9Wt7u4AAP7QA7cG0AAAAAoAAgABAAAAAAABAAAHPv5OAAAXcAAA%2F%2F4DtwABAAAAAAAAAAAAAAAAAAAAAwDVAAACIAAAAiAAAAAAAAAAAAAkAAAAowAAASQAAQAAAAMACgACAAAAAAACAIAEAAAAAAAEAABNAAAAAAAAABUBAgAAAAAAAAABAD4AAAAAAAAAAAACAA4APgAAAAAAAAADAFwATAAAAAAAAAAEAD4AqAAAAAAAAAAFABYA5gAAAAAAAAAGAB8A%2FAAAAAAAAAAIABwBGwABAAAAAAABAD4AAAABAAAAAAACAA4APgABAAAAAAADAFwATAABAAAAAAAEAD4AqAABAAAAAAAFABYA5gABAAAAAAAGAB8A%2FAABAAAAAAAIABwBGwADAAEECQABAD4AAAADAAEECQACAA4APgADAAEECQADAFwATAADAAEECQAEAD4AqAADAAEECQAFABYA5gADAAEECQAGAB8A%2FAADAAEECQAIABwBGwBSAG8AdQBuAGQAIABiAHIAYQBjAGsAZQB0AHMAIAB3AGkAdABoACAAYQBzAGMAZQBuAHQAIAAxADgANQA0AFIAZQBnAHUAbABhAHIATQBhAHQAaABzACAARgBvAHIAIABNAG8AcgBlACAAUgBvAHUAbgBkACAAYgByAGEAYwBrAGUAdABzACAAdwBpAHQAaAAgAGEAcwBjAGUAbgB0ACAAMQA4ADUANABSAG8AdQBuAGQAIABiAHIAYQBjAGsAZQB0AHMAIAB3AGkAdABoACAAYQBzAGMAZQBuAHQAIAAxADgANQA0AFYAZQByAHMAaQBvAG4AIAAyAC4AMFJvdW5kX2JyYWNrZXRzX3dpdGhfYXNjZW50XzE4NTQATQBhAHQAaABzACAARgBvAHIAIABNAG8AcgBlAAAAAAMAAAAAAAADnwHPAAAAAAAAAAAAAAAAAAAAAAAAAAC5B%2F8AAY2FAA%3D%3D)format('truetype')%3Bfont-weight%3Anormal%3Bfont-style%3Anormal%3B%7D%3C%2Fstyle%3E%3C%2Fdefs%3E%3Ctext%20font-family%3D%22math1734d4f53c2eef4805c06a74398%22%20font-size%3D%2232%22%20text-anchor%3D%22middle%22%20x%3D%228.5%22%20y%3D%2232%22%3E%26%23x222B%3B%3C%2Ftext%3E%3Ctext%20font-family%3D%22Times%20New%20Roman%22%20font-size%3D%2213%22%20font-style%3D%22italic%22%20text-anchor%3D%22middle%22%20x%3D%2215.5%22%20y%3D%2246%22%3Em%3C%2Ftext%3E%3Ctext%20font-family%3D%22math1734d4f53c2eef4805c06a74398%22%20font-size%3D%2212%22%20text-anchor%3D%22middle%22%20x%3D%2224.5%22%20y%3D%2212%22%3E%26%23x221E%3B%3C%2Ftext%3E%3Ctext%20font-family%3D%22Times%20New%20Roman%22%20font-size%3D%2218%22%20text-anchor%3D%22middle%22%20x%3D%2234.5%22%20y%3D%2228%22%3Ef%3C%2Ftext%3E%3Ctext%20font-family%3D%22round_brackets18549f92a457f2409%22%20font-size%3D%2218%22%20text-anchor%3D%22middle%22%20x%3D%2242.5%22%20y%3D%2228%22%3E(%3C%2Ftext%3E%3Ctext%20font-family%3D%22Times%20New%20Roman%22%20font-size%3D%2218%22%20text-anchor%3D%22middle%22%20x%3D%2249.5%22%20y%3D%2228%22%3Ex%3C%2Ftext%3E%3Ctext%20font-family%3D%22round_brackets18549f92a457f2409%22%20font-size%3D%2218%22%20text-anchor%3D%22middle%22%20x%3D%2256.5%22%20y%3D%2228%22%3E)%3C%2Ftext%3E%3Ctext%20font-family%3D%22Times%20New%20Roman%22%20font-size%3D%2218%22%20text-anchor%3D%22middle%22%20x%3D%2273.5%22%20y%3D%2228%22%3Edx%3C%2Ftext%3E%3Ctext%20font-family%3D%22math1734d4f53c2eef4805c06a74398%22%20font-size%3D%2216%22%20text-anchor%3D%22middle%22%20x%3D%2290.5%22%20y%3D%2228%22%3E%3D%3C%2Ftext%3E%3Ctext%20font-family%3D%22Times%20New%20Roman%22%20font-size%3D%2218%22%20text-anchor%3D%22middle%22%20x%3D%22103.5%22%20y%3D%2228%22%3E0%3C%2Ftext%3E%3Ctext%20font-family%3D%22math1734d4f53c2eef4805c06a74398%22%20font-size%3D%2216%22%20text-anchor%3D%22middle%22%20x%3D%22110.5%22%20y%3D%2228%22%3E.%3C%2Ftext%3E%3Ctext%20font-family%3D%22Times%20New%20Roman%22%20font-size%3D%2218%22%20text-anchor%3D%22middle%22%20x%3D%22117.5%22%20y%3D%2228%22%3E5%3C%2Ftext%3E%3C%2Fsvg%3E)
The equation that should be used will depend on the information in the question
If the graph of
%3C%2Fmo%3E%3C%2Fmstyle%3E%3C%2Fmath%3E--%3E%3Cdefs%3E%3Cstyle%20type%3D%22text%2Fcss%22%3E%40font-face%7Bfont-family%3A'math17f39f8317fbdb1988ef4c628eb'%3Bsrc%3Aurl(data%3Afont%2Ftruetype%3Bcharset%3Dutf-8%3Bbase64%2CAAEAAAAMAIAAAwBAT1MvMi7iBBMAAADMAAAATmNtYXDEvmKUAAABHAAAADRjdnQgDVUNBwAAAVAAAAA6Z2x5ZoPi2VsAAAGMAAAAsmhlYWQQC2qxAAACQAAAADZoaGVhCGsXSAAAAngAAAAkaG10eE2rRkcAAAKcAAAACGxvY2EAHTwYAAACpAAAAAxtYXhwBT0FPgAAArAAAAAgbmFtZaBxlY4AAALQAAABn3Bvc3QB9wD6AAAEcAAAACBwcmVwa1uragAABJAAAAAUAAADSwGQAAUAAAQABAAAAAAABAAEAAAAAAAAAQEAAAAAAAAAAAAAAAAAAAAAAAAAAAAAAAAAAAAAACAgICAAAAAg1UADev96AAAD6ACWAAAAAAACAAEAAQAAABQAAwABAAAAFAAEACAAAAAEAAQAAQAAAD3%2F%2FwAAAD3%2F%2F%2F%2FEAAEAAAAAAAABVAMsAIABAABWACoCWAIeAQ4BLAIsAFoBgAKAAKAA1ACAAAAAAAAAACsAVQCAAKsA1QEAASsABwAAAAIAVQAAAwADqwADAAcAADMRIRElIREhVQKr%2FasCAP4AA6v8VVUDAAACAIAA6wLVAhUAAwAHAGUYAbAIELAG1LAGELAF1LAIELAB1LABELAA1LAGELAHPLAFELAEPLABELACPLAAELADPACwCBCwBtSwBhCwB9SwBxCwAdSwARCwAtSwBhCwBTywBxCwBDywARCwADywAhCwAzwxMBMhNSEdASE1gAJV%2FasCVQHAVdVVVQAAAAEAAAABAADVeM5BXw889QADBAD%2F%2F%2F%2F%2F1joTc%2F%2F%2F%2F%2F%2FWOhNzAAD%2FIASAA6sAAAAKAAIAAQAAAAAAAQAAA%2Bj%2FagAAF3AAAP%2B2BIAAAQAAAAAAAAAAAAAAAAAAAAIDUgBVA1YAgAAAAAAAAAAoAAAAsgABAAAAAgBeAAUAAAAAAAIAgAQAAAAAAAQAAN4AAAAAAAAAFQECAAAAAAAAAAEAEgAAAAAAAAAAAAIADgASAAAAAAAAAAMAMAAgAAAAAAAAAAQAEgBQAAAAAAAAAAUAFgBiAAAAAAAAAAYACQB4AAAAAAAAAAgAHACBAAEAAAAAAAEAEgAAAAEAAAAAAAIADgASAAEAAAAAAAMAMAAgAAEAAAAAAAQAEgBQAAEAAAAAAAUAFgBiAAEAAAAAAAYACQB4AAEAAAAAAAgAHACBAAMAAQQJAAEAEgAAAAMAAQQJAAIADgASAAMAAQQJAAMAMAAgAAMAAQQJAAQAEgBQAAMAAQQJAAUAFgBiAAMAAQQJAAYACQB4AAMAAQQJAAgAHACBAE0AYQB0AGgAIABGAG8AbgB0AFIAZQBnAHUAbABhAHIATQBhAHQAaABzACAARgBvAHIAIABNAG8AcgBlACAATQBhAHQAaAAgAEYAbwBuAHQATQBhAHQAaAAgAEYAbwBuAHQAVgBlAHIAcwBpAG8AbgAgADEALgAwTWF0aF9Gb250AE0AYQB0AGgAcwAgAEYAbwByACAATQBvAHIAZQAAAwAAAAAAAAH0APoAAAAAAAAAAAAAAAAAAAAAAAAAALkHEQAAjYUYALIAAAAVFBOxAAE%2F)format('truetype')%3Bfont-weight%3Anormal%3Bfont-style%3Anormal%3B%7D%40font-face%7Bfont-family%3A'round_brackets18549f92a457f2409'%3Bsrc%3Aurl(data%3Afont%2Ftruetype%3Bcharset%3Dutf-8%3Bbase64%2CAAEAAAAMAIAAAwBAT1MvMjwHLFQAAADMAAAATmNtYXDf7xCrAAABHAAAADxjdnQgBAkDLgAAAVgAAAASZ2x5ZmAOz2cAAAFsAAABJGhlYWQOKih8AAACkAAAADZoaGVhCvgVwgAAAsgAAAAkaG10eCA6AAIAAALsAAAADGxvY2EAAARLAAAC%2BAAAABBtYXhwBIgEWQAAAwgAAAAgbmFtZXHR30MAAAMoAAACOXBvc3QDogHPAAAFZAAAACBwcmVwupWEAAAABYQAAAAHAAAGcgGQAAUAAAgACAAAAAAACAAIAAAAAAAAAQIAAAAAAAAAAAAAAAAAAAAAAAAAAAAAAAAAAAAAACAgICAAAAAo8AMGe%2F57AAAHPgGyAAAAAAACAAEAAQAAABQAAwABAAAAFAAEACgAAAAGAAQAAQACACgAKf%2F%2FAAAAKAAp%2F%2F%2F%2F2f%2FZAAEAAAAAAAAAAAFUAFYBAAAsAKgDgAAyAAcAAAACAAAAKgDVA1UAAwAHAAA1MxEjEyMRM9XVq4CAKgMr%2FQAC1QABAAD%2B0AIgBtAACQBNGAGwChCwA9SwAxCwAtSwChCwBdSwBRCwANSwAxCwBzywAhCwCDwAsAoQsAPUsAMQsAfUsAoQsAXUsAoQsADUsAMQsAI8sAcQsAg8MTAREAEzABEQASMAAZCQ%2FnABkJD%2BcALQ%2FZD%2BcAGQAnACcAGQ%2FnAAAQAA%2FtACIAbQAAkATRgBsAoQsAPUsAMQsALUsAoQsAXUsAUQsADUsAMQsAc8sAIQsAg8ALAKELAD1LADELAH1LAKELAF1LAKELAA1LADELACPLAHELAIPDEwARABIwAREAEzAAIg%2FnCQAZD%2BcJABkALQ%2FZD%2BcAGQAnACcAGQ%2FnAAAQAAAAEAAPW2NYFfDzz1AAMIAP%2F%2F%2F%2F%2FVre7u%2F%2F%2F%2F%2F9Wt7u4AAP7QA7cG0AAAAAoAAgABAAAAAAABAAAHPv5OAAAXcAAA%2F%2F4DtwABAAAAAAAAAAAAAAAAAAAAAwDVAAACIAAAAiAAAAAAAAAAAAAkAAAAowAAASQAAQAAAAMACgACAAAAAAACAIAEAAAAAAAEAABNAAAAAAAAABUBAgAAAAAAAAABAD4AAAAAAAAAAAACAA4APgAAAAAAAAADAFwATAAAAAAAAAAEAD4AqAAAAAAAAAAFABYA5gAAAAAAAAAGAB8A%2FAAAAAAAAAAIABwBGwABAAAAAAABAD4AAAABAAAAAAACAA4APgABAAAAAAADAFwATAABAAAAAAAEAD4AqAABAAAAAAAFABYA5gABAAAAAAAGAB8A%2FAABAAAAAAAIABwBGwADAAEECQABAD4AAAADAAEECQACAA4APgADAAEECQADAFwATAADAAEECQAEAD4AqAADAAEECQAFABYA5gADAAEECQAGAB8A%2FAADAAEECQAIABwBGwBSAG8AdQBuAGQAIABiAHIAYQBjAGsAZQB0AHMAIAB3AGkAdABoACAAYQBzAGMAZQBuAHQAIAAxADgANQA0AFIAZQBnAHUAbABhAHIATQBhAHQAaABzACAARgBvAHIAIABNAG8AcgBlACAAUgBvAHUAbgBkACAAYgByAGEAYwBrAGUAdABzACAAdwBpAHQAaAAgAGEAcwBjAGUAbgB0ACAAMQA4ADUANABSAG8AdQBuAGQAIABiAHIAYQBjAGsAZQB0AHMAIAB3AGkAdABoACAAYQBzAGMAZQBuAHQAIAAxADgANQA0AFYAZQByAHMAaQBvAG4AIAAyAC4AMFJvdW5kX2JyYWNrZXRzX3dpdGhfYXNjZW50XzE4NTQATQBhAHQAaABzACAARgBvAHIAIABNAG8AcgBlAAAAAAMAAAAAAAADnwHPAAAAAAAAAAAAAAAAAAAAAAAAAAC5B%2F8AAY2FAA%3D%3D)format('truetype')%3Bfont-weight%3Anormal%3Bfont-style%3Anormal%3B%7D%3C%2Fstyle%3E%3C%2Fdefs%3E%3Ctext%20font-family%3D%22Times%20New%20Roman%22%20font-size%3D%2216%22%20font-style%3D%22italic%22%20text-anchor%3D%22middle%22%20x%3D%224.5%22%20y%3D%2215%22%3Ey%3C%2Ftext%3E%3Ctext%20font-family%3D%22math17f39f8317fbdb1988ef4c628eb%22%20font-size%3D%2214%22%20text-anchor%3D%22middle%22%20x%3D%2217.5%22%20y%3D%2215%22%3E%3D%3C%2Ftext%3E%3Ctext%20font-family%3D%22Times%20New%20Roman%22%20font-size%3D%2216%22%20text-anchor%3D%22middle%22%20x%3D%2227.5%22%20y%3D%2215%22%3Ef%3C%2Ftext%3E%3Ctext%20font-family%3D%22round_brackets18549f92a457f2409%22%20font-size%3D%2216%22%20text-anchor%3D%22middle%22%20x%3D%2235.5%22%20y%3D%2215%22%3E(%3C%2Ftext%3E%3Ctext%20font-family%3D%22Times%20New%20Roman%22%20font-size%3D%2216%22%20font-style%3D%22italic%22%20text-anchor%3D%22middle%22%20x%3D%2241.5%22%20y%3D%2215%22%3Ex%3C%2Ftext%3E%3Ctext%20font-family%3D%22round_brackets18549f92a457f2409%22%20font-size%3D%2216%22%20text-anchor%3D%22middle%22%20x%3D%2248.5%22%20y%3D%2215%22%3E)%3C%2Ftext%3E%3C%2Fsvg%3E) is symmetrical, symmetry may be used to deduce the median
is symmetrical, symmetry may be used to deduce the median
How do I find quartiles (or percentiles) of a continuous random variable?
In a similar way, to find the median
The lower quartile will be the value L such that P(X ≤ L) = 0.25 or
P(X ≥ L) = 0.75The upper quartile will be the value U such that P(X ≤ U) = 0.75 or
P(X ≥ U) = 0.25
Percentiles can be found in the same way
The 15th percentile will be the value k such that P(X ≤ k) = 0.15 or
P(X ≥ k) = 0.85
What is meant by the mode of a continuous random variable?
The mode of a continuous random variable, X , with probability density function f(x) is the value of x that produces the greatest value of f(x) .
How do I find the mode of a PDF?
This will depend on the type of function f(x); the easiest way to find the mode is by considering the shape of the graph of f(x)
If the graph is a curve with a (local) maximum point, the mode can be found by differentiating and solving the equation f'(x) = 0
If there is more than one solution to f'(x) = 0 , further work may be needed to deduce which answer is the mode
Look for valid values of from the definition of the p.d.f.
Use the second derivative (f'' (x) ) to deduce the nature of each stationary point
You may need to check the values of f(x) at the endpoints too
Worked Example
The continuous random variable ![]() has probability density function
has probability density function ![]() defined as
defined as
![]()
(a) Find the median of X, giving your answer to three significant figures
(b) Find the exact value of the mode of X
(a) Find the median of X, giving your answer to three significant figures
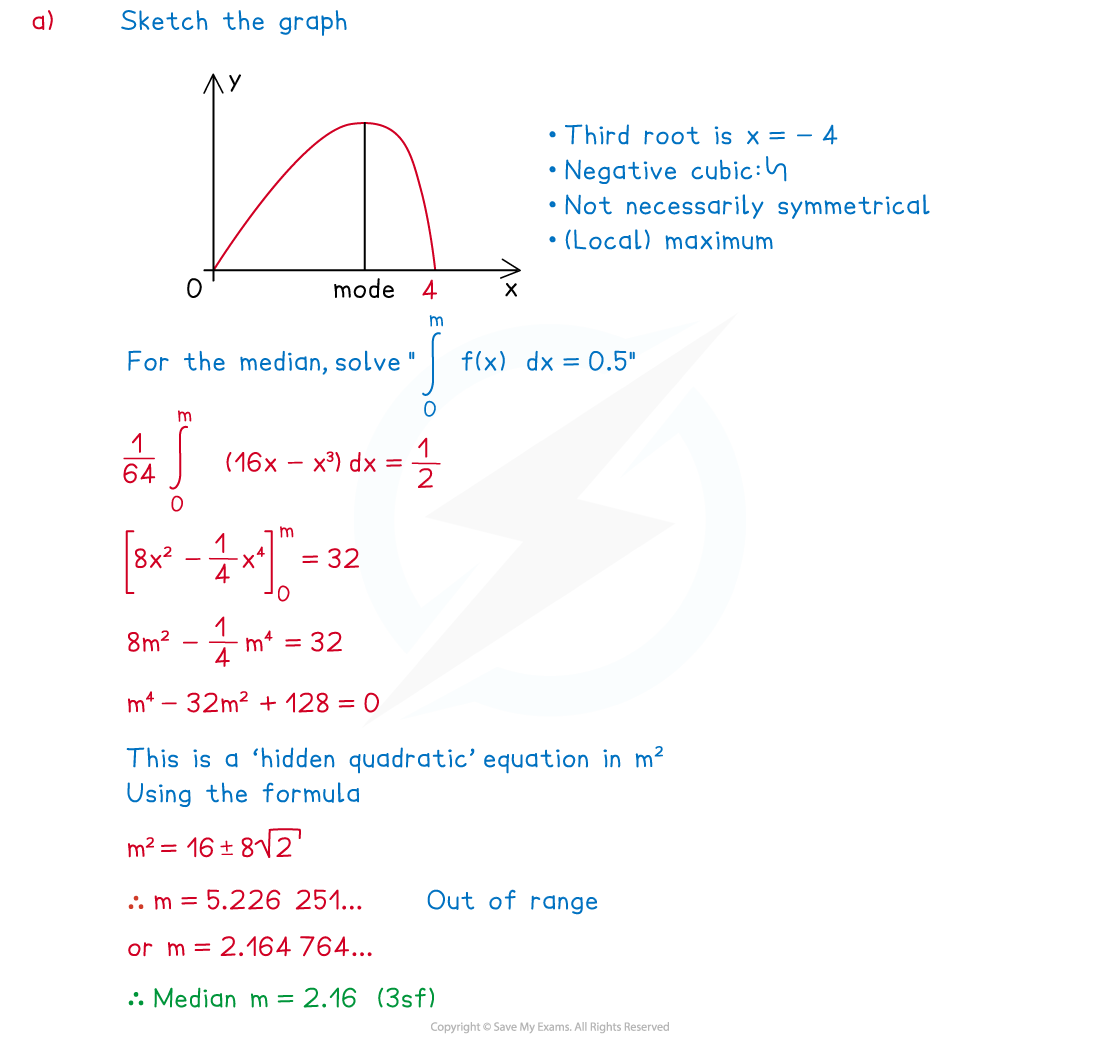
(b) Find the exact value of the mode of X
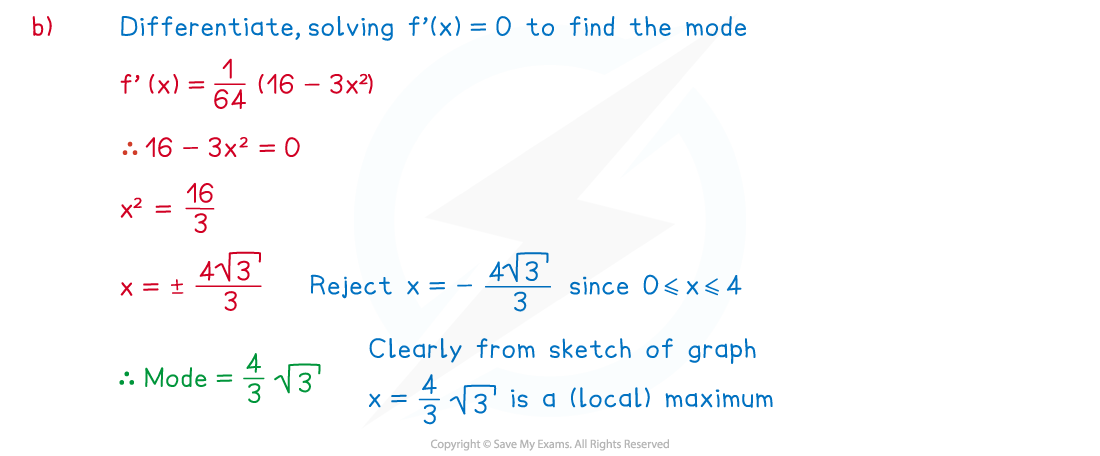
Examiner Tips and Tricks
Avoid spending too long sketching the graph of y = f(x), only do this if the graph is straightforward as finding the median and mode by other means can be just as quick

You've read 0 of your 5 free revision notes this week
Unlock more, it's free!
Did this page help you?