Skewness (AQA A Level Maths) : Revision Note

Did this video help you?
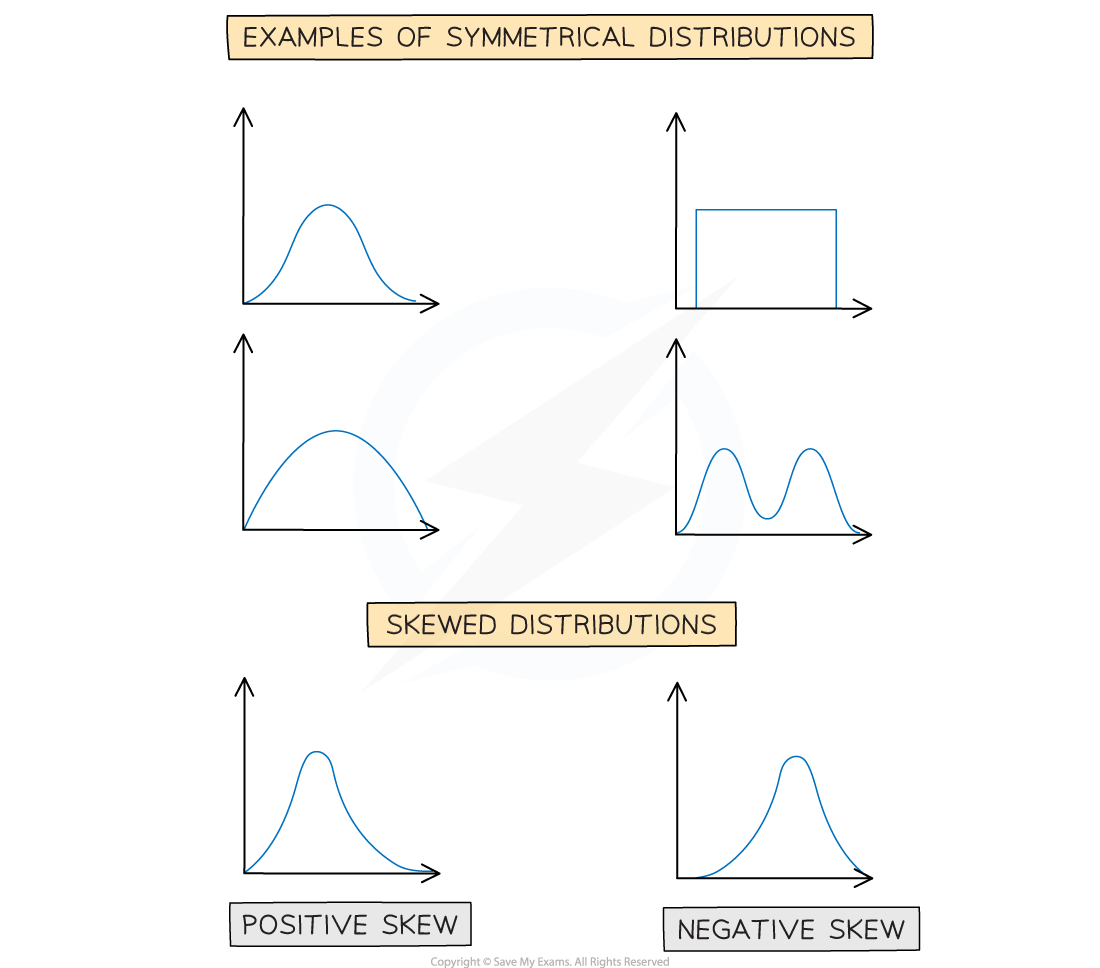
Skewness
The distribution of a data set is either symmetrical or it has skewness.
What is skewness?
Skewness describes the way in which data in a non – symmetrical distribution is leaning
A distribution that has its tail on the right side has positive skew
A distribution that has its tail on the left side has negative skew
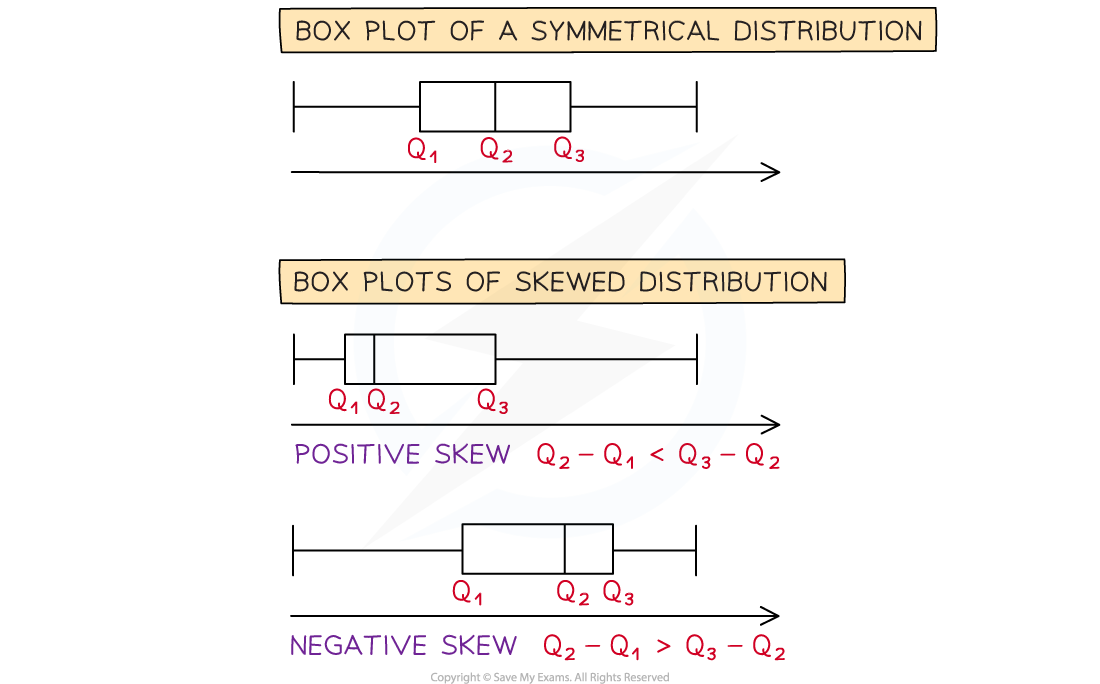
If the distribution is shown on a box plot looking at the difference between the quartiles can help decide how it is skewed
If the median is closer to the lower quartile then the distribution has positive skew
Q3 - Q2 > Q2- Q1
If the median is closer to the upper quartile then the distribution has negative skew
Q3 - Q2 < Q2 - Q1
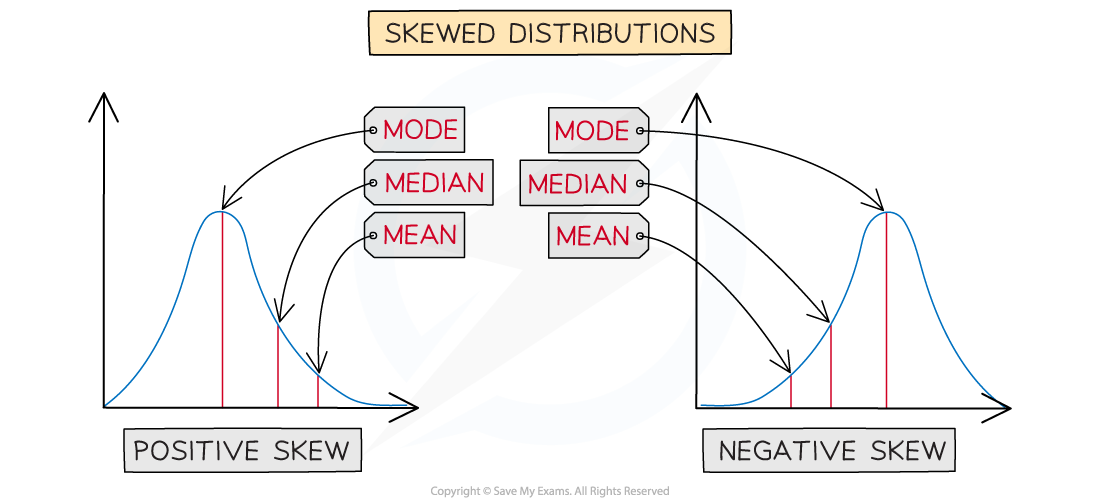
Looking at the values of the statistics can help you decide whether distribution is positively skewed or negatively skewed
In a positively skewed distribution
Mode < median < mean
In a negatively skewed distribution
Mean < median < mode
Examiner Tips and Tricks
You only need to be able to recognise the different types of skewness
It can help to comment on skewness when asked to compare distributions

You've read 0 of your 5 free revision notes this week
Unlock more, it's free!
Did this page help you?