1
4 marks
Explain one reason why life expectancy varies within a country.
Was this exam question helpful?
Exam code: 9GE0
Explain one reason why life expectancy varies within a country.
Was this exam question helpful?
Study Figure 5 below.

Figure 5
Children enrolled in school in Madagascar, 2014
Draw a divided bar chart, using the key and the data in Figure 5.

Was this exam question helpful?
Explain one reason why attitudes to gender equality in education vary greatly between countries.
Was this exam question helpful?
Study Figure A below.
Country | Malawi | Nigeria | India | Egypt | Iran | Czech Republic | France | United States | Norway |
|---|---|---|---|---|---|---|---|---|---|
Human Development Index | 0.43 | 0.50 | 0.58 | 0.68 | 0.75 | 0.85 | 0.88 | 0.91 | 0.94 |
Gini Coefficient | 0.43 | 0.48 | 0.34 | 0.30 | 0.38 | 0.26 | 0.32 | 0.40 | 0.25 |
Figure A: Table showing the Human Development Index and the Gini Coefficient scores for selected countries
Using the data from Figure A, complete Figure B by:
i) plotting the data for Egypt, Iran and the Czech Republic
ii) drawing a regression (best-fit) line to show the relationship.

Figure B: Graph showing the Human Development Index and the Gini Coefficient scores for selected countries
Was this exam question helpful?
The total number of children aged 6–17 in Madagascar was 8.9 million. The number of children who were enrolled in school was 5.8 million.
Calculate the percentage of children who were enrolled in school. Give your answer to one decimal place. You must show your working.
Was this exam question helpful?
Study Figure 3, which shows the results of a Spearman's rank correlation test of the relationship between health expenditure per capita and life expectancy, for 12 selected countries.

Using the data in Figure 3, calculate the value of d² for the United States.
Was this exam question helpful?
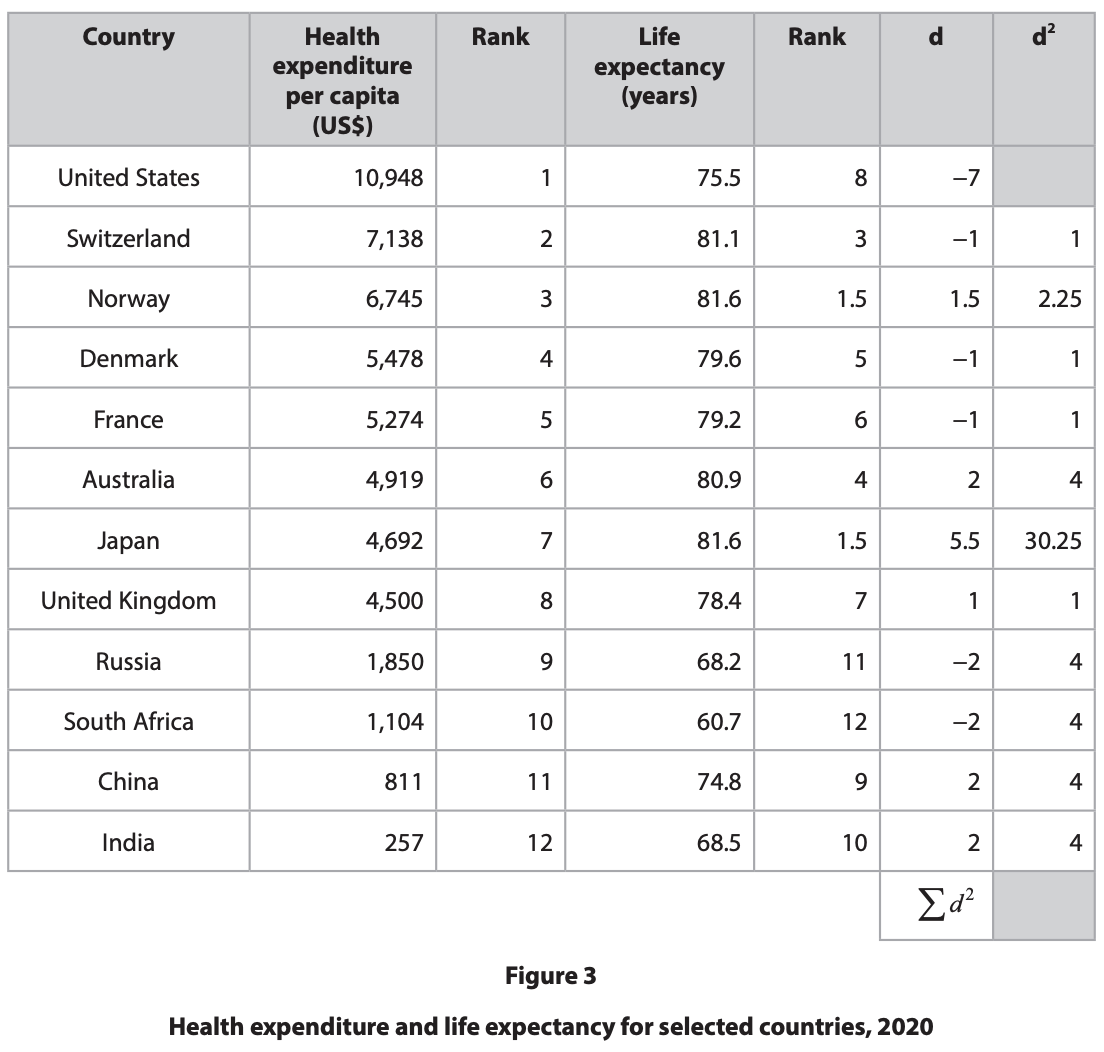
Using the data in Figure 3, calculate Σd² (the sum of the d² values).
Was this exam question helpful?
The formula for Spearman's rank correlation coefficient is rs = 1 − (6Σd²) ÷ (n³ − n), where n = 12.

Using the data in Figure 3, calculate the value of rs. Give your answer to two decimal places. You must show your working.
Was this exam question helpful?
Study Figure 3 below.
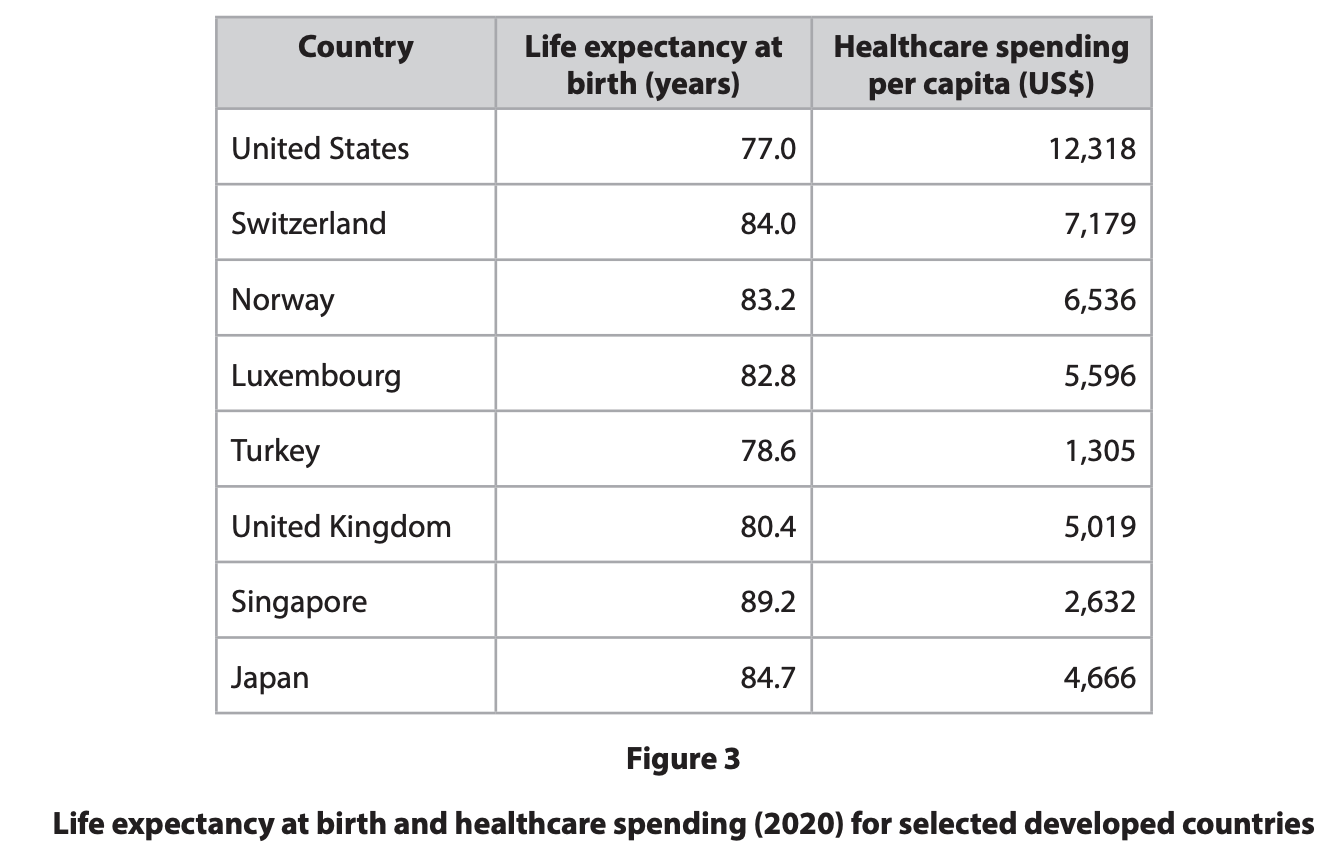
Calculate the mean life expectancy at birth for the countries shown in Figure 3. Give your answer to one decimal place. You must show your working.
Was this exam question helpful?
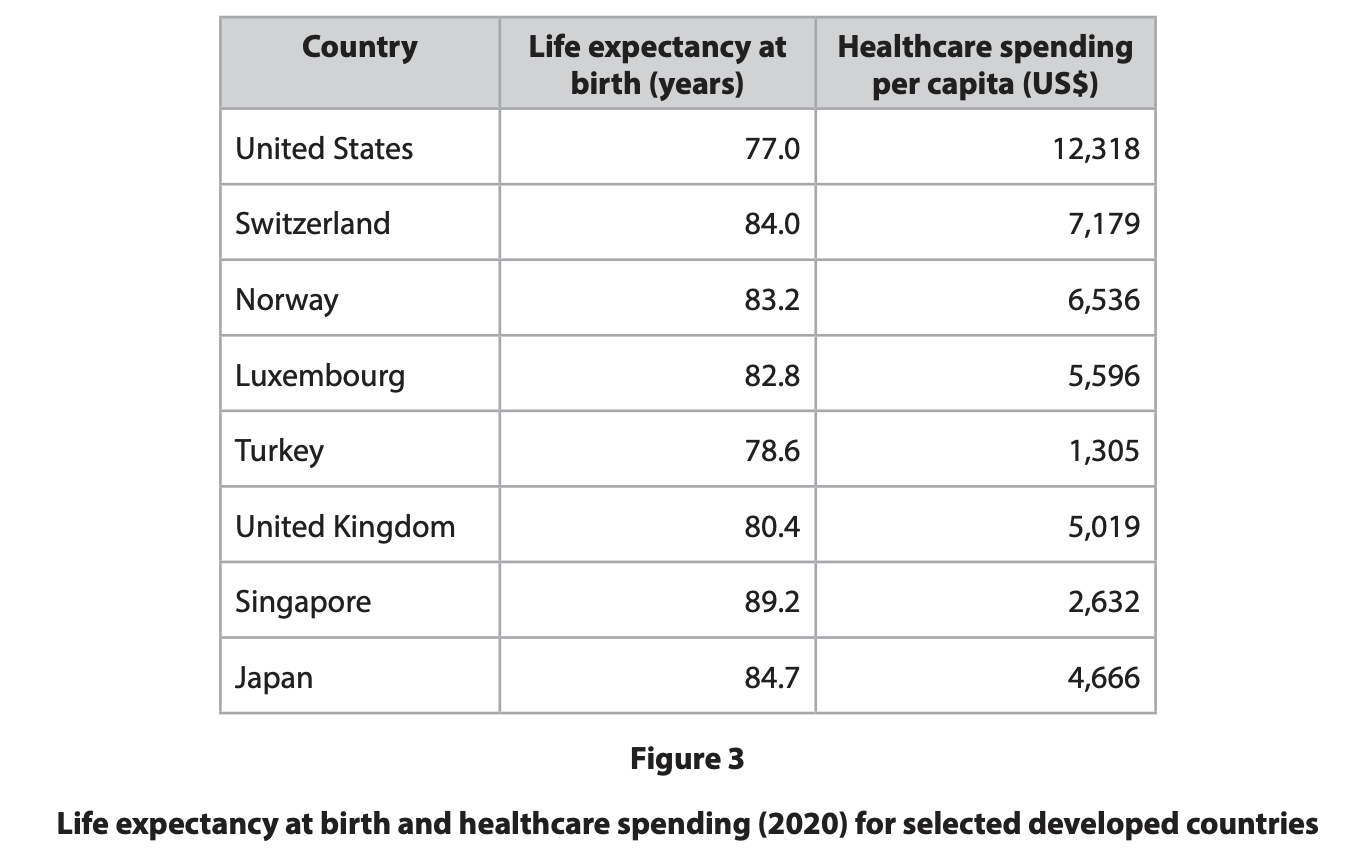
Calculate the range in healthcare spending for the countries shown. You must show your working.
Was this exam question helpful?
Study Figure 5

Figure 5
Mean life expectancy at birth for selected world regions from 1960 to 2015
Explain why some regions have experienced more rapid rates of increase in life expectancy than others.
Was this exam question helpful?
Study Figure 4 in the Resource Booklet.

Figure 4
Percentage (%) of population living below the national poverty line for selected countries, 2019
Suggest why some developing and emerging countries have had more success in reducing poverty than others.
Was this exam question helpful?
Explain why some International Governmental Organisations (IGOs) have promoted neo-liberal market and trade policies for economic development.
Was this exam question helpful?
Study Figure 5.
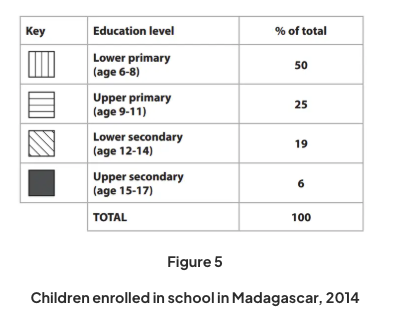
Suggest reasons why the number of years spent in education by Madagascar's children could affect its economic development.
Was this exam question helpful?
Study Figure A below.
Country | Malawi | Nigeria | India | Egypt | Iran | Czech Republic | France | United States | Norway |
|---|---|---|---|---|---|---|---|---|---|
Human Development Index | 0.43 | 0.50 | 0.58 | 0.68 | 0.75 | 0.85 | 0.88 | 0.91 | 0.94 |
Gini Coefficient | 0.43 | 0.48 | 0.34 | 0.30 | 0.38 | 0.26 | 0.32 | 0.40 | 0.25 |
Figure A: Table showing the Human Development Index and the Gini Coefficient scores for selected countries
Suggest reasons for the relationship between Human Development Index and Gini Coefficient scores.
Was this exam question helpful?
Explain why levels of life expectancy vary both in and between countries.
Was this exam question helpful?

The rs value is statistically significant at the 95% level, therefore the null hypothesis can be rejected, and the alternative hypothesis can be accepted.
The alternative hypothesis: there is a statistically significant relationship between health expenditure per capita and life expectancy.
Suggest reasons for the relationship between health expenditure per capita and life expectancy.
Was this exam question helpful?
Study Figure 4.
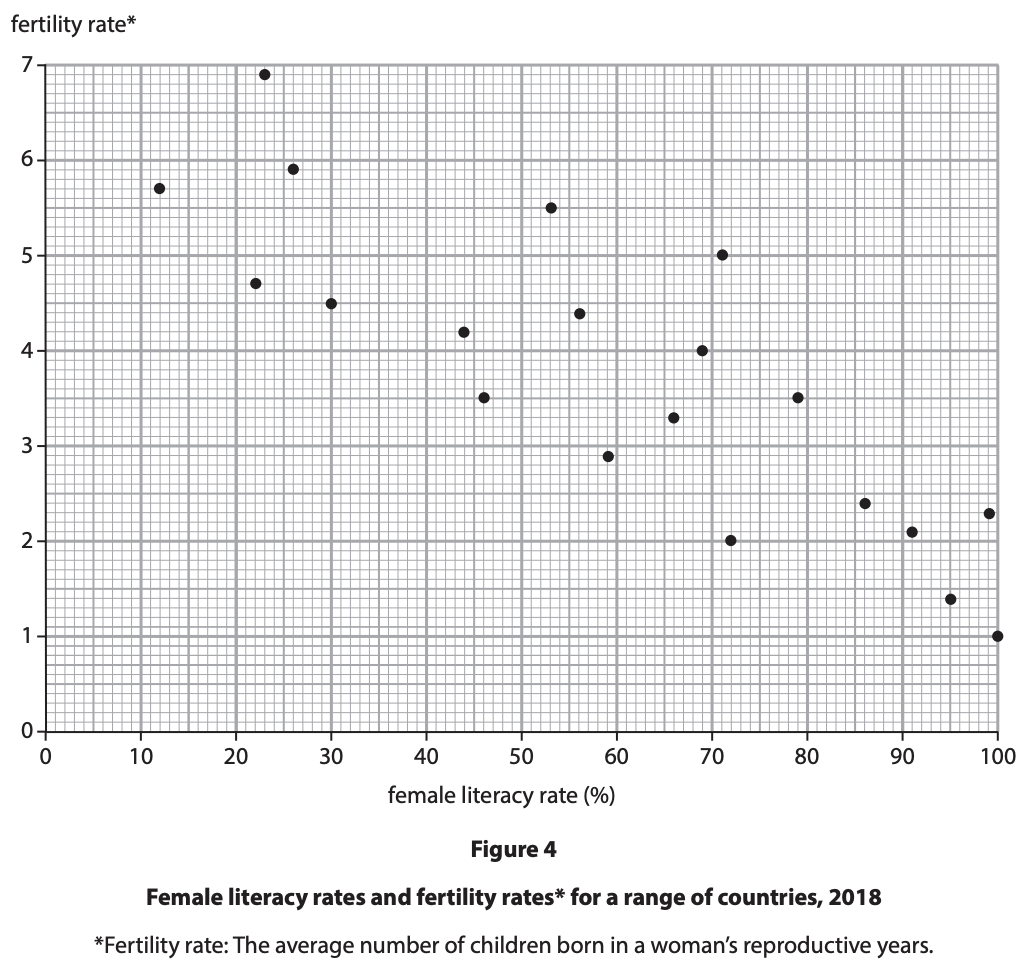
Suggest reasons for the relationship shown between the rates of female literacy and fertility.
Was this exam question helpful?
Study Figure 3.
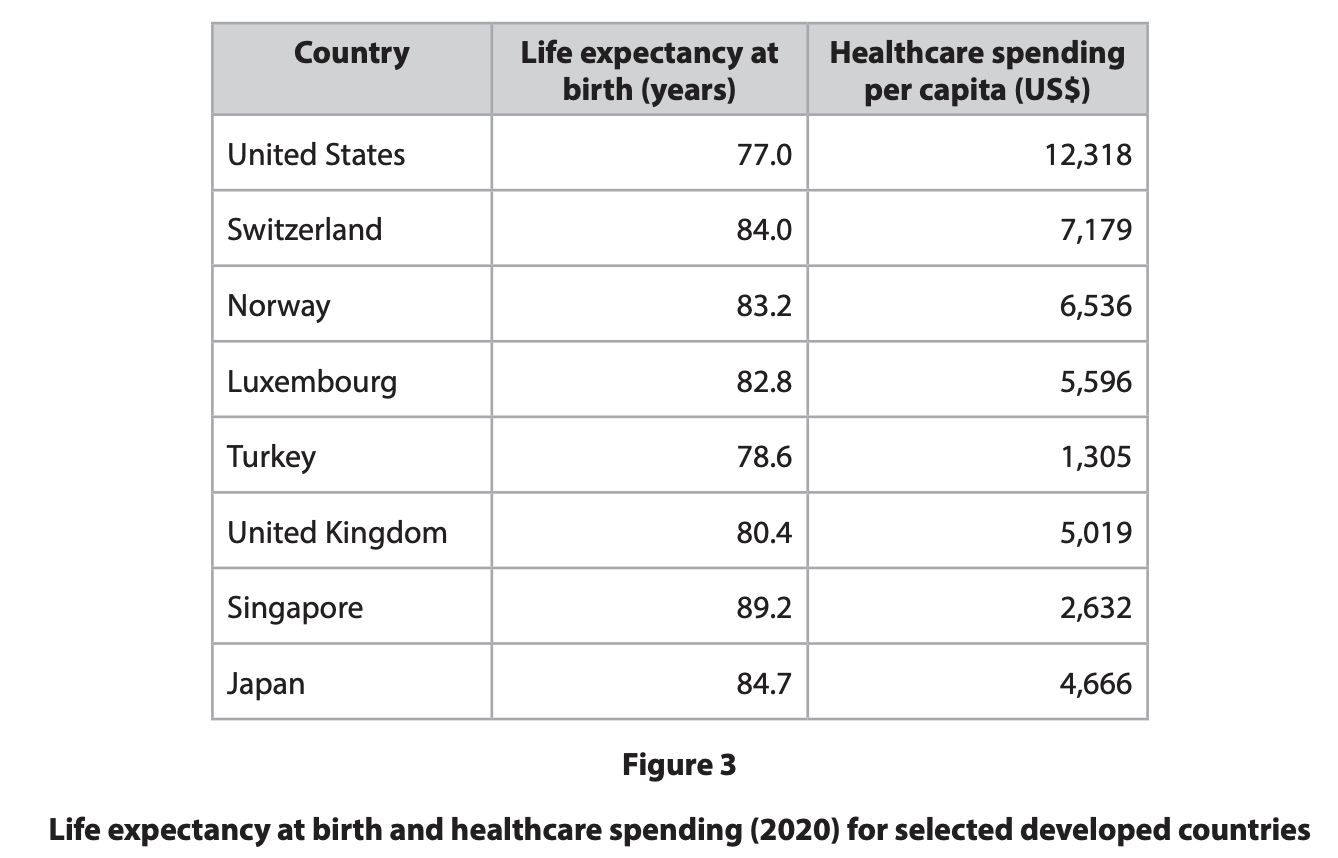
Suggest why life expectancy varies for these developed countries.
Was this exam question helpful?
Evaluate the view that Intergovernmental Organisations (IGOs) have been largely unsuccessful in improving human development.
Was this exam question helpful?
Evaluate the view that economic development is the most important factor in improving human development.
Was this exam question helpful?
Evaluate the view that international governmental organisations (IGOs) have been largely unsuccessful in improving human development.
Was this exam question helpful?
Evaluate the view that the type of government is the main reason for variations in human health and life expectancy.
Was this exam question helpful?