Risk of Tectonic Hazards (Edexcel A Level Geography): Exam Questions

Exam code: 9GE0

1 hour11 questions
1a
Sme Calculator
1 mark

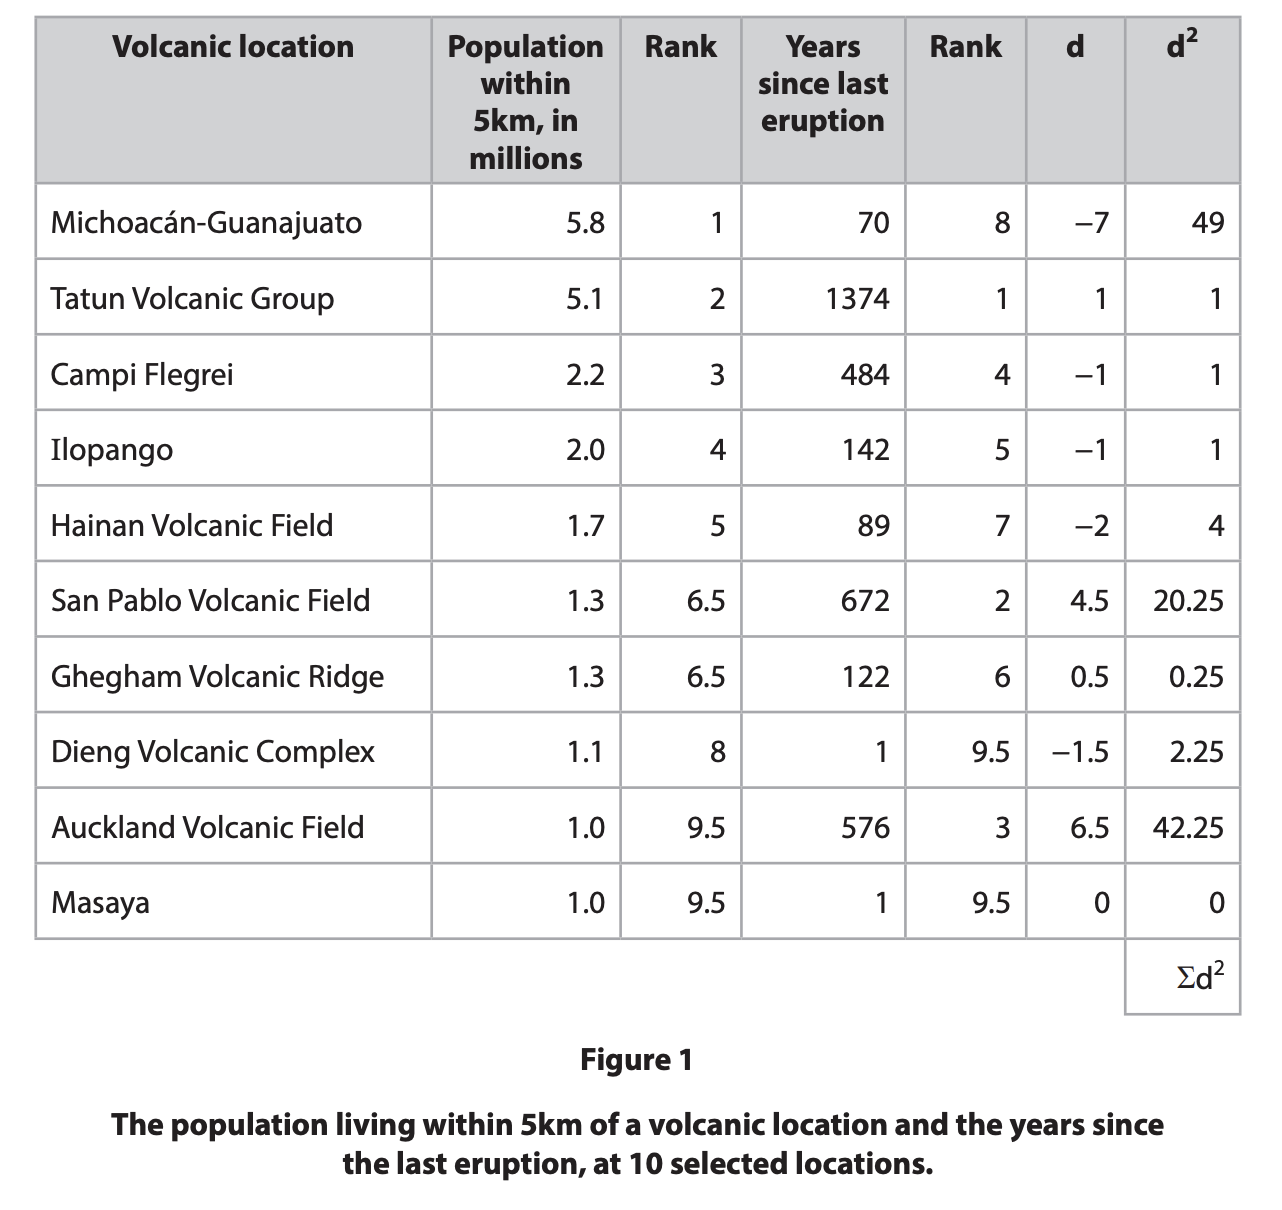
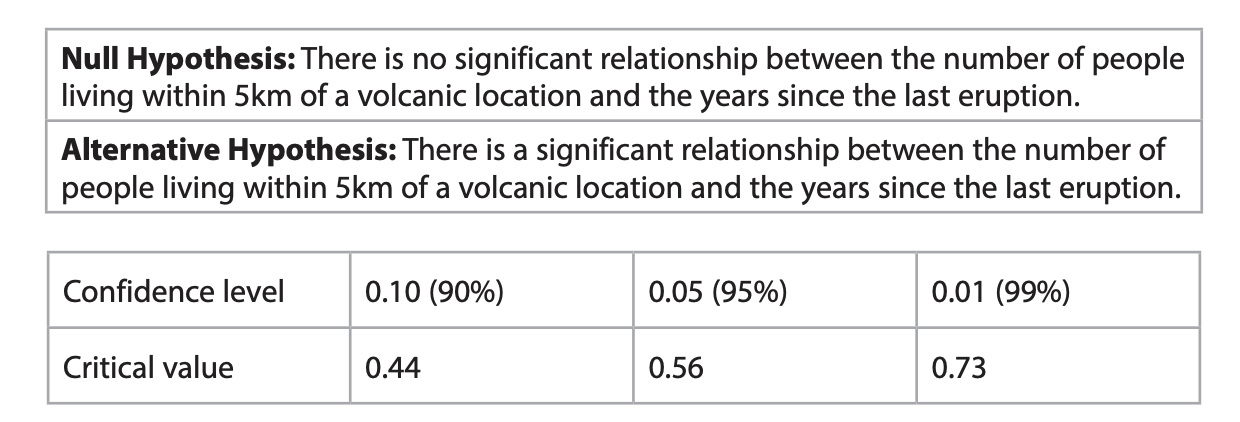
Study Figure 1a and Figure 1b which show the magnitude and duration of eight selected earthquakes.

Earthquake

Earthquake magnitude Moment Magnitude Scale (MMS)

Duration in seconds

A

6.9

120

B

5.4

1

C

9.0

D

6.8

6.8

E

6.9

280

F

7.3

24

G

6.4

5.9

H

7.0

7.8

Figure 1a

fig-1b-qp-9geo-01-nov-2021-edexcel-a-level-geo

Figure 1b

Using Figure 1b complete Figure 1a by stating the duration of earthquake C.

1b
Sme Calculator
2 marks

Complete Figure 1b by plotting earthquake F using the data from Figure 1a.

1c
Sme Calculator
1 mark

Draw a regression (best-fit) line on Figure 1b to show the relationship between earthquake magnitude and duration.

2a
Sme Calculator
1 mark

Study Figure 1 below. This data in Figure 1 was collected to investigate whether there was a significant relationship between the percentage of silica and the percentage of volatile gases in lava samples, found at 12 contrasting volcanic locations.

Lava samples from 12 contrasting volcanic locations (n=12)

% of silica in the lava

Rank

% of volatile gases*

Rank

d

d^2^

1

50

9

1.9

11

−2

4

2

70

3

5.2

3

0

0

3

58

8

3.7

7

1

1

4

73

1

6.6

1

0

0

5

63

6

4.0

6

0

0

6

62

7

3.3

8

−1

1

7

45

12

3.0

9

3

9

8

71

2

4.1

5

−3

9

9

49

10

2.5

10

0

0

10

69

4

5.3

2

2

4

11

48

11

1.2

12

−1

1

12

68

5

4.5

4

1

1

∑d2 =

Volatile gases – gases emitted by volcanoes at high temperature such as water vapour, carbon dioxide and sulphur dioxide.

Complete Figure 1 by calculating ∑d2 .

2b
Sme Calculator
2 marks

The formula for Spearman’s rank correlation coefficient value rs is given below; in this data set n is equal to 12.

rs = 1 − \frac{6 \sum d^{2}}{n^{3} - n}

Calculate the value of rs to two decimal places for the data given. You must show your working.

2c
Sme Calculator
1 mark

The tables below show the two hypotheses that are being tested and the critical values of Spearman’s rank rs value when n = 12.

Null hypothesis: There is no significant relationship between the % of silica and the % of volatile gases in these lava samples.

Alternative hypothesis: There is a significant relationship between the % of silica and the % of volatile gases in these lava samples.

Confidence level

0.10 (90% significance)

0.05 (95% significance)

0.01 (99% significance)

Critical value

0.50

0.59

0.78

Using the Spearman’s rank correlation rs value calculated in (a)(ii), state which hypothesis can be accepted.

3a
Sme Calculator
2 marks

Study Figure 1a and Figure 1b below.

fig-1a-qp-9geo-01-june-2018-edexcel-a-level-geo

Figure 1a

Tectonic setting of New Zealand

This data in Figure 1b was collected to investigate whether there was a significant difference in earthquake depth at the two plate boundaries shown in Figure 1a.

Number of earthquakes recorded in 2016

Mean focal depth of earthquakes (in kilometres)

Plate boundary A

186

34.8

Plate boundary B

145

12.7

Figure 1b

Frequency and focal depth of earthquakes in New Zealand, 2016

Calculate the average monthly frequency of earthquakes at the two plate boundaries.

You must show your working.

3b
Sme Calculator
1 mark

A Student’s t-test was used to determine whether there was a statistical difference in the mean focal depth of the earthquakes at the two plate boundaries.

Two hypotheses were tested:

Null Hypothesis: There is no statistically significant difference between the mean focal depth of earthquakes at the two plate boundaries.

Alternative Hypothesis: There is a statistically significant difference between the mean focal depth of earthquakes at the two plate boundaries.

t = \frac{\bar{x_{1}} - \bar{x_{2}}}{\sqrt{\frac{\left(S_{1}\right)^{2}}{N_{1}} + \frac{\left(S_{2}\right)^{2}}{N_{2}}}}

Using the partially completed Student’s t-test below, calculate the value of t.

\mathbf{\mathit{t}} = \frac{22 . 1}{4 . 43}

t =.....................................

3c
Sme Calculator
1 mark

Study Figure 1c below.

Confidence level

0.10 (90% significance)

0.05 (95% significance)

0.01 (99% significance)

Critical value of Student’s t-test

1.6

2.0

2.6

Figure 1c

Critical values for this Student’s t-test

Using the Student’s t-test value calculated in (a) (ii), state whether there is a significant difference between the mean focal depth of the earthquakes.

4
Sme Calculator
1 mark

Study Figure 1, which was collected to investigate whether there was a significant relationship between the population living within 5km of a volcanic location and the years since the last eruption, at 10 selected locations.

Table listing 10 volcanic locations with nearby population, years since last eruption, ranks, and calculated d and d² values for statistical comparison

Calculate Σd².

5
Sme Calculator
2 marks

The formula for Spearman's rank correlation coefficient rs is given; in this data set n = 10.

r subscript s equals 1 minus fraction numerator 6 sum d squared over denominator n cubed minus n end fraction

Table of 10 volcanic locations showing nearby population in millions, years since last eruption, and ranks with calculated d and d² values for comparison

Calculate the value of rs, to two decimal places, for the data given. You must show your working.

6
1 mark

The tables below show the two hypotheses that are being tested and the critical values of Spearman’s rank rs when n = 10.

Table showing null and alternative hypotheses on people living within 5 km of volcanoes, plus confidence levels 90–99% with critical values 0.44–0.73

Using the Spearman's rank correlation rs value calculated in question 4, state which hypothesis can be accepted.

1
12 marks

Assess the extent to which plate tectonic theory can explain the global distribution of tectonic hazards.

2
20 marks

Evaluate the view that the physical processes operating at plate margins are the most important factor in determining the magnitude of tectonic hazards.

3
12 marks

Assess the extent to which the type of plate boundary determines the magnitude of a tectonic hazard.

4
12 marks

Assess the importance of plate boundaries in explaining the global distribution of tectonic hazards.

5
12 marks

Assess the relative importance of the different processes responsible for the movement of tectonic plates.