Poisson Hypothesis Testing (Edexcel A Level Further Maths): Revision Note
Exam code: 9FM0
Poisson hypothesis testing
How do I test for the mean of a Poisson distribution?
If
, test for the mean,
, using the following hypotheses
or
or
with significance level
For example,
for 5%
You will be given an observed value,
, in the question
This is what is being tested against
For example, "There's usually 3 accidents per hour (
), but last week there was 5 accidents per hour (
)"
You may need to rescale
to fit in the same interval of time or space as
Assuming
Find the probability that
is the observed value
, or more extreme than that
If the total probability of these values is
(or
for two-tailed tests)
Write that "there is sufficient evidence to reject
"
If not, write that "there is insufficient evidence to reject
"
Write a conclusion in context
For example
"the mean number of accidents has increased from 3 per hour"
or "the mean number of accidents has not changed from 3 per hour"
How do I find the critical region for a Poisson hypothesis test?
If
Assume that
Then test different integer values,
, to get
as close to
as possible, without exceeding it
Use cumulative Poisson tables or a calculator to help
The integer that's the nearest is called the critical value
Checking one integer higher should show that
is
The critical region is
If
It's the same process, but with
as close to
as possible, without exceeding it
Beware of integers with discrete inequalities
means
You may have found what
is, not what
is!
The critical region is
If
The critical region is
or
is as close to
as possible, without exceeding it
is as close to
as possible, without exceeding it
What is the actual significance level?
As the Poisson model is discrete, it's not possible to get a critical region whose probability sums to
exactly
That's because
can only take integer values
Whatever it does sum to is called the actual significance level
The actual amount of probability in the tail (or tails)
For example, if
has the critical region
Then
will be just less than
It's value is the actual significance level
It represents the probability of rejecting
incorrectly (when
was actually true)
Some questions want a critical region that's as close to
as possible, even if that means probabilities that exceed
For example, if
and
where
Then
is the critical region that's as close to
as possible
The actual significance level is 0.0510
Examiner Tips and Tricks
For finding critical regions, sometimes cumulative Poisson tables can be easier to read than calculators
Worked Example
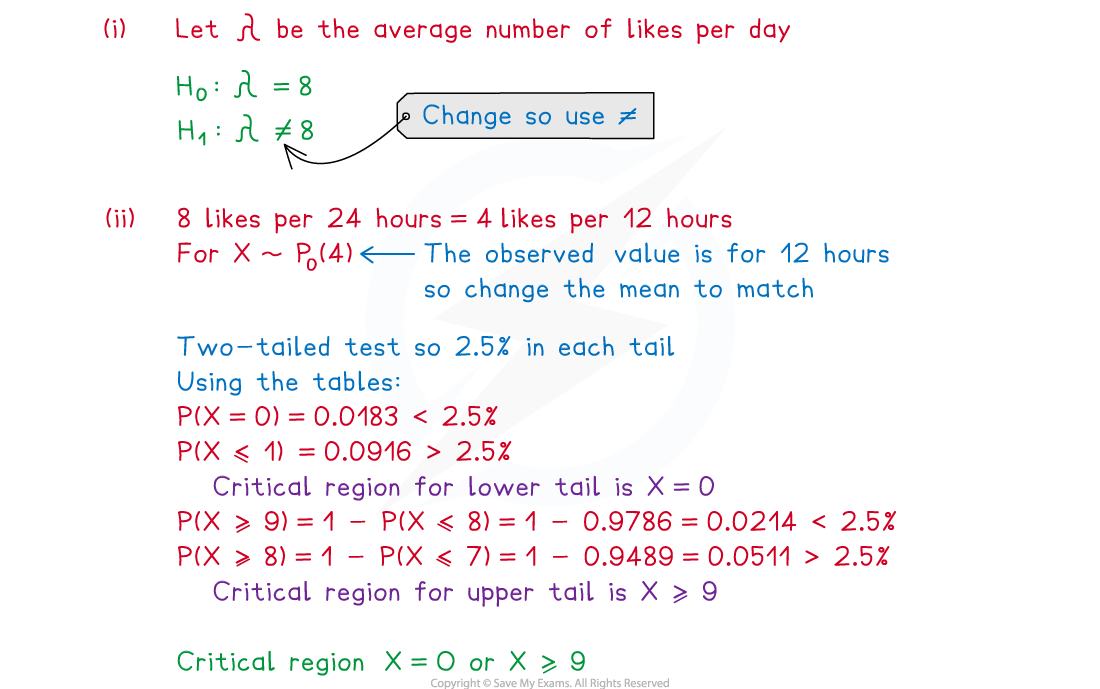
Mr Viajo believes that his travel blog receives an average of 8 likes per day (24 hour period). He tries a new advertising campaign and carries out a hypothesis test at the 5% level of significance to see if there is a change in the number of likes he gets. Over a 12-hour period chosen at random Mr Viajo’s travel blog receives 7 likes.
(i) State null and alternative hypotheses for Mr Viajo’s test.
(ii) Find the critical regions for the test.
(iii) Find the actual level of significance.
(iv) Carry out the hypothesis test, writing your conclusion clearly.


Unlock more, it's free!
Did this page help you?