Regions in Argand Diagrams (Edexcel A Level Further Maths) : Revision Note
Inequalities & Regions in Argand Diagrams
How do I sketch inequalities such as format('truetype')%3Bfont-weight%3Anormal%3Bfont-style%3Anormal%3B%7D%3C%2Fstyle%3E%3C%2Fdefs%3E%3Ctext%20font-family%3D%22Times%20New%20Roman%22%20font-size%3D%2220%22%20font-weight%3D%22bold%22%20text-anchor%3D%22middle%22%20x%3D%2212.5%22%20y%3D%2218%22%3ERe%3C%2Ftext%3E%3Ctext%20font-family%3D%22Times%20New%20Roman%22%20font-size%3D%2220%22%20font-style%3D%22italic%22%20font-weight%3D%22bold%22%20text-anchor%3D%22middle%22%20x%3D%2235.5%22%20y%3D%2218%22%3Ez%3C%2Ftext%3E%3Ctext%20font-family%3D%22math1072b030ba126b2f4b2374f342b%22%20font-size%3D%2217%22%20text-anchor%3D%22middle%22%20x%3D%2249.5%22%20y%3D%2218%22%3E%26lt%3B%3C%2Ftext%3E%3Ctext%20font-family%3D%22Times%20New%20Roman%22%20font-size%3D%2220%22%20font-style%3D%22italic%22%20font-weight%3D%22bold%22%20text-anchor%3D%22middle%22%20x%3D%2263.5%22%20y%3D%2218%22%3Ek%3C%2Ftext%3E%3C%2Fsvg%3E) or
or format('truetype')%3Bfont-weight%3Anormal%3Bfont-style%3Anormal%3B%7D%3C%2Fstyle%3E%3C%2Fdefs%3E%3Ctext%20font-family%3D%22Times%20New%20Roman%22%20font-size%3D%2220%22%20font-weight%3D%22bold%22%20text-anchor%3D%22middle%22%20x%3D%2212.5%22%20y%3D%2218%22%3EIm%3C%2Ftext%3E%3Ctext%20font-family%3D%22Times%20New%20Roman%22%20font-size%3D%2220%22%20font-style%3D%22italic%22%20font-weight%3D%22bold%22%20text-anchor%3D%22middle%22%20x%3D%2235.5%22%20y%3D%2218%22%3Ez%3C%2Ftext%3E%3Ctext%20font-family%3D%22math1072b030ba126b2f4b2374f342b%22%20font-size%3D%2217%22%20text-anchor%3D%22middle%22%20x%3D%2249.5%22%20y%3D%2218%22%3E%26lt%3B%3C%2Ftext%3E%3Ctext%20font-family%3D%22Times%20New%20Roman%22%20font-size%3D%2220%22%20font-style%3D%22italic%22%20font-weight%3D%22bold%22%20text-anchor%3D%22middle%22%20x%3D%2263.5%22%20y%3D%2218%22%3Ek%3C%2Ftext%3E%3C%2Fsvg%3E) on an Argand diagram?
on an Argand diagram?
The inequality
is satisfied by all complex numbers,
, with a real part less than 2
On an Argand diagram, this would be the region to the left of the vertical line
The vertical line itself,
, should be drawn dotted to show that points on this line are not permitted due to the strict inequality (<)
In general, dotted lines are used with strict inequalities ( < or > ) and solid lines are used with inequalities that can be equal ( ≤ or ≥ )
Here is how to represent the following inequalities as regions on an Argand diagram…
: shade the region to the left of the dotted vertical line (or solid vertical line for ≤)
: shade the region to the right of the dotted vertical line (or solid vertical line for ≥)
Similarly, here is how to represent the following inequalities as regions on an Argand diagram…
: shade the region below the dotted horizontal line (or solid horizontal line for ≤)
: shade the region above the dotted horizontal line (or solid horizontal line for ≥)
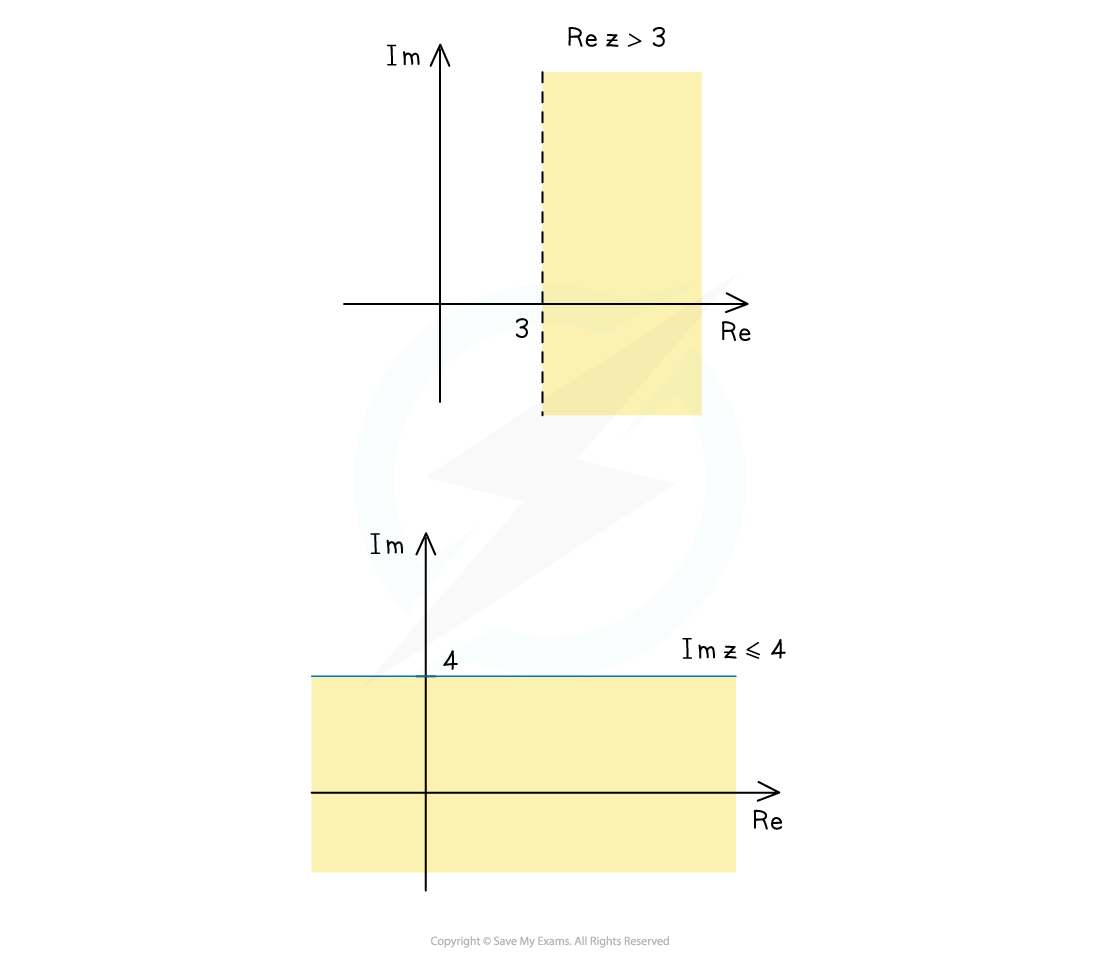
Sketching the inequalities
How do I sketch inequalities such as format('truetype')%3Bfont-weight%3Anormal%3Bfont-style%3Anormal%3B%7D%40font-face%7Bfont-family%3A'brack_sm47dfc8ff4929ef7202a7f1c'%3Bsrc%3Aurl(data%3Afont%2Ftruetype%3Bcharset%3Dutf-8%3Bbase64%2CAAEAAAAMAIAAAwBAT1MvMi7PH4UAAADMAAAATmNtYXA3kjw6AAABHAAAADRjdnQgAQYDiAAAAVAAAAASZ2x5ZkyYQ7YAAAFkAAAAWWhlYWQLyR8fAAABwAAAADZoaGVhAq0XCAAAAfgAAAAkaG10eDEjA%2FUAAAIcAAAACGxvY2EAAEKZAAACJAAAAAxtYXhwBJsEcQAAAjAAAAAgbmFtZW7QvZAAAAJQAAAB5XBvc3QArQBVAAAEOAAAACBwcmVwu5WEAAAABFgAAAAHAAACDAGQAAUAAAQABAAAAAAABAAEAAAAAAAAAQEAAAAAAAAAAAAAAAAAAAAAAAAAAAAAAAAAAAAAACAgICAAAAAg9AMD%2FP%2F8AAABVAABAAAAAAACAAEAAQAAABQAAwABAAAAFAAEACAAAAAEAAQAAQAA9AL%2F%2FwAA9AL%2F%2Fwv%2FAAEAAAAAAAABVABUAQAAKwCMAIAAqAAHAAAAAgAAAAAA1QEBAAMABwAAMTMRIxcjNTPV1auAgAEB1qsAAQBQAAAAoAFUAAMAHxgBsAMvsAA8sQIC9bABPACxAwA%2FsAI8fLEABvWwATwTMxEjUFBQAVT%2BrAAAAAABAAAAAQAAix6x7F8PPPUAAwQA%2F%2F%2F%2F%2F9Wt7mT%2F%2F%2F%2F%2F1a3uZP%2BA%2F%2F8B1gFYAAAACgACAAEAAAAAAAEAAAFU%2F%2F8AABdw%2F4D%2FgAHWAAEAAAAAAAAAAAAAAAAAAAACANUAAADwAFAAAAAAAAAAIQAAAFkAAQAAAAIACgACAAAAAAACAIAEAAAAAAAEAABlAAAAAAAAABUBAgAAAAAAAAABACYAAAAAAAAAAAACAA4AJgAAAAAAAAADAEQANAAAAAAAAAAEACYAeAAAAAAAAAAFABYAngAAAAAAAAAGABMAtAAAAAAAAAAIABwAxwABAAAAAAABACYAAAABAAAAAAACAA4AJgABAAAAAAADAEQANAABAAAAAAAEACYAeAABAAAAAAAFABYAngABAAAAAAAGABMAtAABAAAAAAAIABwAxwADAAEECQABACYAAAADAAEECQACAA4AJgADAAEECQADAEQANAADAAEECQAEACYAeAADAAEECQAFABYAngADAAEECQAGABMAtAADAAEECQAIABwAxwBCAHIAYQBjAGsAZQB0AHMAIABzAG0AYQBsAGwAIABzAGkAegBlAFIAZQBnAHUAbABhAHIATQBhAHQAaABzACAARgBvAHIAIABNAG8AcgBlACAAQgByAGEAYwBrAGUAdABzACAAcwBtAGEAbABsACAAcwBpAHoAZQBCAHIAYQBjAGsAZQB0AHMAIABzAG0AYQBsAGwAIABzAGkAegBlAFYAZQByAHMAaQBvAG4AIAAyAC4AMEJyYWNrZXRzX3NtYWxsX3NpemUATQBhAHQAaABzACAARgBvAHIAIABNAG8AcgBlAAAAAAMAAAAAAAAAqgBVAAAAAAAAAAAAAAAAAAAAAAAAAAC5B%2F8AAo2FAA%3D%3D)format('truetype')%3Bfont-weight%3Anormal%3Bfont-style%3Anormal%3B%7D%3C%2Fstyle%3E%3C%2Fdefs%3E%3Ctext%20font-family%3D%22brack_sm47dfc8ff4929ef7202a7f1c%22%20font-size%3D%2222%22%20text-anchor%3D%22start%22%20x%3D%221.5%22%20y%3D%2210%22%3E%26%23xF402%3B%3C%2Ftext%3E%3Ctext%20font-family%3D%22brack_sm47dfc8ff4929ef7202a7f1c%22%20font-size%3D%2222%22%20text-anchor%3D%22start%22%20x%3D%221.5%22%20y%3D%2217%22%3E%26%23xF402%3B%3C%2Ftext%3E%3Ctext%20font-family%3D%22brack_sm47dfc8ff4929ef7202a7f1c%22%20font-size%3D%2222%22%20text-anchor%3D%22start%22%20x%3D%221.5%22%20y%3D%2224%22%3E%26%23xF402%3B%3C%2Ftext%3E%3Ctext%20font-family%3D%22brack_sm47dfc8ff4929ef7202a7f1c%22%20font-size%3D%2222%22%20text-anchor%3D%22start%22%20x%3D%2252.5%22%20y%3D%2210%22%3E%26%23xF402%3B%3C%2Ftext%3E%3Ctext%20font-family%3D%22brack_sm47dfc8ff4929ef7202a7f1c%22%20font-size%3D%2222%22%20text-anchor%3D%22start%22%20x%3D%2252.5%22%20y%3D%2217%22%3E%26%23xF402%3B%3C%2Ftext%3E%3Ctext%20font-family%3D%22brack_sm47dfc8ff4929ef7202a7f1c%22%20font-size%3D%2222%22%20text-anchor%3D%22start%22%20x%3D%2252.5%22%20y%3D%2224%22%3E%26%23xF402%3B%3C%2Ftext%3E%3Ctext%20font-family%3D%22Times%20New%20Roman%22%20font-size%3D%2222%22%20font-style%3D%22italic%22%20font-weight%3D%22bold%22%20text-anchor%3D%22middle%22%20x%3D%2212.5%22%20y%3D%2220%22%3Ez%3C%2Ftext%3E%3Ctext%20font-family%3D%22math161142e9f94254aae10c0576b1e%22%20font-size%3D%2219%22%20text-anchor%3D%22middle%22%20x%3D%2229.5%22%20y%3D%2220%22%3E%26%23x2212%3B%3C%2Ftext%3E%3Ctext%20font-family%3D%22Times%20New%20Roman%22%20font-size%3D%2222%22%20font-style%3D%22italic%22%20font-weight%3D%22bold%22%20text-anchor%3D%22middle%22%20x%3D%2244.5%22%20y%3D%2220%22%3Ea%3C%2Ftext%3E%3Ctext%20font-family%3D%22math161142e9f94254aae10c0576b1e%22%20font-size%3D%2219%22%20text-anchor%3D%22middle%22%20x%3D%2267.5%22%20y%3D%2220%22%3E%26lt%3B%3C%2Ftext%3E%3Ctext%20font-family%3D%22Times%20New%20Roman%22%20font-size%3D%2222%22%20font-style%3D%22italic%22%20font-weight%3D%22bold%22%20text-anchor%3D%22middle%22%20x%3D%2282.5%22%20y%3D%2220%22%3Ek%3C%2Ftext%3E%3C%2Fsvg%3E) on an Argand diagram?
on an Argand diagram?
For a given complex number
, the inequality
represents all complex numbers,
, that lie inside the circle of radius
, centred at
Here is how to represent the following inequalities as regions on an Argand diagram…
: shade the region inside the circle of radius
, centred at
: shade the (unbounded) region outside circle of radius
, centred at
Again use a dotted line for strict inequalities (< and >) and a solid line for weak inequalities ( ≤ or ≥ )
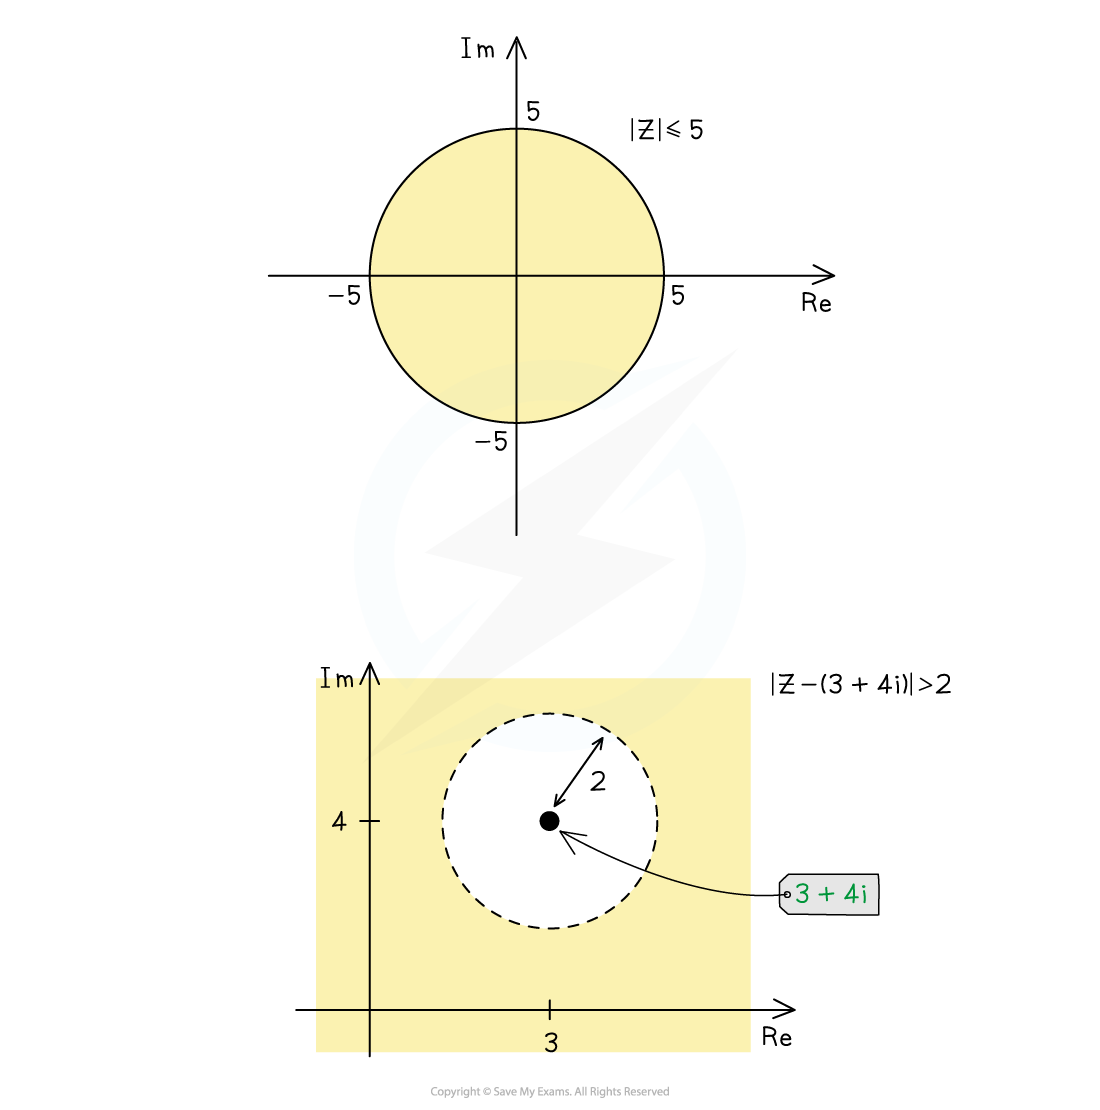
Sketching the inequalities and
How do I sketch inequalities such as format('truetype')%3Bfont-weight%3Anormal%3Bfont-style%3Anormal%3B%7D%40font-face%7Bfont-family%3A'brack_sm47dfc8ff4929ef7202a7f1c'%3Bsrc%3Aurl(data%3Afont%2Ftruetype%3Bcharset%3Dutf-8%3Bbase64%2CAAEAAAAMAIAAAwBAT1MvMi7PH4UAAADMAAAATmNtYXA3kjw6AAABHAAAADRjdnQgAQYDiAAAAVAAAAASZ2x5ZkyYQ7YAAAFkAAAAWWhlYWQLyR8fAAABwAAAADZoaGVhAq0XCAAAAfgAAAAkaG10eDEjA%2FUAAAIcAAAACGxvY2EAAEKZAAACJAAAAAxtYXhwBJsEcQAAAjAAAAAgbmFtZW7QvZAAAAJQAAAB5XBvc3QArQBVAAAEOAAAACBwcmVwu5WEAAAABFgAAAAHAAACDAGQAAUAAAQABAAAAAAABAAEAAAAAAAAAQEAAAAAAAAAAAAAAAAAAAAAAAAAAAAAAAAAAAAAACAgICAAAAAg9AMD%2FP%2F8AAABVAABAAAAAAACAAEAAQAAABQAAwABAAAAFAAEACAAAAAEAAQAAQAA9AL%2F%2FwAA9AL%2F%2Fwv%2FAAEAAAAAAAABVABUAQAAKwCMAIAAqAAHAAAAAgAAAAAA1QEBAAMABwAAMTMRIxcjNTPV1auAgAEB1qsAAQBQAAAAoAFUAAMAHxgBsAMvsAA8sQIC9bABPACxAwA%2FsAI8fLEABvWwATwTMxEjUFBQAVT%2BrAAAAAABAAAAAQAAix6x7F8PPPUAAwQA%2F%2F%2F%2F%2F9Wt7mT%2F%2F%2F%2F%2F1a3uZP%2BA%2F%2F8B1gFYAAAACgACAAEAAAAAAAEAAAFU%2F%2F8AABdw%2F4D%2FgAHWAAEAAAAAAAAAAAAAAAAAAAACANUAAADwAFAAAAAAAAAAIQAAAFkAAQAAAAIACgACAAAAAAACAIAEAAAAAAAEAABlAAAAAAAAABUBAgAAAAAAAAABACYAAAAAAAAAAAACAA4AJgAAAAAAAAADAEQANAAAAAAAAAAEACYAeAAAAAAAAAAFABYAngAAAAAAAAAGABMAtAAAAAAAAAAIABwAxwABAAAAAAABACYAAAABAAAAAAACAA4AJgABAAAAAAADAEQANAABAAAAAAAEACYAeAABAAAAAAAFABYAngABAAAAAAAGABMAtAABAAAAAAAIABwAxwADAAEECQABACYAAAADAAEECQACAA4AJgADAAEECQADAEQANAADAAEECQAEACYAeAADAAEECQAFABYAngADAAEECQAGABMAtAADAAEECQAIABwAxwBCAHIAYQBjAGsAZQB0AHMAIABzAG0AYQBsAGwAIABzAGkAegBlAFIAZQBnAHUAbABhAHIATQBhAHQAaABzACAARgBvAHIAIABNAG8AcgBlACAAQgByAGEAYwBrAGUAdABzACAAcwBtAGEAbABsACAAcwBpAHoAZQBCAHIAYQBjAGsAZQB0AHMAIABzAG0AYQBsAGwAIABzAGkAegBlAFYAZQByAHMAaQBvAG4AIAAyAC4AMEJyYWNrZXRzX3NtYWxsX3NpemUATQBhAHQAaABzACAARgBvAHIAIABNAG8AcgBlAAAAAAMAAAAAAAAAqgBVAAAAAAAAAAAAAAAAAAAAAAAAAAC5B%2F8AAo2FAA%3D%3D)format('truetype')%3Bfont-weight%3Anormal%3Bfont-style%3Anormal%3B%7D%3C%2Fstyle%3E%3C%2Fdefs%3E%3Ctext%20font-family%3D%22brack_sm47dfc8ff4929ef7202a7f1c%22%20font-size%3D%2222%22%20font-weight%3D%22bold%22%20text-anchor%3D%22start%22%20x%3D%221.5%22%20y%3D%2211%22%3E%26%23xF402%3B%3C%2Ftext%3E%3Ctext%20font-family%3D%22brack_sm47dfc8ff4929ef7202a7f1c%22%20font-size%3D%2222%22%20font-weight%3D%22bold%22%20text-anchor%3D%22start%22%20x%3D%221.5%22%20y%3D%2218%22%3E%26%23xF402%3B%3C%2Ftext%3E%3Ctext%20font-family%3D%22brack_sm47dfc8ff4929ef7202a7f1c%22%20font-size%3D%2222%22%20font-weight%3D%22bold%22%20text-anchor%3D%22start%22%20x%3D%221.5%22%20y%3D%2225%22%3E%26%23xF402%3B%3C%2Ftext%3E%3Ctext%20font-family%3D%22Times%20New%20Roman%22%20font-size%3D%2222%22%20font-style%3D%22italic%22%20font-weight%3D%22bold%22%20text-anchor%3D%22middle%22%20x%3D%2212.5%22%20y%3D%2220%22%3Ez%3C%2Ftext%3E%3Ctext%20font-family%3D%22math19f213cffee6d27f4fa15e23bb8%22%20font-size%3D%2219%22%20font-style%3D%22italic%22%20font-weight%3D%22bold%22%20text-anchor%3D%22middle%22%20x%3D%2228.5%22%20y%3D%2220%22%3E%26%23x2212%3B%3C%2Ftext%3E%3Ctext%20font-family%3D%22Times%20New%20Roman%22%20font-size%3D%2222%22%20font-style%3D%22italic%22%20font-weight%3D%22bold%22%20text-anchor%3D%22middle%22%20x%3D%2244.5%22%20y%3D%2220%22%3Ea%3C%2Ftext%3E%3Ctext%20font-family%3D%22brack_sm47dfc8ff4929ef7202a7f1c%22%20font-size%3D%2222%22%20font-weight%3D%22bold%22%20text-anchor%3D%22start%22%20x%3D%2252.5%22%20y%3D%2210%22%3E%26%23xF402%3B%3C%2Ftext%3E%3Ctext%20font-family%3D%22brack_sm47dfc8ff4929ef7202a7f1c%22%20font-size%3D%2222%22%20font-weight%3D%22bold%22%20text-anchor%3D%22start%22%20x%3D%2252.5%22%20y%3D%2217%22%3E%26%23xF402%3B%3C%2Ftext%3E%3Ctext%20font-family%3D%22brack_sm47dfc8ff4929ef7202a7f1c%22%20font-size%3D%2222%22%20font-weight%3D%22bold%22%20text-anchor%3D%22start%22%20x%3D%2252.5%22%20y%3D%2224%22%3E%26%23xF402%3B%3C%2Ftext%3E%3Ctext%20font-family%3D%22math19f213cffee6d27f4fa15e23bb8%22%20font-size%3D%2219%22%20font-weight%3D%22bold%22%20text-anchor%3D%22middle%22%20x%3D%2269.5%22%20y%3D%2220%22%3E%26lt%3B%3C%2Ftext%3E%3Ctext%20font-family%3D%22math19f213cffee6d27f4fa15e23bb8%22%20font-size%3D%2219%22%20font-weight%3D%22bold%22%20text-anchor%3D%22middle%22%20x%3D%2284.5%22%20y%3D%2220%22%3E%7C%3C%2Ftext%3E%3Ctext%20font-family%3D%22Times%20New%20Roman%22%20font-size%3D%2222%22%20font-style%3D%22italic%22%20font-weight%3D%22bold%22%20text-anchor%3D%22middle%22%20x%3D%2294.5%22%20y%3D%2220%22%3Ez%3C%2Ftext%3E%3Ctext%20font-family%3D%22math19f213cffee6d27f4fa15e23bb8%22%20font-size%3D%2219%22%20font-weight%3D%22bold%22%20text-anchor%3D%22middle%22%20x%3D%22111.5%22%20y%3D%2220%22%3E%26%23x2212%3B%3C%2Ftext%3E%3Ctext%20font-family%3D%22Times%20New%20Roman%22%20font-size%3D%2222%22%20font-style%3D%22italic%22%20font-weight%3D%22bold%22%20text-anchor%3D%22middle%22%20x%3D%22128.5%22%20y%3D%2220%22%3Eb%3C%2Ftext%3E%3Ctext%20font-family%3D%22math19f213cffee6d27f4fa15e23bb8%22%20font-size%3D%2219%22%20font-weight%3D%22bold%22%20text-anchor%3D%22middle%22%20x%3D%22138.5%22%20y%3D%2220%22%3E%7C%3C%2Ftext%3E%3C%2Fsvg%3E) on an Argand diagram?
on an Argand diagram?
For two given complex numbers
and
, the inequality
represents all complex numbers,
, that lie closer to
than to
Here is how to represent the following inequalities as regions on an Argand diagram…
: shade the region on the side of the perpendicular bisector of
and
that includes the point
: shade the region on the side of the dotted perpendicular bisector of
and
that includes the point
A good way to remember which side to shade is that the inequality sign points (like an arrow) to the side to be shaded
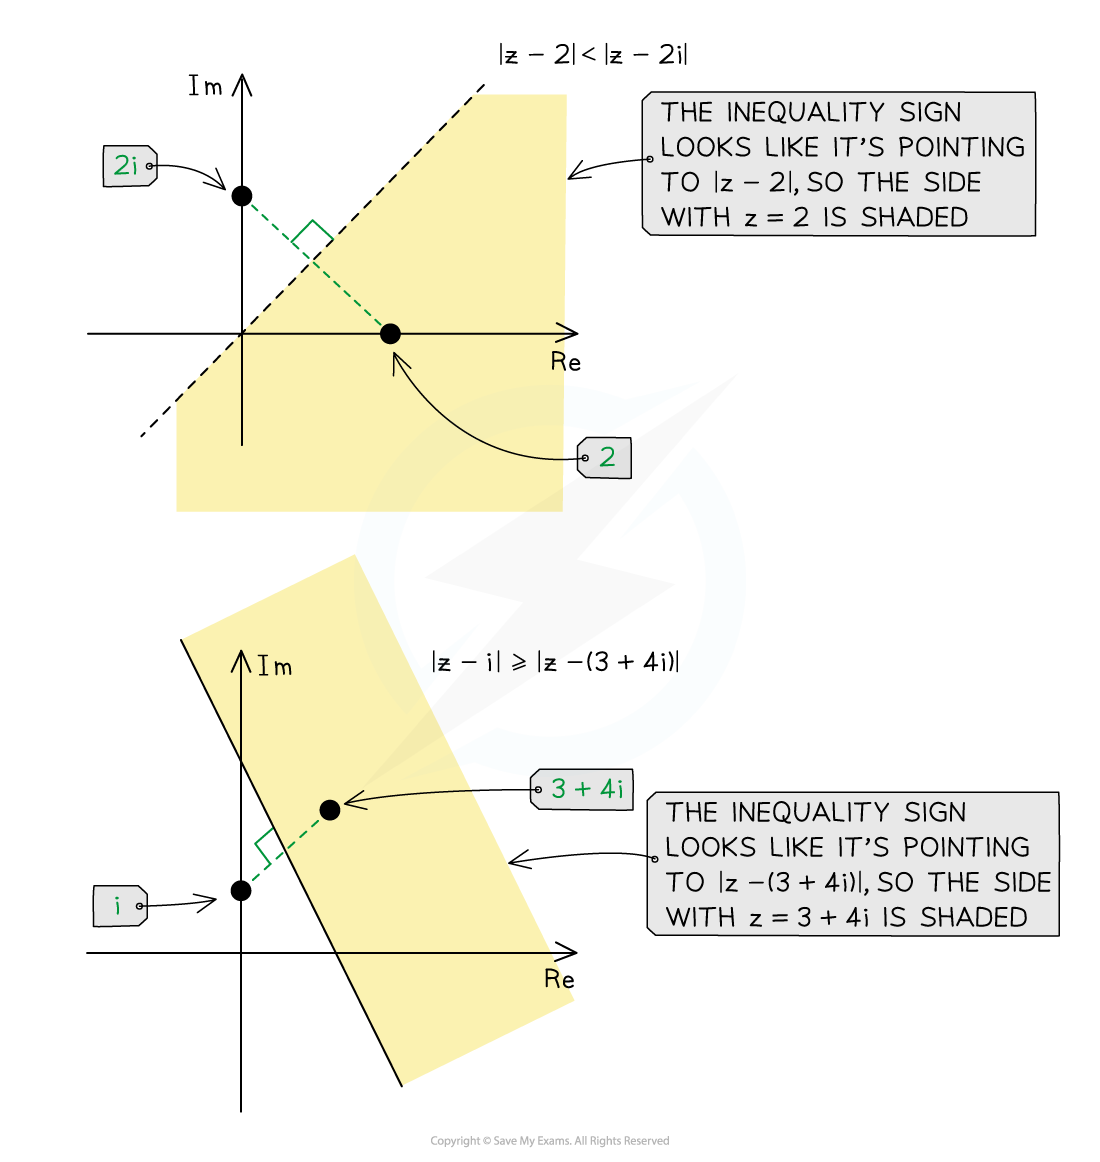
Sketching the inequalities and
How do I sketch inequalities such as %3C%2Fmo%3E%3C%2Fmrow%3E%3Cmo%20mathvariant%3D%22bold%22%3E%26lt%3B%3C%2Fmo%3E%3Cmi%20mathvariant%3D%22bold-italic%22%3E%26%23x3B2%3B%3C%2Fmi%3E%3C%2Fmstyle%3E%3C%2Fmath%3E--%3E%3Cdefs%3E%3Cstyle%20type%3D%22text%2Fcss%22%3E%40font-face%7Bfont-family%3A'math159c6977985a99e5bbc03f0885b'%3Bsrc%3Aurl(data%3Afont%2Ftruetype%3Bcharset%3Dutf-8%3Bbase64%2CAAEAAAAMAIAAAwBAT1MvMi7iBBMAAADMAAAATmNtYXDEvmKUAAABHAAAADxjdnQgDVUNBwAAAVgAAAA6Z2x5ZoPi2VsAAAGUAAABFmhlYWQQC2qxAAACrAAAADZoaGVhCGsXSAAAAuQAAAAkaG10eE2rRkcAAAMIAAAADGxvY2EAHTwYAAADFAAAABBtYXhwBT0FPgAAAyQAAAAgbmFtZaBxlY4AAANEAAABn3Bvc3QB9wD6AAAE5AAAACBwcmVwa1uragAABQQAAAAUAAADSwGQAAUAAAQABAAAAAAABAAEAAAAAAAAAQEAAAAAAAAAAAAAAAAAAAAAAAAAAAAAAAAAAAAAACAgICAAAAAg1UADev96AAAD6ACWAAAAAAACAAEAAQAAABQAAwABAAAAFAAEACgAAAAGAAQAAQACADwiEv%2F%2FAAAAPCIS%2F%2F%2F%2Fxd3wAAEAAAAAAAAAAAFUAywAgAEAAFYAKgJYAh4BDgEsAiwAWgGAAoAAoADUAIAAAAAAAAAAKwBVAIAAqwDVAQABKwAHAAAAAgBVAAADAAOrAAMABwAAMxEhESUhESFVAqv9qwIA%2FgADq%2FxVVQMAAAIAgABVAoACqwAFAAsAbBiwQRoAsQAAExCxAAbksQABExCwCTyxAQX1sAo8sAAQsQUD9bECBe2xBAP1sQMF7bAKELELA%2FWxCAXtsQYD9bEHBe0BsAwQsQED9rIJAAo8PDyxBQT1sgIICzw8PLEEBPWyBgcDPDw8sQ0D5hMHBRc1JwE1DQEXN4EBAQD%2F%2FwEA%2FwD%2FAAH%2FAatWgIBWgAEqVoCAVoAAAQCAAVUC1QGrAAMAMBgBsAQQsQAD9rADPLECB%2FWwATyxBQPmALEAABMQsQAG5bEAARMQsAE8sQMF9bACPBMhFSGAAlX9qwGrVgAAAAEAAAABAADVeM5BXw889QADBAD%2F%2F%2F%2F%2F1joTc%2F%2F%2F%2F%2F%2FWOhNzAAD%2FIASAA6sAAAAKAAIAAQAAAAAAAQAAA%2Bj%2FagAAF3AAAP%2B2BIAAAQAAAAAAAAAAAAAAAAAAAAMDUgBVAwAAgANWAIAAAAAAAAAAKAAAAMwAAAEWAAEAAAADAF4ABQAAAAAAAgCABAAAAAAABAAA3gAAAAAAAAAVAQIAAAAAAAAAAQASAAAAAAAAAAAAAgAOABIAAAAAAAAAAwAwACAAAAAAAAAABAASAFAAAAAAAAAABQAWAGIAAAAAAAAABgAJAHgAAAAAAAAACAAcAIEAAQAAAAAAAQASAAAAAQAAAAAAAgAOABIAAQAAAAAAAwAwACAAAQAAAAAABAASAFAAAQAAAAAABQAWAGIAAQAAAAAABgAJAHgAAQAAAAAACAAcAIEAAwABBAkAAQASAAAAAwABBAkAAgAOABIAAwABBAkAAwAwACAAAwABBAkABAASAFAAAwABBAkABQAWAGIAAwABBAkABgAJAHgAAwABBAkACAAcAIEATQBhAHQAaAAgAEYAbwBuAHQAUgBlAGcAdQBsAGEAcgBNAGEAdABoAHMAIABGAG8AcgAgAE0AbwByAGUAIABNAGEAdABoACAARgBvAG4AdABNAGEAdABoACAARgBvAG4AdABWAGUAcgBzAGkAbwBuACAAMQAuADBNYXRoX0ZvbnQATQBhAHQAaABzACAARgBvAHIAIABNAG8AcgBlAAADAAAAAAAAAfQA%2BgAAAAAAAAAAAAAAAAAAAAAAAAAAuQcRAACNhRgAsgAAABUUE7EAAT8%3D)format('truetype')%3Bfont-weight%3Anormal%3Bfont-style%3Anormal%3B%7D%40font-face%7Bfont-family%3A'round_brackets18549f92a457f2409'%3Bsrc%3Aurl(data%3Afont%2Ftruetype%3Bcharset%3Dutf-8%3Bbase64%2CAAEAAAAMAIAAAwBAT1MvMjwHLFQAAADMAAAATmNtYXDf7xCrAAABHAAAADxjdnQgBAkDLgAAAVgAAAASZ2x5ZmAOz2cAAAFsAAABJGhlYWQOKih8AAACkAAAADZoaGVhCvgVwgAAAsgAAAAkaG10eCA6AAIAAALsAAAADGxvY2EAAARLAAAC%2BAAAABBtYXhwBIgEWQAAAwgAAAAgbmFtZXHR30MAAAMoAAACOXBvc3QDogHPAAAFZAAAACBwcmVwupWEAAAABYQAAAAHAAAGcgGQAAUAAAgACAAAAAAACAAIAAAAAAAAAQIAAAAAAAAAAAAAAAAAAAAAAAAAAAAAAAAAAAAAACAgICAAAAAo8AMGe%2F57AAAHPgGyAAAAAAACAAEAAQAAABQAAwABAAAAFAAEACgAAAAGAAQAAQACACgAKf%2F%2FAAAAKAAp%2F%2F%2F%2F2f%2FZAAEAAAAAAAAAAAFUAFYBAAAsAKgDgAAyAAcAAAACAAAAKgDVA1UAAwAHAAA1MxEjEyMRM9XVq4CAKgMr%2FQAC1QABAAD%2B0AIgBtAACQBNGAGwChCwA9SwAxCwAtSwChCwBdSwBRCwANSwAxCwBzywAhCwCDwAsAoQsAPUsAMQsAfUsAoQsAXUsAoQsADUsAMQsAI8sAcQsAg8MTAREAEzABEQASMAAZCQ%2FnABkJD%2BcALQ%2FZD%2BcAGQAnACcAGQ%2FnAAAQAA%2FtACIAbQAAkATRgBsAoQsAPUsAMQsALUsAoQsAXUsAUQsADUsAMQsAc8sAIQsAg8ALAKELAD1LADELAH1LAKELAF1LAKELAA1LADELACPLAHELAIPDEwARABIwAREAEzAAIg%2FnCQAZD%2BcJABkALQ%2FZD%2BcAGQAnACcAGQ%2FnAAAQAAAAEAAPW2NYFfDzz1AAMIAP%2F%2F%2F%2F%2FVre7u%2F%2F%2F%2F%2F9Wt7u4AAP7QA7cG0AAAAAoAAgABAAAAAAABAAAHPv5OAAAXcAAA%2F%2F4DtwABAAAAAAAAAAAAAAAAAAAAAwDVAAACIAAAAiAAAAAAAAAAAAAkAAAAowAAASQAAQAAAAMACgACAAAAAAACAIAEAAAAAAAEAABNAAAAAAAAABUBAgAAAAAAAAABAD4AAAAAAAAAAAACAA4APgAAAAAAAAADAFwATAAAAAAAAAAEAD4AqAAAAAAAAAAFABYA5gAAAAAAAAAGAB8A%2FAAAAAAAAAAIABwBGwABAAAAAAABAD4AAAABAAAAAAACAA4APgABAAAAAAADAFwATAABAAAAAAAEAD4AqAABAAAAAAAFABYA5gABAAAAAAAGAB8A%2FAABAAAAAAAIABwBGwADAAEECQABAD4AAAADAAEECQACAA4APgADAAEECQADAFwATAADAAEECQAEAD4AqAADAAEECQAFABYA5gADAAEECQAGAB8A%2FAADAAEECQAIABwBGwBSAG8AdQBuAGQAIABiAHIAYQBjAGsAZQB0AHMAIAB3AGkAdABoACAAYQBzAGMAZQBuAHQAIAAxADgANQA0AFIAZQBnAHUAbABhAHIATQBhAHQAaABzACAARgBvAHIAIABNAG8AcgBlACAAUgBvAHUAbgBkACAAYgByAGEAYwBrAGUAdABzACAAdwBpAHQAaAAgAGEAcwBjAGUAbgB0ACAAMQA4ADUANABSAG8AdQBuAGQAIABiAHIAYQBjAGsAZQB0AHMAIAB3AGkAdABoACAAYQBzAGMAZQBuAHQAIAAxADgANQA0AFYAZQByAHMAaQBvAG4AIAAyAC4AMFJvdW5kX2JyYWNrZXRzX3dpdGhfYXNjZW50XzE4NTQATQBhAHQAaABzACAARgBvAHIAIABNAG8AcgBlAAAAAAMAAAAAAAADnwHPAAAAAAAAAAAAAAAAAAAAAAAAAAC5B%2F8AAY2FAA%3D%3D)format('truetype')%3Bfont-weight%3Anormal%3Bfont-style%3Anormal%3B%7D%3C%2Fstyle%3E%3C%2Fdefs%3E%3Ctext%20font-family%3D%22Times%20New%20Roman%22%20font-size%3D%2222%22%20font-style%3D%22italic%22%20font-weight%3D%22bold%22%20text-anchor%3D%22middle%22%20x%3D%226.5%22%20y%3D%2220%22%3E%26%23x3B1%3B%3C%2Ftext%3E%3Ctext%20font-family%3D%22math159c6977985a99e5bbc03f0885b%22%20font-size%3D%2219%22%20font-weight%3D%22bold%22%20text-anchor%3D%22middle%22%20x%3D%2224.5%22%20y%3D%2220%22%3E%26lt%3B%3C%2Ftext%3E%3Ctext%20font-family%3D%22Times%20New%20Roman%22%20font-size%3D%2222%22%20font-weight%3D%22bold%22%20text-anchor%3D%22middle%22%20x%3D%2251.5%22%20y%3D%2220%22%3Earg%3C%2Ftext%3E%3Ctext%20font-family%3D%22round_brackets18549f92a457f2409%22%20font-size%3D%2222%22%20font-weight%3D%22bold%22%20text-anchor%3D%22middle%22%20x%3D%2272.5%22%20y%3D%2220%22%3E(%3C%2Ftext%3E%3Ctext%20font-family%3D%22Times%20New%20Roman%22%20font-size%3D%2222%22%20font-weight%3D%22bold%22%20text-anchor%3D%22middle%22%20x%3D%2281.5%22%20y%3D%2220%22%3Ez%3C%2Ftext%3E%3Ctext%20font-family%3D%22math159c6977985a99e5bbc03f0885b%22%20font-size%3D%2219%22%20font-weight%3D%22bold%22%20text-anchor%3D%22middle%22%20x%3D%2297.5%22%20y%3D%2220%22%3E%26%23x2212%3B%3C%2Ftext%3E%3Ctext%20font-family%3D%22Times%20New%20Roman%22%20font-size%3D%2222%22%20font-weight%3D%22bold%22%20text-anchor%3D%22middle%22%20x%3D%22113.5%22%20y%3D%2220%22%3Ea%3C%2Ftext%3E%3Ctext%20font-family%3D%22round_brackets18549f92a457f2409%22%20font-size%3D%2222%22%20font-weight%3D%22bold%22%20text-anchor%3D%22middle%22%20x%3D%22122.5%22%20y%3D%2220%22%3E)%3C%2Ftext%3E%3Ctext%20font-family%3D%22math159c6977985a99e5bbc03f0885b%22%20font-size%3D%2219%22%20font-weight%3D%22bold%22%20text-anchor%3D%22middle%22%20x%3D%22138.5%22%20y%3D%2220%22%3E%26lt%3B%3C%2Ftext%3E%3Ctext%20font-family%3D%22Times%20New%20Roman%22%20font-size%3D%2222%22%20font-style%3D%22italic%22%20font-weight%3D%22bold%22%20text-anchor%3D%22middle%22%20x%3D%22155.5%22%20y%3D%2220%22%3E%26%23x3B2%3B%3C%2Ftext%3E%3C%2Fsvg%3E) on an Argand diagram?
on an Argand diagram?
For a given complex number,
, the inequality
represents all complex numbers,
, that have an argument between
and
, as measured from the point
Here is how to represent the following inequalities as regions on an Argand diagram…
: shade the wedge-shaped region between the half-line
and the half-line
, with an open circle at
to show the exclusion of this point (to avoid the undefined value of
)
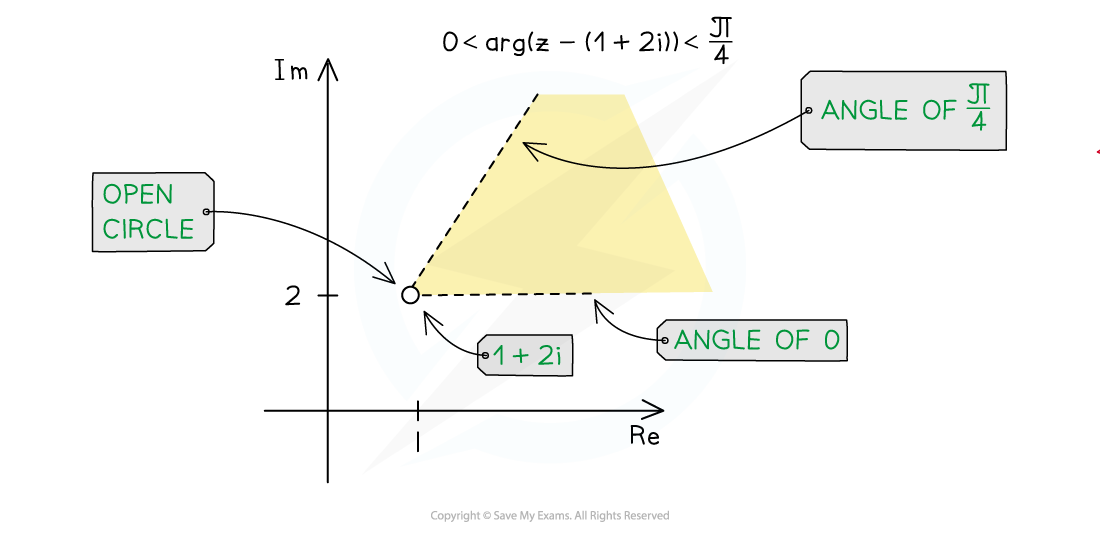
Sketching the inequalities
How do I draw multiple inequalities on the same Argand diagram?
To sketch a region that satisfies multiple inequalities, we need to find the intersection of all the regions (where all regions overlap)
E.g. the region satisfied by
can be found as follows…
Using diagonal lines in the same direction, lightly shade the region
(the outside of a circle of radius 2 about the origin)
Using diagonal lines in a different direction, lightly shade the region
(the inside of a circle of radius 5 about the origin)
Where the diagonal lines cross each other highlights the region satisfying both inequalities; this should be shaded boldly
E.g. the region satisfied by
and
can be found as follows…
Using diagonal lines in the same direction, lightly shade the region
(the side including
from the perpendicular bisector of the points
and 1)
Using diagonal lines in a different direction, lightly shade the region
(the wedge-shaped region from 0 to
radians from the origin)
Where the diagonal lines cross each other highlights the region satisfying both inequalities; this should be shaded boldly
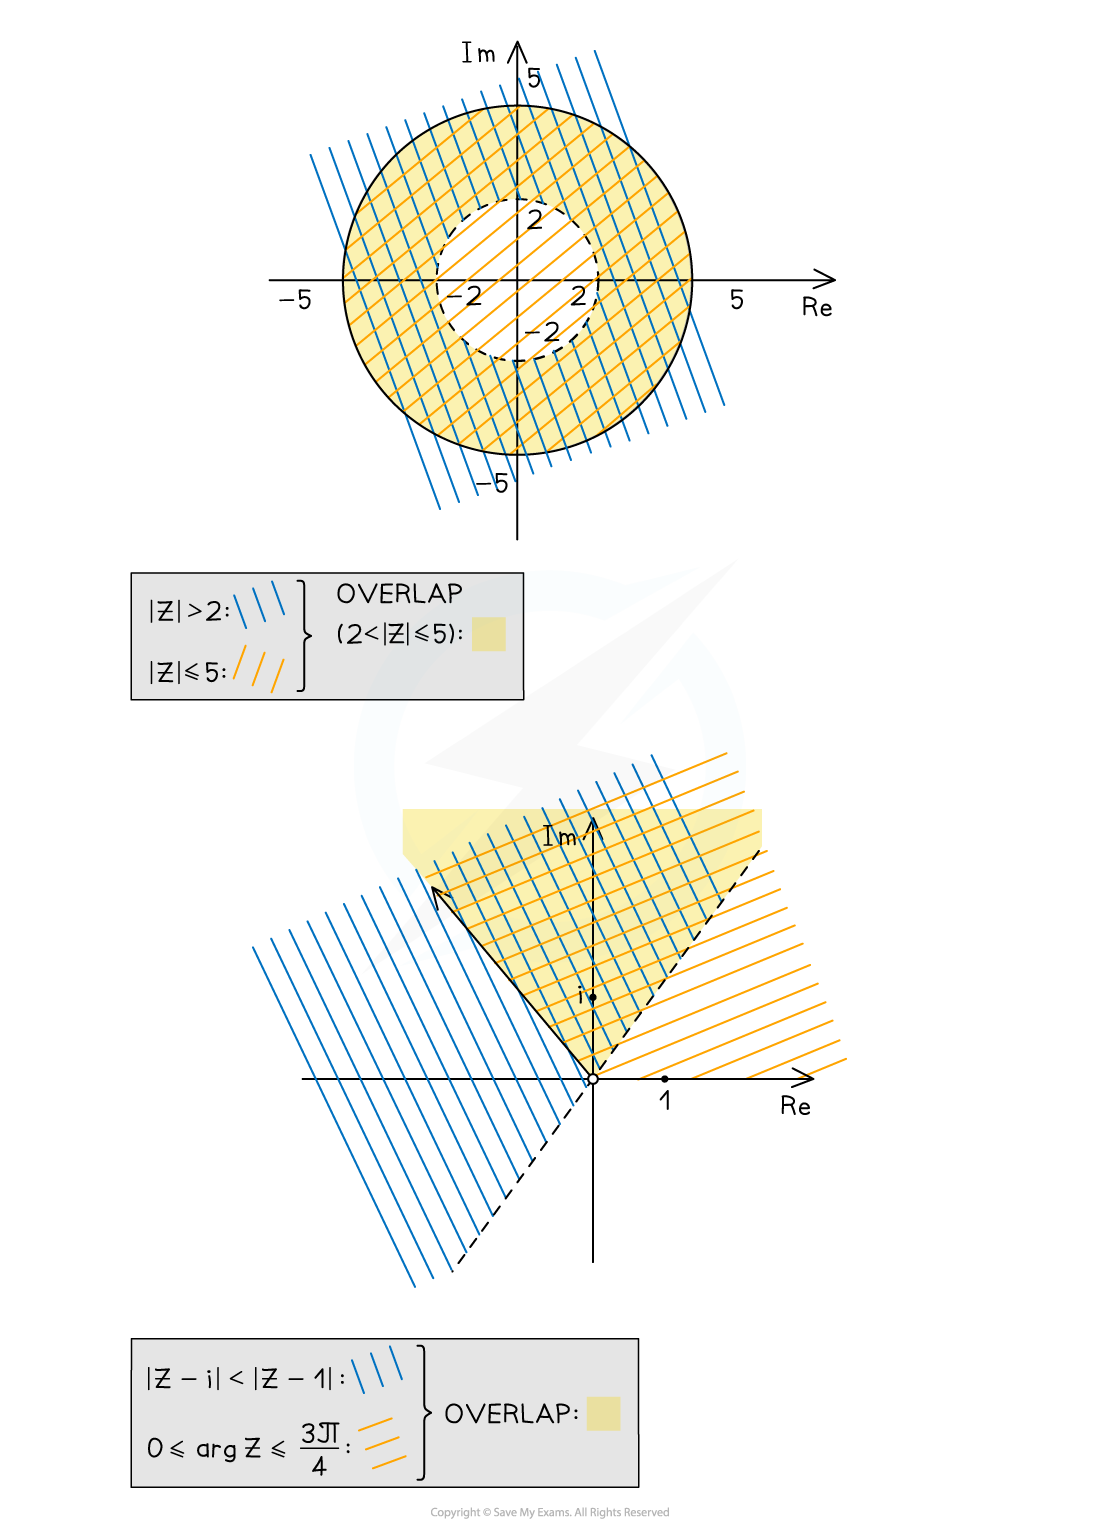
The inequalities on the left, the inequalities
and
on the right
How do I find the greatest (or least) values of format('truetype')%3Bfont-weight%3Anormal%3Bfont-style%3Anormal%3B%7D%3C%2Fstyle%3E%3C%2Fdefs%3E%3Ctext%20font-family%3D%22brack_sm47dfc8ff4929ef7202a7f1c%22%20font-size%3D%2222%22%20font-weight%3D%22bold%22%20text-anchor%3D%22start%22%20x%3D%221.5%22%20y%3D%229%22%3E%26%23xF402%3B%3C%2Ftext%3E%3Ctext%20font-family%3D%22brack_sm47dfc8ff4929ef7202a7f1c%22%20font-size%3D%2222%22%20font-weight%3D%22bold%22%20text-anchor%3D%22start%22%20x%3D%221.5%22%20y%3D%2216%22%3E%26%23xF402%3B%3C%2Ftext%3E%3Ctext%20font-family%3D%22brack_sm47dfc8ff4929ef7202a7f1c%22%20font-size%3D%2222%22%20font-weight%3D%22bold%22%20text-anchor%3D%22start%22%20x%3D%221.5%22%20y%3D%2223%22%3E%26%23xF402%3B%3C%2Ftext%3E%3Ctext%20font-family%3D%22Times%20New%20Roman%22%20font-size%3D%2222%22%20font-weight%3D%22bold%22%20text-anchor%3D%22middle%22%20x%3D%2213.5%22%20y%3D%2220%22%3Ez%3C%2Ftext%3E%3Ctext%20font-family%3D%22brack_sm47dfc8ff4929ef7202a7f1c%22%20font-size%3D%2222%22%20font-weight%3D%22bold%22%20text-anchor%3D%22start%22%20x%3D%2220.5%22%20y%3D%229%22%3E%26%23xF402%3B%3C%2Ftext%3E%3Ctext%20font-family%3D%22brack_sm47dfc8ff4929ef7202a7f1c%22%20font-size%3D%2222%22%20font-weight%3D%22bold%22%20text-anchor%3D%22start%22%20x%3D%2220.5%22%20y%3D%2216%22%3E%26%23xF402%3B%3C%2Ftext%3E%3Ctext%20font-family%3D%22brack_sm47dfc8ff4929ef7202a7f1c%22%20font-size%3D%2222%22%20font-weight%3D%22bold%22%20text-anchor%3D%22start%22%20x%3D%2220.5%22%20y%3D%2223%22%3E%26%23xF402%3B%3C%2Ftext%3E%3C%2Fsvg%3E) or
or  in a region?
Every complex number,
, that lies within a region on an Argand diagram will have its own modulus,
, that is measured from the origin
For any shaped region…
The least value of
is the distance from the origin to the nearest point in the region
The greatest value of
is the distance from the origin to the farthest point in the region
Sometimes the least value is zero (if the origin is in the region) and/or the greatest value is infinite (if the region is unbounded)
For circular regions that do not contain the origin…
Find the length from the origin to the centre of the circle…
then add a radius for the greatest value of
or subtract a radius for the least value of
Every complex number,
, that lies within a region on an Argand diagram will have its own argument,
, as measured from the origin
For any shaped region…
The least value of is
the smallest angle a line through the origin can make to a point in the region
The greatest value of
is the largest angle a line through the origin can make to a point in the region
For circular regions that do not contain the origin…
Find
, the argument of the centre…
Find
, the angle between a tangent to the circle through the origin and the line from the origin to the centre…
This can be done using trigonometry, as a radius meets a tangent at right angles
The greatest value of
is
and the least value of
is
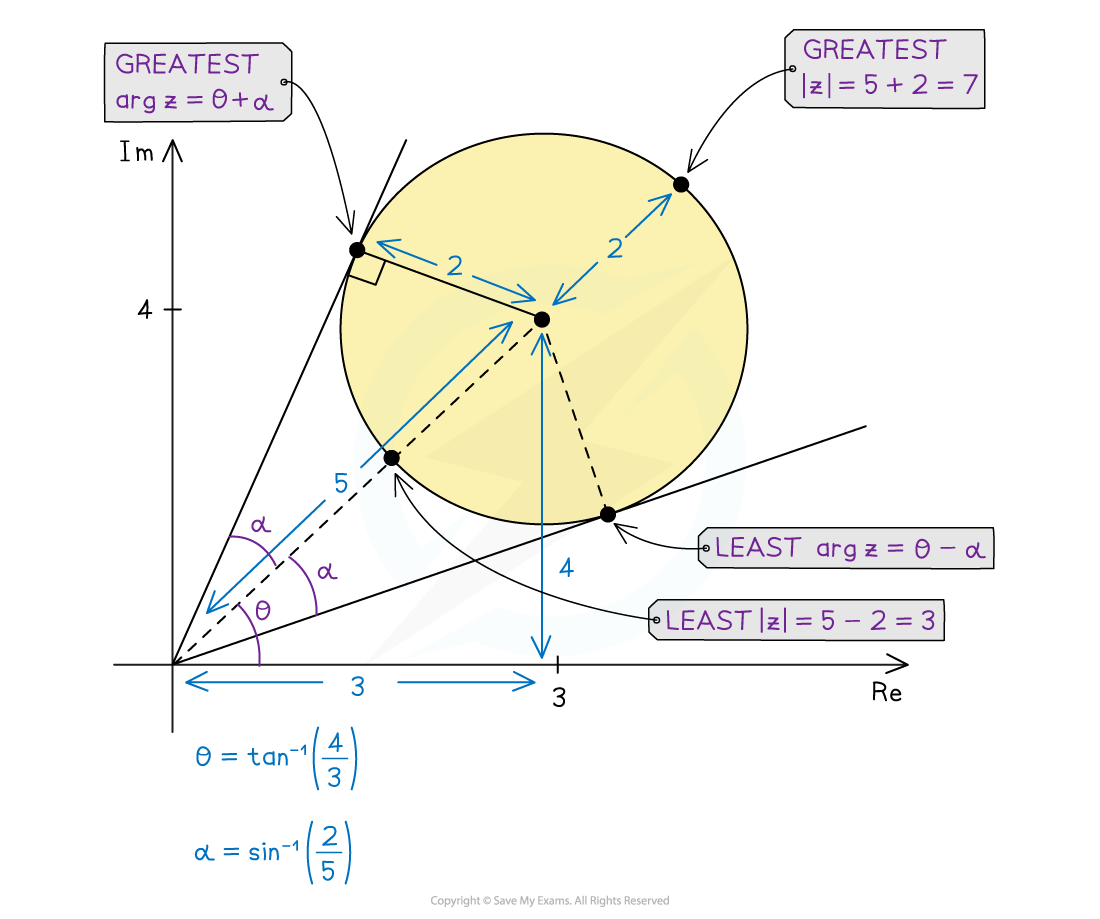
Find greatest and least values of and
Examiner Tips and Tricks
When shading an unbounded region in the exam, make sure you extend your shading outwards, crossing any axes where necessary.
When shading multiple inequalities to find a common region, lots of methods are accepted; these include lightly shading individual regions to see where they overlap, or starting to shade along the boundaries of individual regions to find the common region, or marking individual regions to find the region with multiple marks, etc.
Worked Example
a) On separate Argand diagrams, shade the region whose points represent complex numbers satisfying
(i) the inequality
(ii) both inequalities and
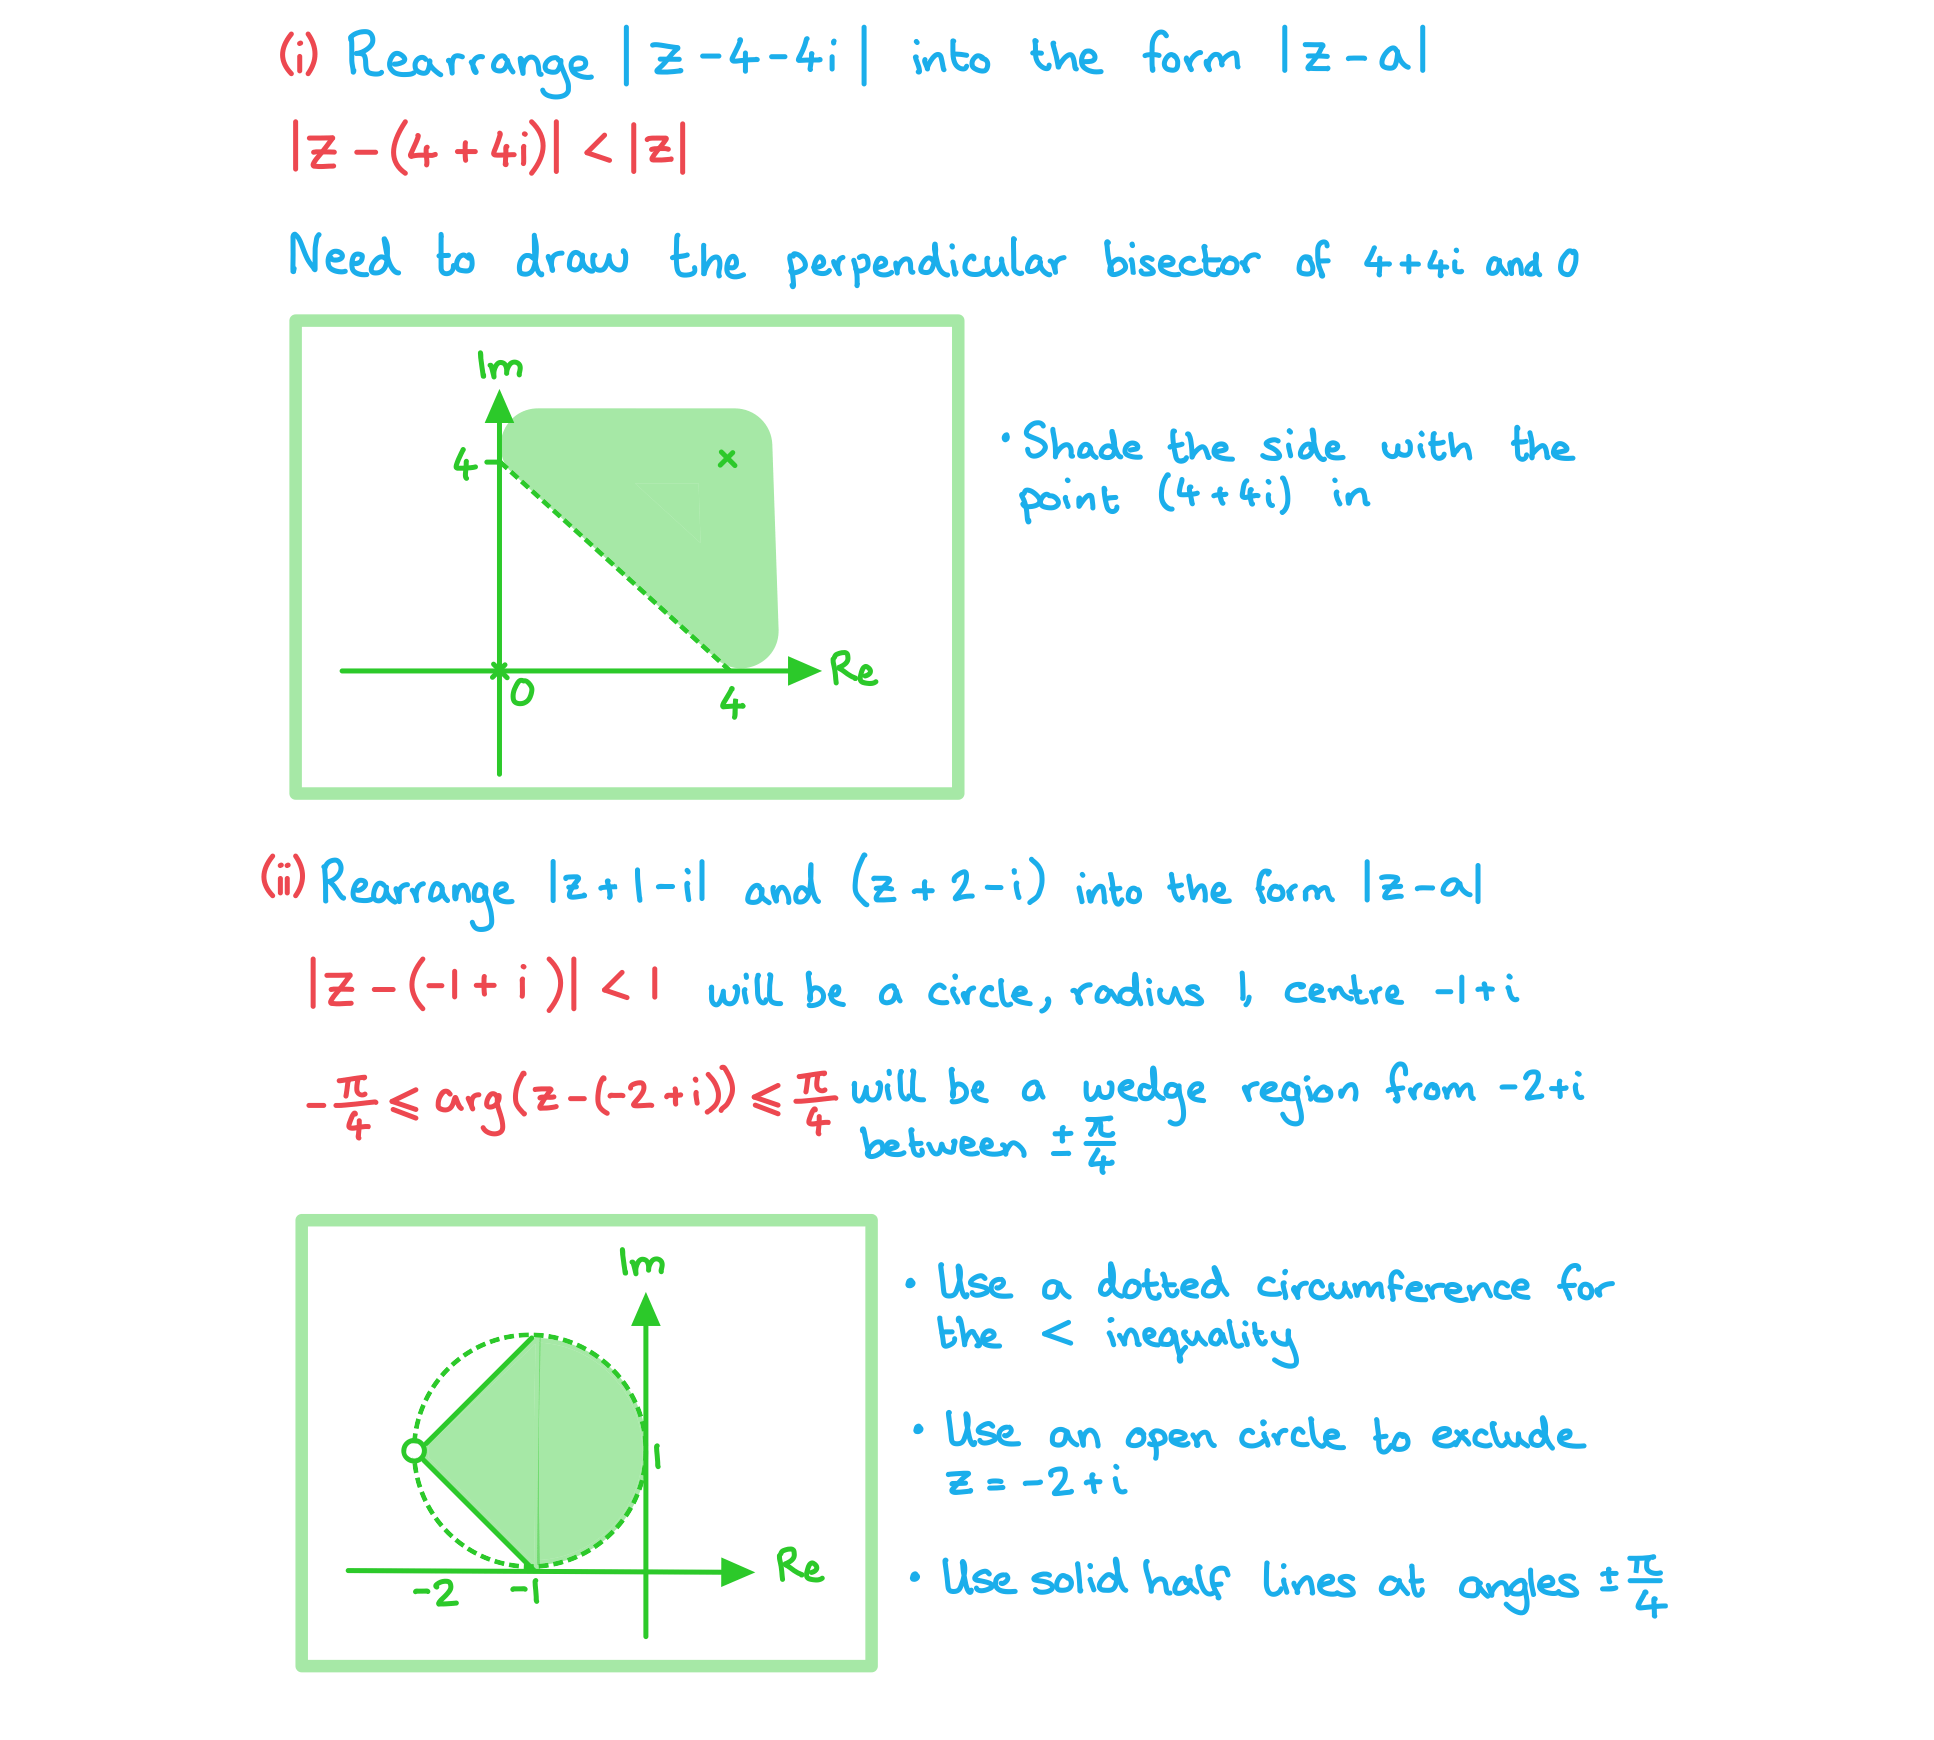
b) For complex numbers satisfying the inequality
, find
(i) the greatest value of
(ii) the least value of
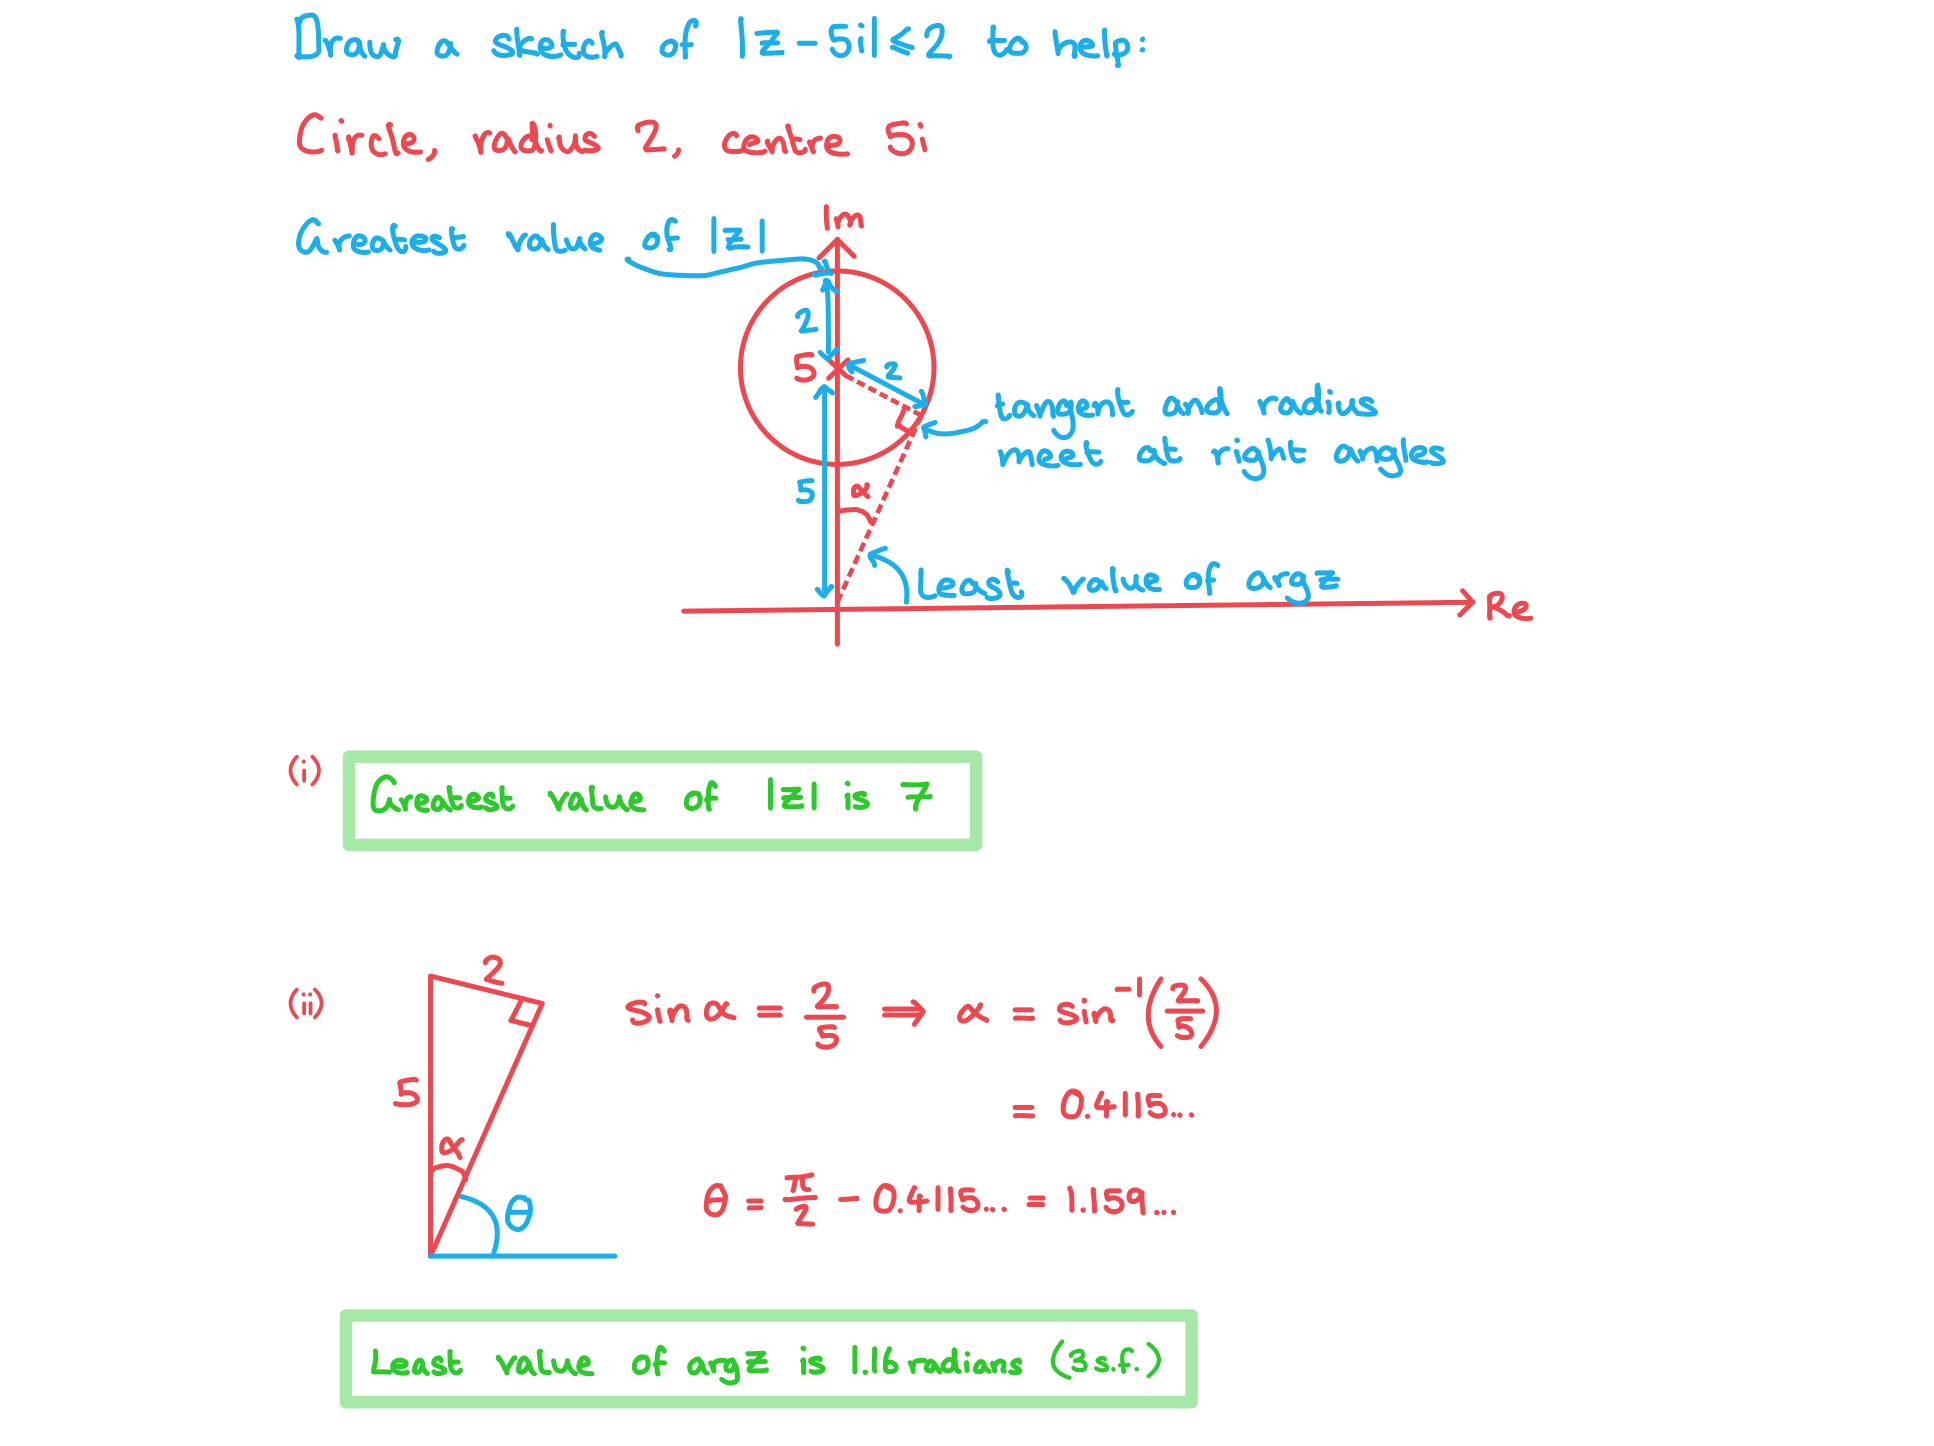

You've read 0 of your 5 free revision notes this week
Unlock more, it's free!
Did this page help you?
