Extract D
Rising debt levels in Africa
Increases in national debt have brought several African governments towards a debt-servicing crisis when the repayment of debt and interest become unsustainable. Between 2010 and 2015, many sub-Saharan countries raised debt totalling more than £20 billion. Back then, with commodity prices soaring and foreign loans available at very low interest rates, everyone agreed that borrowing was the way to grow an economy with expansionary fiscal policy. Since 2015, some African governments – beneficiaries of big debt write-offs at the start of the century – have taken to private debt markets too eagerly, leaving them with heavy repayment schedules at a time of lower commodity prices.
Until recently, the International Monetary Fund (IMF) has played down African debt concerns, pointing to better management of public resources and greater transparency. But it was shaken by Mozambique’s default on more than £2 billion of secret loans used to purchase a non-existent tuna-fishing fleet, raising fears of hidden debt in other African countries with similar levels of corruption. The median level of debt in sub-Saharan Africa 15 had risen sharply from 34% of gross domestic product in 2013 to 48% in 2017. Although that is low by international standards, analysts said debt burdens were heavier than they appeared because of most African countries’ low tax base. “The real thing to look for is debt to revenue, or debt-service as a percentage of government spending,” said John Ashbourne, Africa Economist at Capital Economics. In several countries, he said, debt payments were above 20% of government revenue, with an opportunity cost in terms of government spending.
(Source: adapted from African debt worries intensify as levels near tipping point by David Pilling © Financial Times 2017 https://www.ft.com)
Extract E
Mozambique’s economic stability is being put to the test
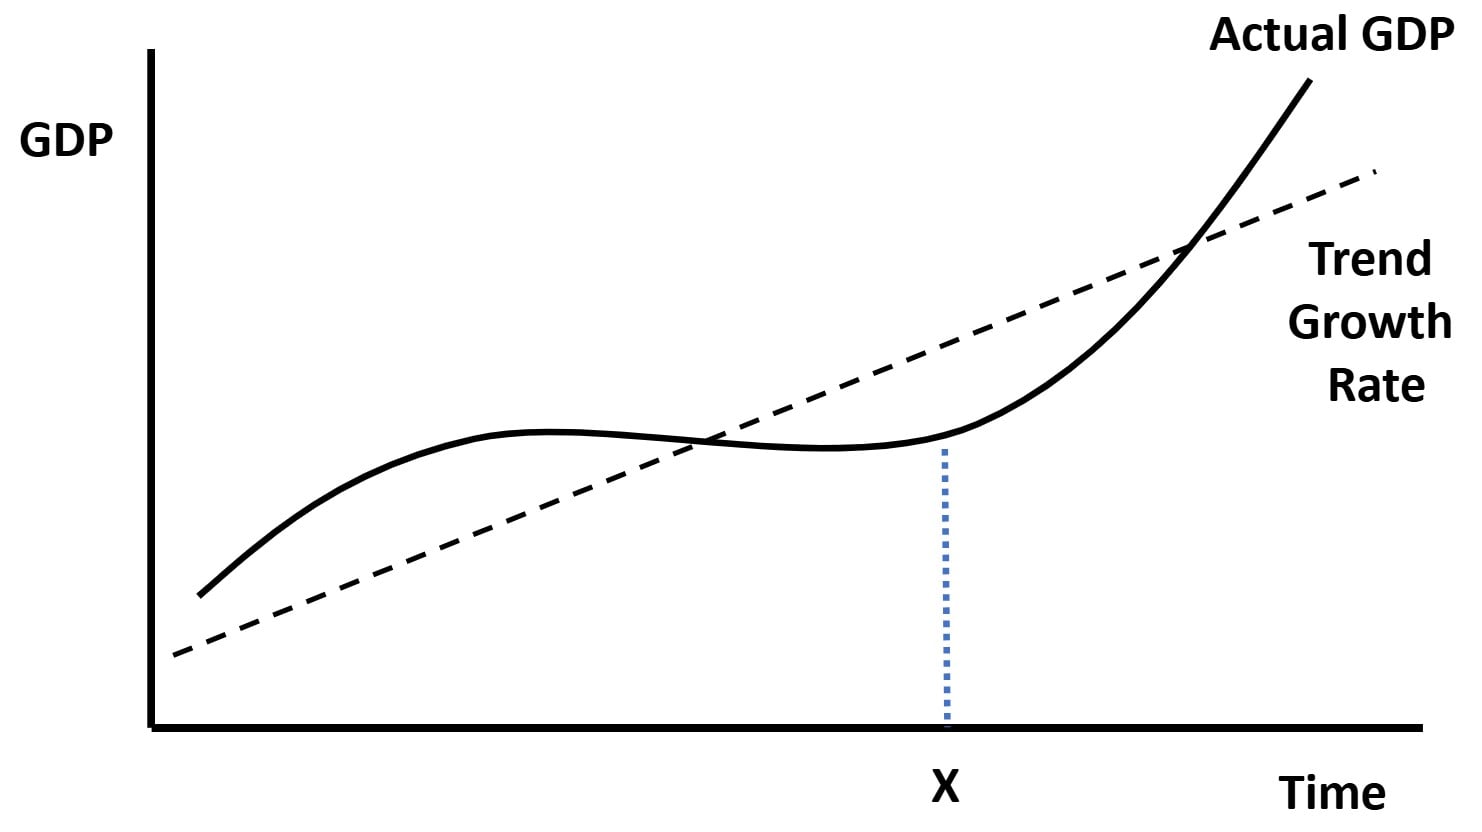
The economy of Mozambique, which gained independence from Portugal in 1975, has continued to under-perform. Large-scale emigration, especially of skilled workers, economic dependence on South Africa, a severe drought, a prolonged civil war and political tensions have hindered the country’s development. More than half of Mozambique’s 26 million people continue to live below the poverty line. GDP growth declined to 3.6% in 2016 due to fiscal tightening and a slowdown in foreign direct investment.
A weak manufacturing sector employs just 3.2% of the population, and is made up of small enterprises (90%), many of which were set up with the aid of microfinance. Traditional export earnings dropped due to depressed global demand. In addition a wide-scale drought seriously affected agricultural production. Foreign currency inflows have weakened – as large-scale gas projects were put on hold, and 14 external lenders suspended direct budget support, as a lesson to be learned from the tuna-fleet scandal. The state budget deficit was 10.7% of GDP in 2017.
High interest rates have reduced aggregate demand, and import costs added to inflation following further depreciation of Mozambique’s currency, the metical, to a new low of 100 meticals to £1. Mozambique needs urgently to improve its investment environment and confidence in its institutions. The World Economic Forum’s global competitiveness ranking placed Mozambique 136 out of 137 countries.
Longer term, Mozambique’s economic prospects are promising. There has been progress in talks on restoring international confidence in the government’s running of the economy, leading to a lasting and sustainable agreement between rival political groups. The development of gas fields off Mozambique’s coast discovered in 2011 is set to transform the economy, coming into production in the 2020s. A rise in coal and electricity exports should help growth to increase. But in the short term, it remains uncertain whether Mozambique can deliver badly needed economic stability.
Extract F
Microfinance in Mozambique
Microfinance in Mozambique started in the late 1980s through projects initiated by international relief organisations. The sector has expanded to include many private banks and non-government organisations (NGOs), see Figure 3. This has resulted in wider use (over 100000 borrowers) and many new business start-ups which could not have gained finance from any other source. Evidence suggests that there is unfulfilled demand for microfinance and a large potential for expansion.
(Source: adapted from http://www.mftransparency.org/microfinance-pricing/mozambique/)