Revenue (Edexcel A Level Economics A): Revision Note
Exam code: 9EC0
Total, Average & Marginal Revenue
Total revenue is the total value of all sales a firm incurs
Average revenue is the overall revenue per unit
Marginal revenue is the extra revenue received from the sale of an additional unit of output
The relationship between TR, AR & MR is different in perfect competition and imperfect competition
Perfect competition
The Relationship Between TR, AR and MR In Perfect Competition Can Be Seen Numerically Below
P (£) | Q | TR | AR | MR |
|---|---|---|---|---|
8 | 5 | 40 | 8 | 8 |
8 | 6 | 48 | 8 | 8 |
8 | 7 | 56 | 8 | 8 |
8 | 8 | 64 | 8 | 8 |
The situation in the table above is illustrated in the diagram below

Observations
The firm is a price taker at P1 (£8)
Every unit of output is sold at the same price
A higher price would decrease sales to zero
A lower price would result in all sellers lowering their price
Demand for the firm's product is therefore perfectly price elastic
TR increases at a constant rate
MR = AR = Demand
Imperfect competition
The Relationship Between TR, AR & MR For Imperfect Competition Can Be Seen Numerically Below
P (£) | Q | TR | AR | MR |
|---|---|---|---|---|
8 | 1 | 8 | 8 | 8 |
7 | 2 | 14 | 7 | 6 |
6 | 3 | 18 | 6 | 4 |
5 | 4 | 20 | 5 | 2 |
4 | 5 | 20 | 4 | 0 |
3 | 6 | 18 | 3 | -2 |
2 | 7 | 14 | 2 | -4 |
1 | 8 | 8 | 1 | -6 |
The situation in the table above is illustrated in the diagram below

Observations
The firm is a price maker
In order to sell an additional unit of output, the price (AR) must be lowered
Both AR & MR fall with additional units of sale
When the AR falls, the MR falls by twice as much
The gradient of the MR curve is twice as steep as the AR curve
TR is maximised when MR = 0
AR is the demand (D) curve
When MR = 0, then the price elasticity of demand (PED) = 1
This is unitary elasticity
PED & Total Revenue
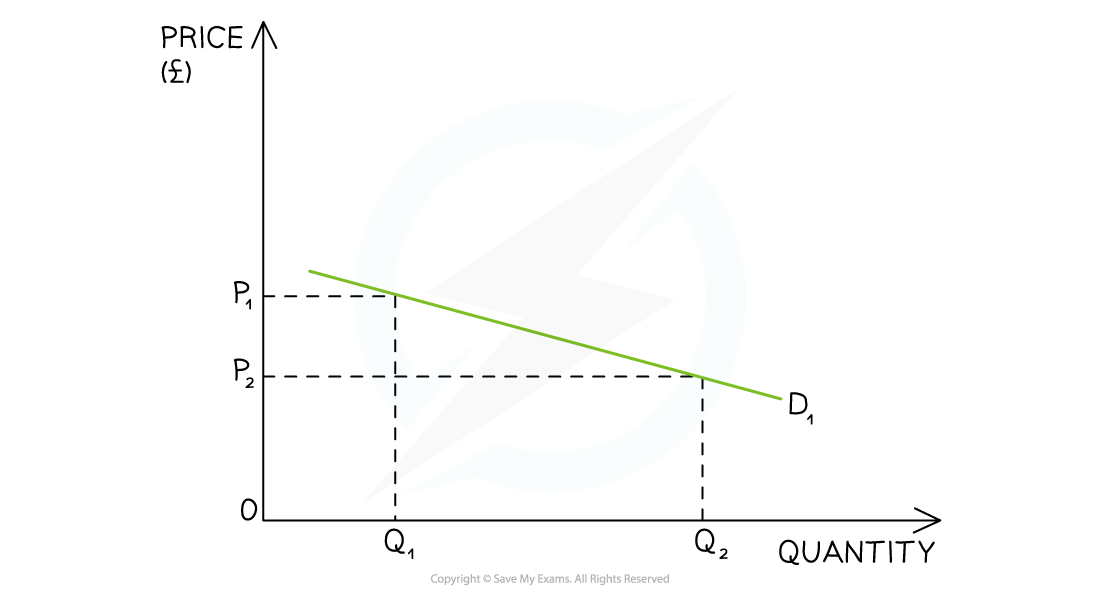
The total revenue rule states that in order to maximise revenue, firms should increase the price of products that are inelastic in demand and decrease prices on products that are elastic in demand
This can be illustrated using an average revenue (AR) curve which is the demand curve

Observations
When a good/service is price elastic in demand, there is a greater proportional increase in the quantity demanded to a decrease in price
TR is higher once the price has been decreased

Observations
When a good/service is price inelastic in demand, there is a smaller than proportional decrease in the quantity demanded to an increase in price
TR is higher once the price has been increased

You've read 0 of your 5 free revision notes this week
Unlock more, it's free!
Did this page help you?