Fiscal & Supply-side Policies (AQA A Level Economics)

Exam Questions

3 hours22 questions
1
Sme Calculator
25 marks

Extract B: Unemployment and real wages According to a recent study on wage growth, the youngest worker today would need to wait nearly 80 years to see the average real wage in the UK double from its current level. At just 4.2%, unemployment in the UK is at its lowest level in decades. It should be the best of times, but data from the Office for National Statistics (ONS) show that the percentage of people who are ‘underemployed’, often working on zero-hours contracts, is greater than it was during the financial crisis of 2007–08. Some claim this is the true cause of poor real wage growth.

Supply-side reforms to labour markets are meant to boost productivity but can be damaging for some workers. Unregulated labour markets can lead to inequality and poor pay, which also reduces government tax revenue. Workers who are only temporarily employed can experience a lack of stability and firms may have little incentive to invest in human capital. Consequently, these workers may not get the opportunity to develop new skills. Firms may also face higher costs from replacing workers who leave because they feel undervalued.

It can be argued that supply-side reforms have gone too far in creating a highly flexible workforce and the government needs to do more in terms of protecting the nation’s workers. There are calls for some restoration of trade union powers, more rights for workers on zero-hours contracts and measures to raise pay to ensure that workers feel the benefits of employment.

Source: News reports, 2018

Extract B (lines 13–14) states: ‘It can be argued that supply-side reforms have gone too far in creating a highly flexible workforce and the government needs to do more in terms of protecting the nation’s workers’.

Using the data in the extracts and your knowledge of economics, evaluate the view that free market supply-side reforms to labour markets are beneficial to the UK economy.

Did this page help you?

2
Sme Calculator
15 marks

In 2017, the UK’s annual budget deficit was 2.3% of GDP, the lowest level since 2001. In 2017, the UK’s deficit on the current account of the balance of payments fell to 3.3% of GDP, the lowest level since 2011. Explain the possible causes of a falling budget deficit.

Did this page help you?

3
Sme Calculator
1 mark

All other things being equal, which one of the following is most likely to increase the national debt?

  • Foreign companies increasing their direct investment into the economy

  • The central bank using its reserves of foreign currency to fund a trade deficit

  • The government reducing its budget surplus by increasing its expenditure on infrastructure

  • The government running a budget deficit, financed by selling bonds to foreign investors

Did this page help you?

4
Sme Calculator
1 mark

Which one of the following is correct for a proportional tax on income?

  • The amount of tax paid increases as income increases.

  • The marginal rate of tax is lower than the average rate

  • The average rate of tax falls as income increases

  • The average rate of tax is lower than the marginal rate

Did this page help you?

5
Sme Calculator
2 marks

Extract D

extract-d-paper-2-june-2019-aqa-a-level-economics


Using the data in Extract D (Figure 3), calculate, to the nearest pound, the amount of income tax payable for someone in Scotland earning £13 500.

Did this page help you?

6
Sme Calculator
4 marks

Extract D

extract-d-paper-2-june-2019-aqa-a-level-economics

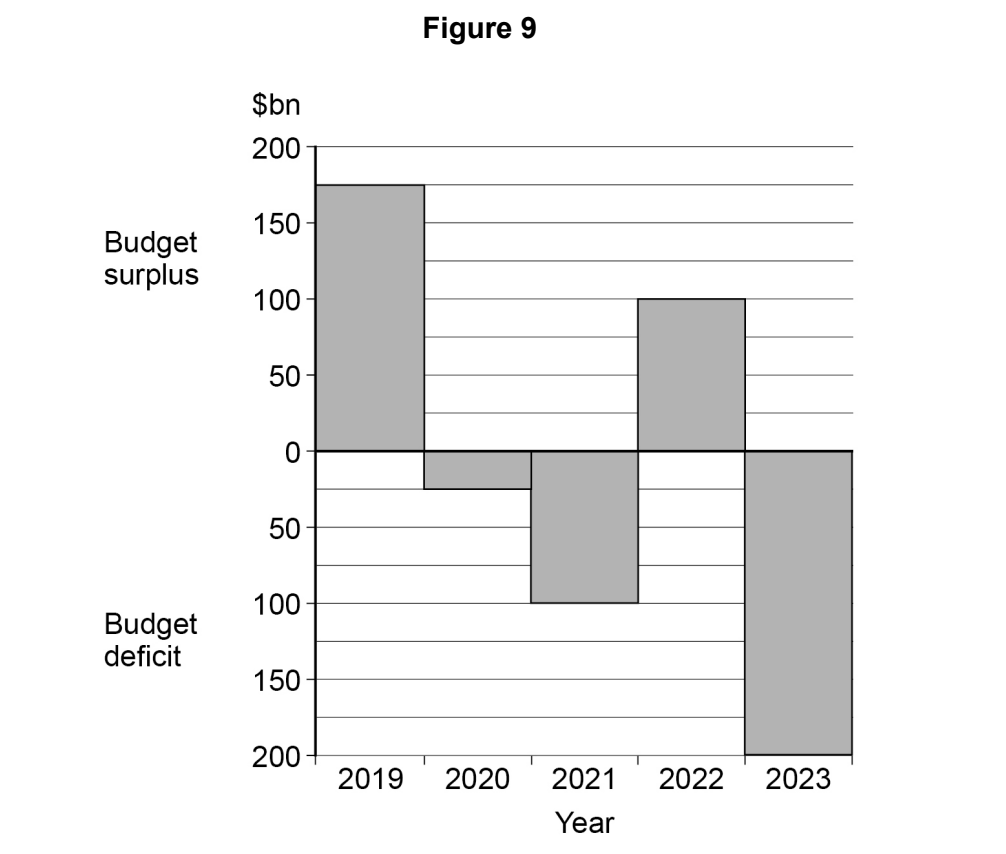
Explain how the data in Extract D (Figure 2) show that the UK’s public finances have been improving since 2010.

Did this page help you?

7
Sme Calculator
25 marks

Extract F: Scottish income tax

In most of the UK, reducing the budget deficit has focused on austerity rather than tax rises. However, the Scottish Government has announced that from April 2018, Scotland will have different rates of income tax to the rest of the UK, with changes that will see higher earners pay more and lower earners pay less. There will be a new tax band of 21% for those earning more than £24 000. The higher rate of tax will be increased from 40% to 41% and the top rate from 45% to 46%. A starter rate of 19% will also be introduced. The move to a ‘five-band’ income tax system should mean that nobody earning less than £33 000 in Scotland will pay more tax than they do now.

Estimates show that 55% of Scottish taxpayers will pay less compared to the rest of the UK under the new system, with higher earners paying more. Someone in Scotland earning £150 000 will pay £1774 more than if they lived elsewhere in the UK, with someone earning £40 000 paying £140 more. The extra revenue raised will be used to give public sector workers a 3% pay rise for those earning less than £30 000, and a 2% rise for those earning more than that, and will help towards the cost of providing superfast broadband to all premises in Scotland by 2021.

Some business leaders have warned that Scotland cannot afford to be associated with higher taxation than the rest of the UK. The Finance Minister for Scotland, Derek Mackay, claimed the changes could raise an additional £164 million and were necessary to “mitigate UK budget cuts, protect our NHS and other public services, support our economy and tackle inequality in our society”. He said the tax reforms would make “Scotland's income tax system even fairer and more progressive”. He resisted a bigger increase in the top rate of tax for those earning more than £150 000, aware that high earners may find ways to avoid paying it.

Source: News reports, 2017

Extract F (line 1) states ‘In most of the UK, reducing the budget deficit has focused on austerity rather than tax rises.’ Using the data in the extracts and your knowledge of economics, evaluate the view that there is a strong case for significant increases in UK income tax rates.

Did this page help you?

8
Sme Calculator
1 mark

The diagram below shows the aggregate demand (AD) curve, the short-run aggregate supply (SRAS) curve and the long-run aggregate supply (LRAS) curve for an economy. The economy’s initial equilibrium is at E1.

q10-paper-3-june-2019-aqa-a-level-economics

The government wants to achieve economic growth without conflicting with its long-run objective of price stability. All other things being equal, which one of the following policy combinations is most likely to enable the economy to achieve a new long-run equilibrium at E2?

  • A reduction in interest rates and increased government borrowing.

  • A reduction in the budget deficit and the rate of growth of the money supply.

  • Increased government expenditure on apprenticeships and transport infrastructure funded through borrowing.

  • Increased government expenditure on welfare funded through higher indirect taxes.

Did this page help you?

9
Sme Calculator
1 mark

The table below shows different combinations of changes in the rate of interest and the government’s budget position. The economy has a negative output gap. All other things being equal, which one of the combinations of policies, A, B, C or D, is most likely to reduce the economy’s negative output gap? 


Rate of interest

Government’s budget position

A

Increase

Decrease in surplus

B

Decrease

Increase in surplus

C

Increase

Decrease in deficit

D

Decrease

Increase in deficit

    Did this page help you?

    10
    Sme Calculator
    1 mark

    The marginal propensity to consume (MPC) in an economy is 0.5. If the MPC increases by 20% the new value of its multiplier will be

    • 2.0

    • 2.5

    • 5.0

    • 10.0

    Did this page help you?

    11
    Sme Calculator
    25 marks

    Refer Insert

    After considering Extract E, and the original evidence in Extracts A, B, C and D, would you recommend that the Government should increase its spending on housing? Justify your recommendation

    Did this page help you?

    12
    Sme Calculator
    15 marks

    In the 2016 Autumn statement, the UK Chancellor of the Exchequer, Philip Hammond, officially abandoned the government’s policy of trying to achieve a budget surplus by 2020. While some criticise the government for failing to achieve its fiscal target, others argue that the government should be doing more to help the supply side of the economy.

    Explain how fiscal policy can be used to try to improve the supply side of an economy.

    Did this page help you?

    13
    Sme Calculator
    25 marks

    In the 2016 Autumn statement, the UK Chancellor of the Exchequer, Philip Hammond, officially abandoned the government’s policy of trying to achieve a budget surplus by 2020. While some criticise the government for failing to achieve its fiscal target, others argue that the government should be doing more to help the supply side of the economy.

    Evaluate whether achieving a budget surplus is a desirable objective of economic policy.

    Did this page help you?

    14
    Sme Calculator
    1 mark

    At the start of the financial year, an economy’s national debt stands at £1000 billion. Over the course of the year, the government plans to spend an extra £100 billion and borrow an extra £40 billion.

    If the government achieves its spending and borrowing targets, by the end of the financial year the national debt will have increased by

    • 4%

    • 10%

    • 14%

    • 40%

    Did this page help you?

    15
    Sme Calculator
    1 mark

    All other things being equal, an increase in the ratio of capital to labour resulting from an increase in investment is most likely to lead to a

    • decline in labour productivity

    • fall in the size of the labour force

    • negative demand-side shock to the economy

    • supply-side improvement

    Did this page help you?

    16
    Sme Calculator
    1 mark

    Which one of the following is most likely to cause an increase in the structural budget deficit?

    • A fall in income tax receipts in the downturn of the economic cycle

    • A rise in government spending on unemployment-related benefits during a recession

    • A rise in healthcare expenditure and state pension provision due to an ageing population

    • A rise in spending on imports during an economic recovery

    Did this page help you?

    17
    Sme Calculator
    4 marks

    Extract E: Good and bad deflation

    Deflation is bad when it is the result of falling aggregate demand. Consumers buy fewer goods and services and firms cut prices whilst consumption and investment decisions are delayed. This can lead to worsening company profits, cost cutting and job losses. Less spending damages economic growth and could lead to a deflationary spiral. However, this has not been the UK’s recent experience. A glut in the supply of oil has driven down its price. This has had a positive effect on most businesses who face lower costs. In the retail sector, in particular, prices are lower because goods are cheaper to manufacture and transport. Businesses can also spend more on investment, hiring staff or offering pay rises. This has led to pay growth and productivity gains in the private sector after years of stagnation. Improvements in productivity on the supply side of the economy could actually lead to more deflation but this could be viewed as good deflation.

    Professor Steve Keen believes even mild deflation is bad news. If the government continues with its programme of austerity, he is convinced the UK is heading for bad deflation. “Deflation is only benign, or even beneficial, in a world in which no one has any debt. Bizarrely, this is the world that conventional economists actually imagine we live in, since their models have ignored debt. Deflation increases the burden of people’s debt, which is what happened in the 1930s, during the Great Depression.”

    The most immediate implication of continued deflation is that it makes a rise in interest rates less likely and, in the short term, this is good news for borrowers, but not for savers. This should also allow more time for the economy to recover, with low interest rates helping consumers and firms to access cheaper credit.

    Source: News reports, 2016

    Extract E (lines 9–10) states ‘Improvements in productivity on the supply side of the economy could actually lead to more deflation.’

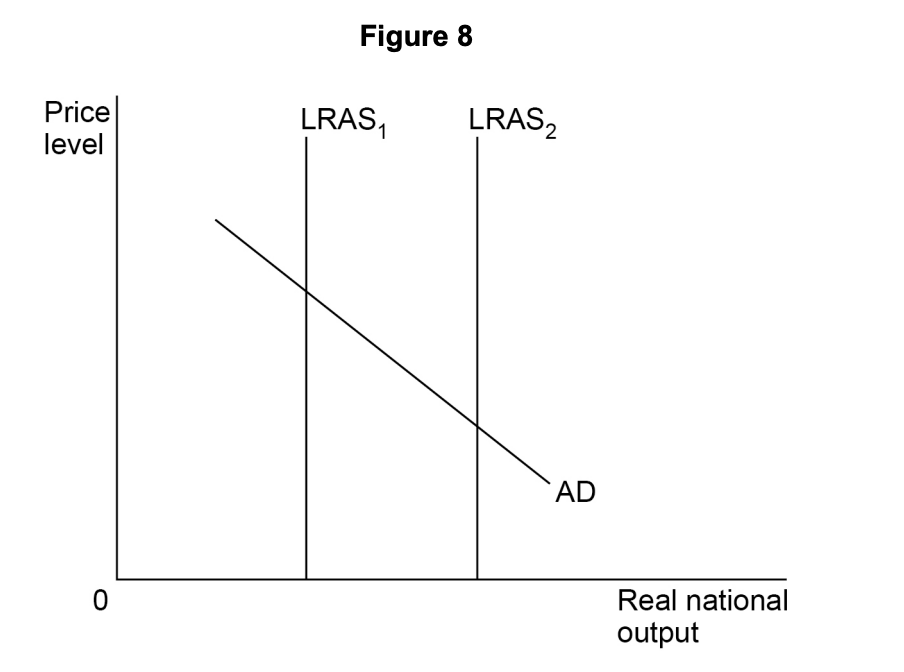
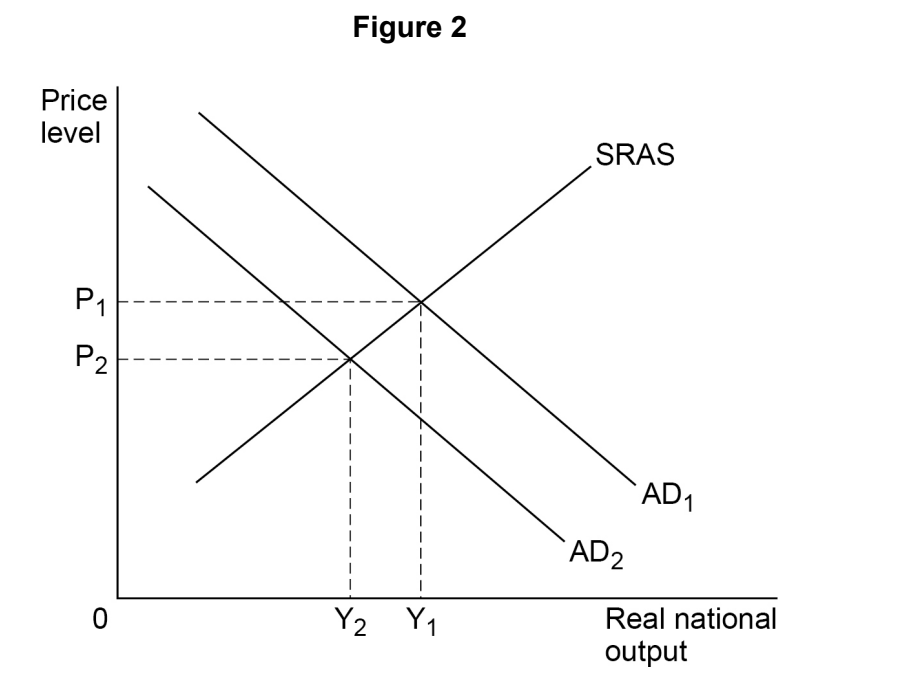
    With the help of a diagram, explain how improvements in productivity could cause deflation.

    Did this page help you?

    18
    Sme Calculator
    15 marks

    Between 2011 and 2016, UK unemployment fell from a high of 8.5% to 4.8%. Some argue that government attempts to reduce unemployment inevitably lead to trade-offs with other macroeconomic policy objectives.

    Explain how government policies can reduce the natural rate of unemployment.

    Did this page help you?

    19
    Sme Calculator
    15 marks

    The Government has ruled out the possibility of a rise in VAT before 2020 but other indirect taxes may increase. It has also stated that the personal income tax allowance will be increased from £10 800 in 2015/16 to £12 500 by 2020, and plans to cut the main rate of corporation tax from 20% to 17%.

    Explain how changes in both government spending and taxation might affect the level of economic activity.

    Did this page help you?

    20
    Sme Calculator
    25 marks

    The Government has ruled out the possibility of a rise in VAT before 2020 but other indirect taxes may increase. It has also stated that the personal income tax allowance will be increased from £10 800 in 2015/16 to £12 500 by 2020, and plans to cut the main rate of corporation tax from 20% to 17%.

    Evaluate the economic consequences for the UK economy of a significant shift in the burden of taxation from direct taxes to indirect taxes.

    Did this page help you?

    21
    Sme Calculator
    1 mark

    The table below shows the marginal income tax rates in an economy for 2016.

    Table: Marginal income tax rates for every $1 of income

    Taxable Income

    Income tax rates 2016

    From $0 to $10 000

    0%

    From $10 001 to $30 000

    10%

    From $30 001 to $50 000

    30%

    $50 001 and above

    45%

    How much income tax would be payable by someone earning $40 000 in 2016?

    • $5 000

    • $5 500

    • $10 000

    • $12 000

    Did this page help you?

    22
    Sme Calculator
    1 mark

    The national debt is the

    • annual budget deficit plus the external trade deficit

    • amount by which the budget deficit increases each year

    • annual difference between government spending and tax receipts

    • the cumulative stock of outstanding central government borrowing

    Did this page help you?