Extract E: In-work poverty is on the rise in the UK
Approximately 14 million people are in poverty in the UK, more than one in five of the population, including 4 million children and 2 million pensioners, up by 400 000 and 300 000 respectively over the past five years. A family is classified as being in poverty if it has an income, after housing costs, of less than 60% of the median income for their family type. A family’s income includes earnings from employment, self-employment and state benefits.
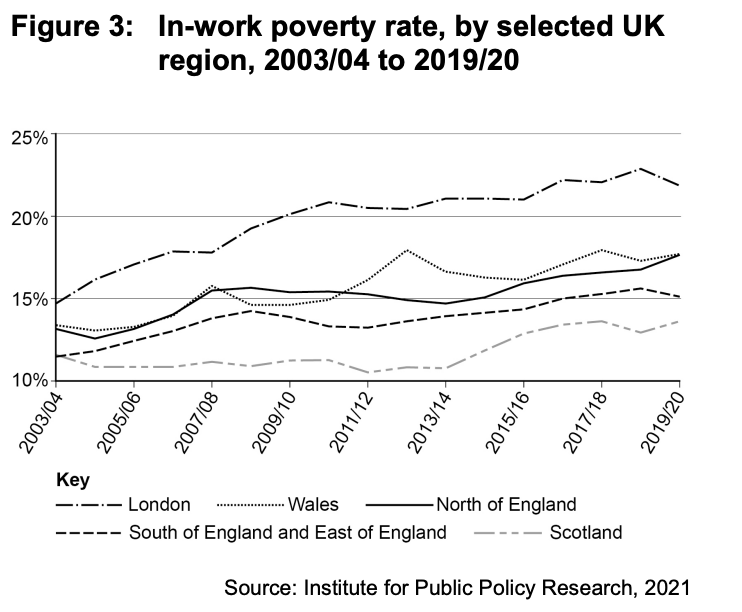
For generations, politicians in the UK have highlighted the important role of employment in tackling poverty. However, employment is no longer a strong defence against poverty. The Joseph Rowntree Foundation, an anti-poverty group, said that while paid employment does reduce the risk of poverty, about 56% of people living in poverty in 2018 were in working households, compared with 39% 20 years ago. Seven in 10 children in poverty are now in a working household, and such in-work poverty is particularly common amongst single-parent families. Working single parents accounted for three in 10 households in poverty in 2018, compared with two in 10 in 2011. Working poverty among single-earning couple households also rose dramatically, increasing from 19% in 2003–04 to 31% last year, meaning this group now experiences poverty rates almost as high as those households where no one works full time.
Amid concerns that the poorest receive worse healthcare and have the most insecure jobs, the Government faces a huge task if it is to ‘level up’ incomes across the UK by narrowing the gap between the wealthiest and poorest regions. Some out-of-work benefits have not kept up with inflation, putting downward pressure on wages, contributing to the rise in in-work poverty. Other factors include rising prices of energy, essential groceries and rented properties. Source: News reports, 2021