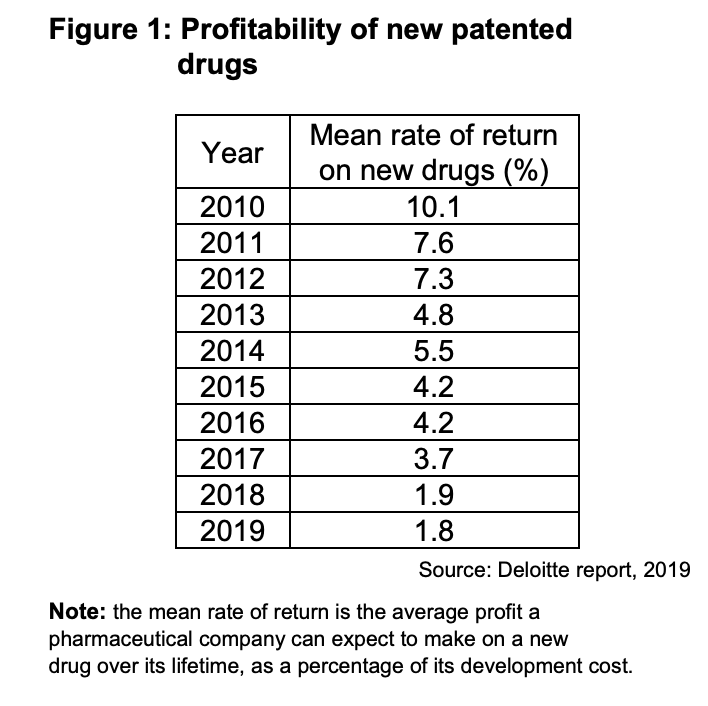
Explain the role of profit in a market economy
Case Study
In the United States, corporate profits since 2010 have averaged 9% of GDP, compared to 5% in the 1990s. This is causing concern that the US economy is increasingly dominated by companies with monopoly power
Was this exam question helpful?
