1
4 marks
Explain how the data in Extract A (Figures 1 and 2) show that expansion in the global sand market is leading to prices of construction sand rising in real terms
Case Study

Was this exam question helpful?
Exam code: 7136
Explain how the data in Extract A (Figures 1 and 2) show that expansion in the global sand market is leading to prices of construction sand rising in real terms
Was this exam question helpful?
Using the data in Extract A (Figure 1), calculate the percentage change in the price of construction sand between January 2014 and January 2018. Give your answer correct to one decimal place

Was this exam question helpful?
Using the data in Extract D (Figure 3), calculate the amount of government funding per £ of passenger income in the UK rail industry for the year 2015–16. Give your answer correct to the nearest penny

Was this exam question helpful?
Explain how the data in Extract D (Figure 4) show that in the UK, between 2004 and 2017, changes in the demand for rail travel contributed to changes in the price of rail travel

Was this exam question helpful?
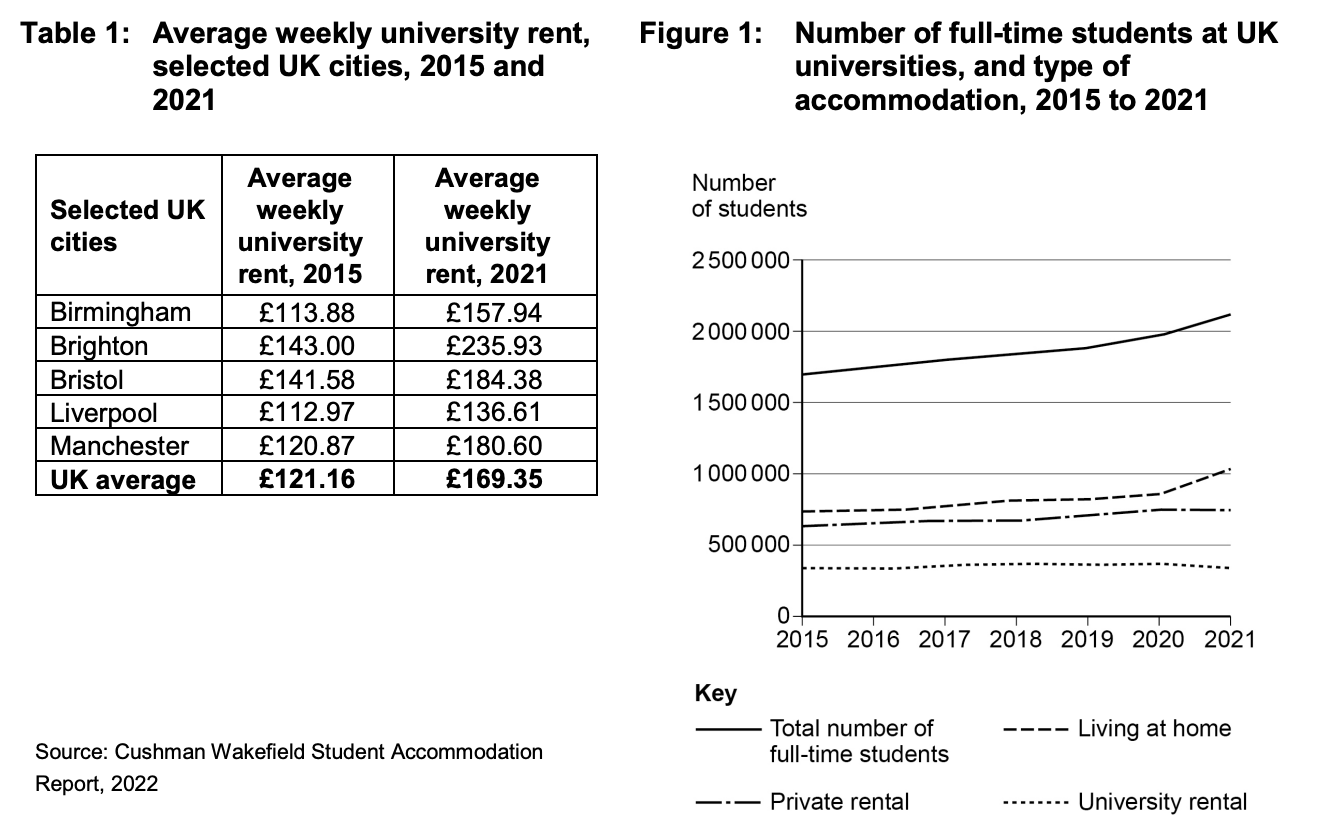
Explain how the data in Extract A (Figure 1 and Table 1) show that the supply of university and private rental accommodation has failed to match the increase in student numbers between 2015 and 2021.
Extract A
Was this exam question helpful?
Extract B (lines 3–4) states that ‘Universities have expanded the number of places on offer to students, but the supply of student accommodation is highly inelastic’.
With the help of a diagram, explain the impact of the increase in the number of students attending university on the market for student accommodation.
Extract B: A serious shortage of student accommodation
The number of 18-year-olds in the UK applying to university is rising. In addition, there was a record number of 277 000 foreign students in 2022.
Universities have expanded the number of places on offer to students, but the supply of student accommodation is highly inelastic. Providers of rental accommodation have been deterred by stricter rules on shared houses, higher taxes and greater rights for renters. Rising construction costs, interest rates and inflation have resulted in an insufficient number of new developments in many university cities. Supply shortages have been particularly acute in some cities, and certain universities have asked students to live at home.
Shortages of accommodation could mean that some students are discouraged from applying to university. The average private sector rent outside London consumes almost three-quarters of the maximum student loan, and most students are ineligible for this maximum. Some of the top universities may become out of reach to poorer students who do not live locally.
Was this exam question helpful?
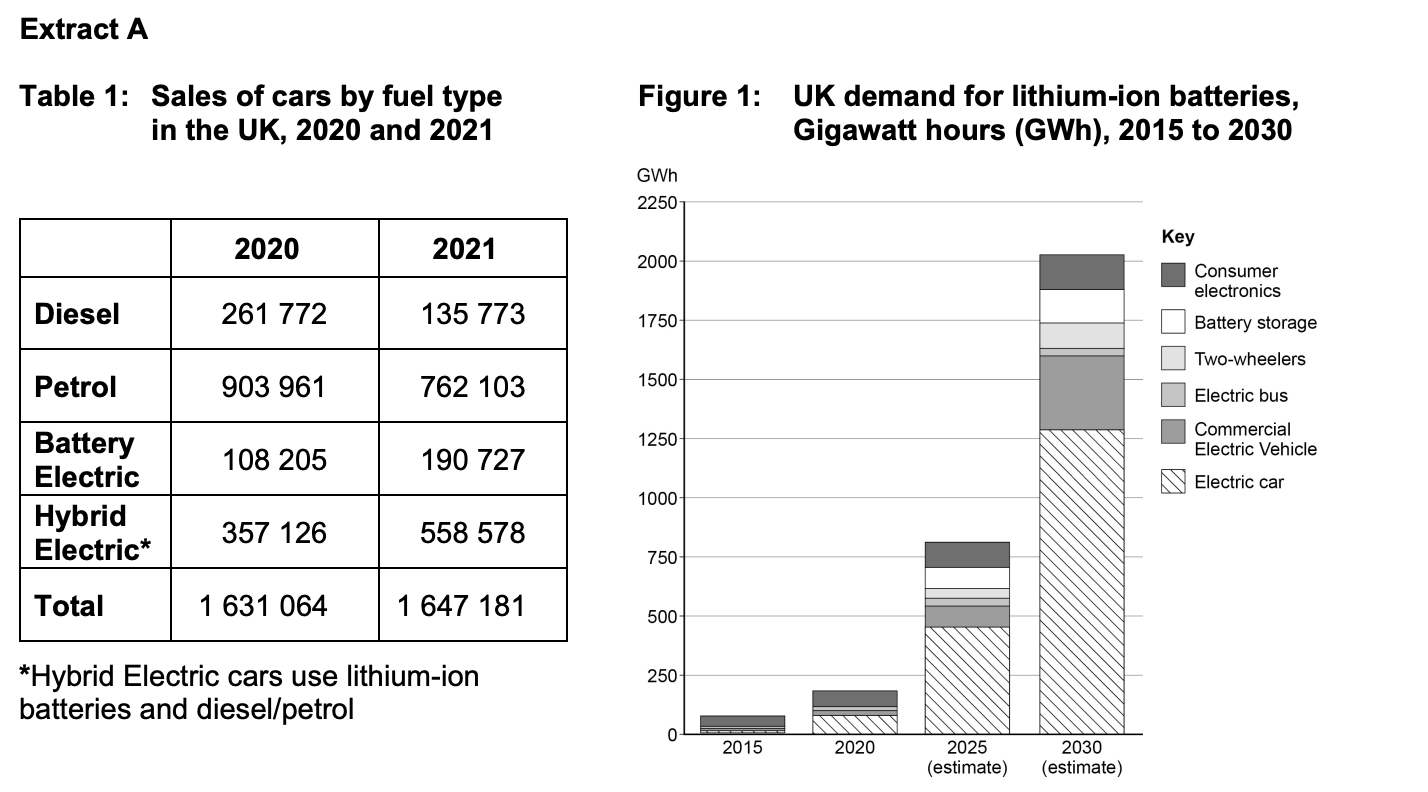
Explain how the data in Extract A (Table 1 and Figure 1) show that developments in the car market are the main reason for the changing demand for lithium-ion batteries in the UK.
Was this exam question helpful?
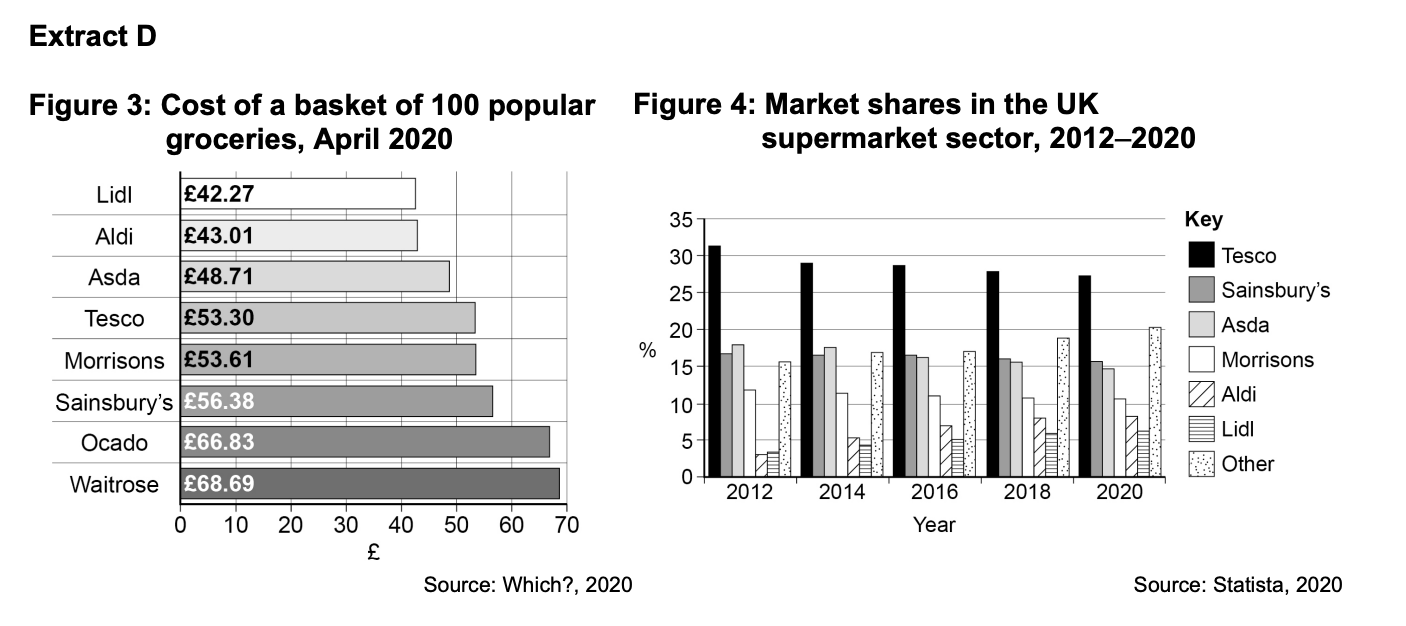
Using the data in Extract D (Figure 3), calculate, in percentage terms, how much more expensive a basket of groceries at Waitrose was than at Lidl in April 2020.
Give your answer as a percentage to two decimal places.
Was this exam question helpful?
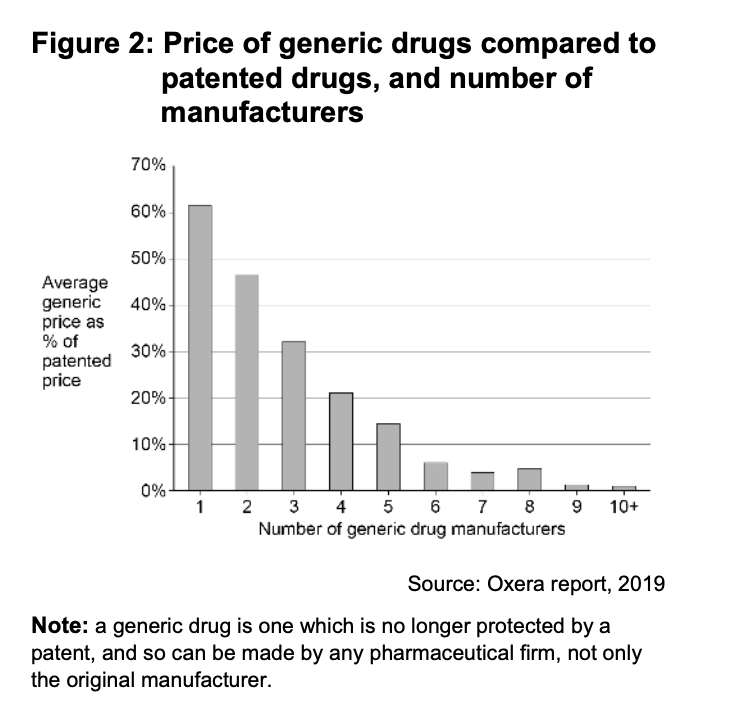
Explain how the data in Extract A (Figure 2) show that greater competition leads to lower prices in the market for generic drugs.
Was this exam question helpful?
Explain how the concept of cross elasticity of demand can be used to understand the relationship between markets.
Vaping, the use of e-cigarettes, is argued by many UK health experts to be a much less harmful substitute than smoking tobacco cigarettes. E-cigarettes contain fewer harmful chemicals such as tar, but they still contain addictive nicotine. The industry has been attacked for promoting sales amongst teenagers. This has led to San Francisco banning the sale of e-cigarettes.
Was this exam question helpful?