1
1 mark
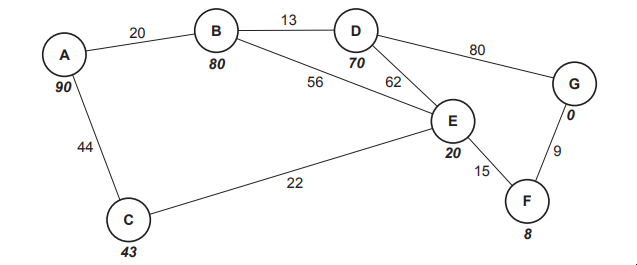
Fig. 5 shows a graph data structure representing a small section of a parcel delivery network. Each node represents an address where deliveries need to be made. The edges show the possible routes and distances between these deliveries.

State why performance modelling is used to test a system.
Was this exam question helpful?