Investigating Reaction Rates (OCR A Level Chemistry A) : Revision Note

Initial Rates Methods
The initial rates method determines the rate at the very start of the reaction when t = 0
The initial rate can be found by:
Drawing a concentration-time graph
Adding a tangent at t = 0
Calculating the gradient of the tangent
One example of measuring the initial rate could be the reaction of calcium carbonate with hydrochloric acid (similar to one of the PAG9 practicals)
The volume of carbon dioxide produced with different concentrations can be measured against time
The results are then plotted onto a graph
The tangent at t = 0 is then added
The gradient of the tangent can then be calculated to give the initial rate of the reaction
Worked Example
The concentration-time graph for the reaction of calcium carbonate with three different concentrations of hydrochloric acid is shown

Calculate the initial rate of reaction for the reaction of calcium carbonate with 2.0 mol dm-3 hydrochloric acid
Answer
Using the tangent drawn:
Gradient
format('truetype')%3Bfont-weight%3Anormal%3Bfont-style%3Anormal%3B%7D%3C%2Fstyle%3E%3C%2Fdefs%3E%3Ctext%20font-family%3D%22math17f39f8317fbdb1988ef4c628eb%22%20font-size%3D%2216%22%20text-anchor%3D%22middle%22%20x%3D%228.5%22%20y%3D%2230%22%3E%3D%3C%2Ftext%3E%3Cline%20stroke%3D%22%23000%22%20stroke-linecap%3D%22square%22%20stroke-width%3D%221%22%20x1%3D%2223.5%22%20x2%3D%2248.5%22%20y1%3D%2223.5%22%20y2%3D%2223.5%22%2F%3E%3Ctext%20font-family%3D%22Times%20New%20Roman%22%20font-size%3D%2218%22%20font-style%3D%22italic%22%20text-anchor%3D%22middle%22%20x%3D%2231.5%22%20y%3D%2216%22%3E%26%23x394%3B%3C%2Ftext%3E%3Ctext%20font-family%3D%22Times%20New%20Roman%22%20font-size%3D%2218%22%20font-style%3D%22italic%22%20text-anchor%3D%22middle%22%20x%3D%2241.5%22%20y%3D%2216%22%3Ey%3C%2Ftext%3E%3Ctext%20font-family%3D%22Times%20New%20Roman%22%20font-size%3D%2218%22%20font-style%3D%22italic%22%20text-anchor%3D%22middle%22%20x%3D%2231.5%22%20y%3D%2241%22%3E%26%23x394%3B%3C%2Ftext%3E%3Ctext%20font-family%3D%22Times%20New%20Roman%22%20font-size%3D%2218%22%20font-style%3D%22italic%22%20text-anchor%3D%22middle%22%20x%3D%2241.5%22%20y%3D%2241%22%3Ex%3C%2Ftext%3E%3Ctext%20font-family%3D%22math17f39f8317fbdb1988ef4c628eb%22%20font-size%3D%2216%22%20text-anchor%3D%22middle%22%20x%3D%2263.5%22%20y%3D%2230%22%3E%3D%3C%2Ftext%3E%3Cline%20stroke%3D%22%23000%22%20stroke-linecap%3D%22square%22%20stroke-width%3D%221%22%20x1%3D%2278.5%22%20x2%3D%2299.5%22%20y1%3D%2223.5%22%20y2%3D%2223.5%22%2F%3E%3Ctext%20font-family%3D%22Times%20New%20Roman%22%20font-size%3D%2218%22%20text-anchor%3D%22middle%22%20x%3D%2289.5%22%20y%3D%2216%22%3E40%3C%2Ftext%3E%3Ctext%20font-family%3D%22Times%20New%20Roman%22%20font-size%3D%2218%22%20text-anchor%3D%22middle%22%20x%3D%2289.5%22%20y%3D%2241%22%3E38%3C%2Ftext%3E%3Ctext%20font-family%3D%22math17f39f8317fbdb1988ef4c628eb%22%20font-size%3D%2216%22%20text-anchor%3D%22middle%22%20x%3D%22114.5%22%20y%3D%2230%22%3E%3D%3C%2Ftext%3E%3C%2Fsvg%3E) 1.05 mol dm-3 s-1
1.05 mol dm-3 s-1 Therefore, the initial rate of reaction is 1.05 mol dm-3 s-1
Clock reactions
Clock reactions are a more convenient way of measuring the initial rate of reaction using a single measurement
The time taken, t, for a specific visual change in the reaction to occur is measured
These changes could be a colour change or formation of a precipitate
The major assumption that clock reactions depend on is:
That there is no significant change in the rate of reaction between the start of the reaction and the time when the measurement is taken
The initial rate is then proportional to

The iodine clock experiment is a common clock reaction
This is covered in more detail in the PAG notes
Here is a set of typical results for the iodine clock reaction:
Specimen results for the iodine clock reaction table

The initial rate is a relatively simple calculation
E.g. For a concentration of 0.01515 mol dm-3, the rate is
 = 0.025 s-1
A closer look at the results shows that as the concentration doubles, the rate also doubles
This can be linked back to the reaction being first order
There are limitations to the accuracy of the clock reaction
These are, again, based on the assumption that the rate of reaction is constant
As the reaction progresses, the concentration of the reactants decreases - typically on a curve
Therefore, when the time measured for the reaction to occur is short then there is a higher chance that the initial rate calculated will be closer to the true value
As the time taken for the reaction to occur, the value of the initial rate will become less accurate
The initial rate measured during a clock reaction is an estimate
Continuous Monitoring
Continuous monitoring involves collecting experimental data throughout the course of a reaction to plot a concentration-time graph
Two of the most common ways to collect this data are by:
Measuring the volume / amount of gas evolved over time
Measuring the mass of reactants lost over time
Another alternative method involves the use of colorimetry:
The iodination of propanone
The iodination of propanone provides a suitable experiment in which the rate of reaction can be measured throughout the reaction by using a colorimeter
The reaction is carried out using a catalyst of dilute sulfuric acid
The iodine decolourises during the reaction as it turns into iodopropanone and hydrogen iodide:
CH3COCH3 + I2 → CH3COCH2I + HI
The colorimeter measures colour absorbance which is proportional to the concentration of the coloured species
Before the investigation begins it is necessary to measure the absorbance of a set of standard solutions of iodine and obtain a calibration curve
For example, here is a calibration curve for a transition metal ion that allows you to convert colorimeter readings into concentrations:
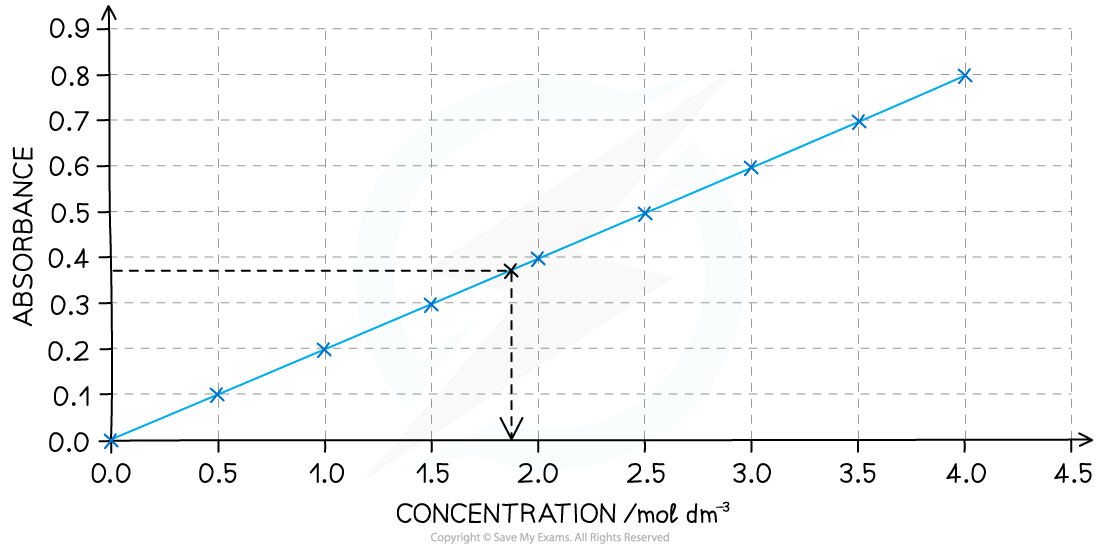
A calibration curve showing the relationship between colour absorbance and concentration
The colorimeter uses very small volumes of solutions, so four burettes can be filled with solutions of 0.02 mol dm-3 iodine, 1.0 mol dm-3 propanone and 1.0 mol dm-3 sulfuric acid and distilled water
By varying the volumes of solutions while maintaining a constant total volume with the use of distilled water, you can obtain a number of different concentrations
The solutions are measured into a small beaker, leaving the iodine in a separate beaker - this starts the reaction, so it can be added when you start a timer or stop watch
The iodine is added to the other liquids, the contents mixed and then quickly transferred into the cuvette (small receptacle) and the colorimeter / data logger started

The set up for using a colorimeter and data logger to continuously measure the rate of reaction
A typical set of volume compositions could be as follows:
Volume Compositions Table

Practical tip
Choose a filter that gives the strongest absorbance for the solution you are using - this will be the complementary colour to the colour of the solution under investigation
Specimen results table for the iodination of propanone


Graph showing the change in concentration of iodine during the course of the reaction
Measuring rate
To find the rate of reaction at any point, a tangent is drawn and the gradient is determined
The gradient gives the rate of reaction
For example, in the graph above, the rate of reaction at 300 seconds can be found
A vertical line is drawn from the 300 s mark until it meets the curve, then a tangent is drawn
Gradient
format('truetype')%3Bfont-weight%3Anormal%3Bfont-style%3Anormal%3B%7D%3C%2Fstyle%3E%3C%2Fdefs%3E%3Ctext%20font-family%3D%22math11824c643d1feb4da18b28ed527%22%20font-size%3D%2216%22%20text-anchor%3D%22middle%22%20x%3D%228.5%22%20y%3D%2230%22%3E%3D%3C%2Ftext%3E%3Cline%20stroke%3D%22%23000%22%20stroke-linecap%3D%22square%22%20stroke-width%3D%221%22%20x1%3D%2223.5%22%20x2%3D%2248.5%22%20y1%3D%2223.5%22%20y2%3D%2223.5%22%2F%3E%3Ctext%20font-family%3D%22Times%20New%20Roman%22%20font-size%3D%2218%22%20font-style%3D%22italic%22%20text-anchor%3D%22middle%22%20x%3D%2231.5%22%20y%3D%2216%22%3E%26%23x394%3B%3C%2Ftext%3E%3Ctext%20font-family%3D%22Times%20New%20Roman%22%20font-size%3D%2218%22%20font-style%3D%22italic%22%20text-anchor%3D%22middle%22%20x%3D%2241.5%22%20y%3D%2216%22%3Ey%3C%2Ftext%3E%3Ctext%20font-family%3D%22Times%20New%20Roman%22%20font-size%3D%2218%22%20font-style%3D%22italic%22%20text-anchor%3D%22middle%22%20x%3D%2231.5%22%20y%3D%2241%22%3E%26%23x394%3B%3C%2Ftext%3E%3Ctext%20font-family%3D%22Times%20New%20Roman%22%20font-size%3D%2218%22%20font-style%3D%22italic%22%20text-anchor%3D%22middle%22%20x%3D%2241.5%22%20y%3D%2241%22%3Ex%3C%2Ftext%3E%3Ctext%20font-family%3D%22math11824c643d1feb4da18b28ed527%22%20font-size%3D%2216%22%20text-anchor%3D%22middle%22%20x%3D%2263.5%22%20y%3D%2230%22%3E%3D%3C%2Ftext%3E%3Cline%20stroke%3D%22%23000%22%20stroke-linecap%3D%22square%22%20stroke-width%3D%221%22%20x1%3D%2278.5%22%20x2%3D%22131.5%22%20y1%3D%2223.5%22%20y2%3D%2223.5%22%2F%3E%3Ctext%20font-family%3D%22Times%20New%20Roman%22%20font-size%3D%2218%22%20text-anchor%3D%22middle%22%20x%3D%2284.5%22%20y%3D%2216%22%3E0%3C%2Ftext%3E%3Ctext%20font-family%3D%22math11824c643d1feb4da18b28ed527%22%20font-size%3D%2216%22%20text-anchor%3D%22middle%22%20x%3D%2291.5%22%20y%3D%2216%22%3E.%3C%2Ftext%3E%3Ctext%20font-family%3D%22Times%20New%20Roman%22%20font-size%3D%2218%22%20text-anchor%3D%22middle%22%20x%3D%22112.5%22%20y%3D%2216%22%3E0069%3C%2Ftext%3E%3Ctext%20font-family%3D%22Times%20New%20Roman%22%20font-size%3D%2218%22%20text-anchor%3D%22middle%22%20x%3D%22105.5%22%20y%3D%2241%22%3E580%3C%2Ftext%3E%3Ctext%20font-family%3D%22math11824c643d1feb4da18b28ed527%22%20font-size%3D%2216%22%20text-anchor%3D%22middle%22%20x%3D%22146.5%22%20y%3D%2230%22%3E%3D%3C%2Ftext%3E%3C%2Fsvg%3E) 1.19 x 10⁻⁵ mol dm-3 s-1
1.19 x 10⁻⁵ mol dm-3 s-1
The gradient is the rate of reaction at that point
Examiner Tips and Tricks
Whichever rates experiments you carry out, make sure you can
describe the steps in the procedure
name all the apparatus used
draw data tables which include headings and units
draw graphs showing labels, units and best fit lines
determine an initial gradient or at any point in the curve

You've read 0 of your 5 free revision notes this week
Sign up now. It’s free!
Did this page help you?