Concentration-Time Graphs (OCR A Level Chemistry A) : Revision Note

Concentration-Time Graphs
Reaction Order Using Concentration-Time Graphs
In a zero-order reaction, the concentration of the reactant is inversely proportional to time
This means that the reactant concentration decreases as time increases
The graph is a straight line going down as shown:

Concentration-time graph of a zero-order reaction
The gradient of the line is the rate of reaction
Calculating the gradient at different points on the graph, will give a constant value for the rate of reaction
When the order with respect to a reactant is 0, a change in the concentration of the reactant has no effect on the rate of the reaction
Therefore:
Rate = k
This equation means that the gradient of the graph is the rate of reaction as well as the rate constant, k
In a first-order reaction, the concentration of the reactant decreases with time
The graph is a curve going downwards and eventually plateaus:

Concentration-time graph of a first-order reaction
In a second-order reaction, the concentration of the reactant decreases more steeply with time
The concentration of reactant decreases more with increasing time compared to a first-order reaction
The graph is a steeper curve going downwards:

Concentration-time graph of a second-order reaction
Concentration-Time Graphs & Half-Life
Order of reaction from half-life
The order of a reaction can also be deduced from its half-life (t1/2 )
For a zero-order reaction the successive half-lives decrease with time
This means that it would take less time for the concentration of reactant to halve as the reaction progresses
The half-life of a first-order reaction remains constant throughout the reaction
The amount of time required for the concentration of reactants to halve will be the same during the entire reaction
For a second-order reaction, the half-life increases with time
This means that as the reaction is taking place, it takes more time for the concentration of reactants to halve
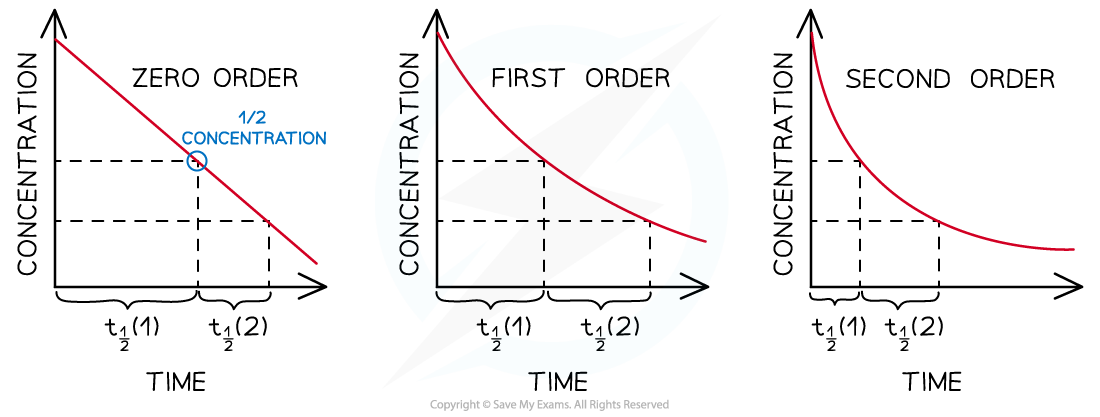
Half-lives of zero, first and second-order reactions

You've read 0 of your 5 free revision notes this week
Sign up now. It’s free!
Did this page help you?