Demand (Edexcel A Level Business)

Revision Note

Mark Collins

Written by: Mark Collins

Reviewed by: Steve Vorster

An Introduction to Demand

  • Demand refers to the number of goods/services customers are willing to buy at a given price

    • Effective demand occurs when customers are willing and able (they have the money) to buy at a given price

  • There is an inverse relationship between the quantity demanded by customers and the price 

    • As the price increases, the quantity demanded decreases

    • As price decreases, the quantity demanded increases

    • Hence the demand curve slopes downwards from left to right

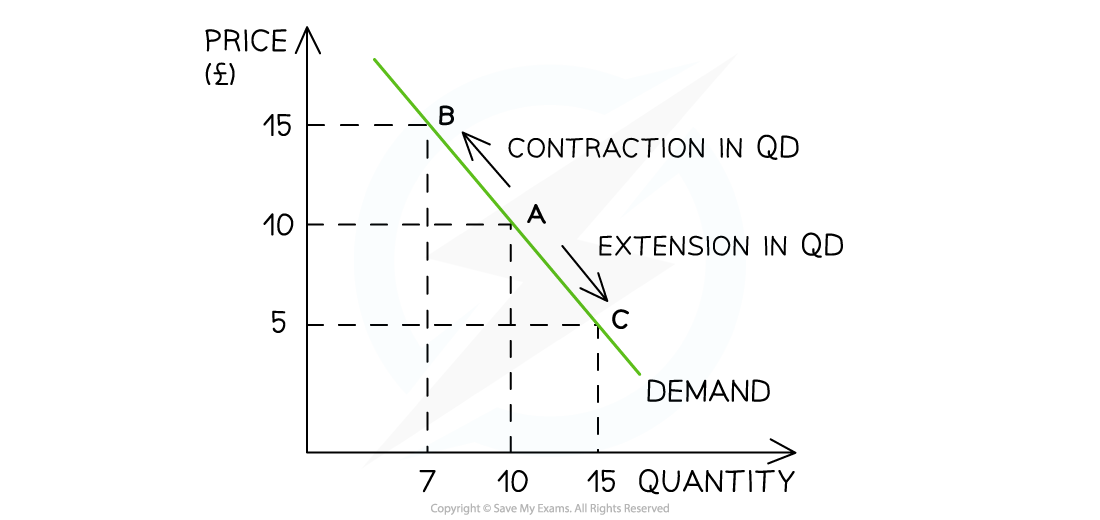
  • This is illustrated in the diagram below

Graph showing a demand curve with price on the vertical axis and quantity on the horizontal axis. Points A, B, and C indicate demand changes.

A demand curve showing how a change in price will lead to a change in quantity demanded (QD)

Diagram Analysis

  • An increase in price from £10 to £15 leads to a movement up the demand curve from point A to B

    • Due to the increase in price, the quantity demanded (QD) has fallen from 10 to 7 units

  • A decrease in price from £10 to £5 leads to a movement down the demand curve from point A to point C

    • Due to the decrease in price, the QD has increased from 10 to 15 units

Examiner Tips and Tricks

When writing about a movement along the demand curve we use the term quantity demanded

Factors Leading to a Change in Demand

  • A change in price leads to a movement along the demand curve

  • However, a change in any other factors affecting demand will shift the entire demand curve to the left or right

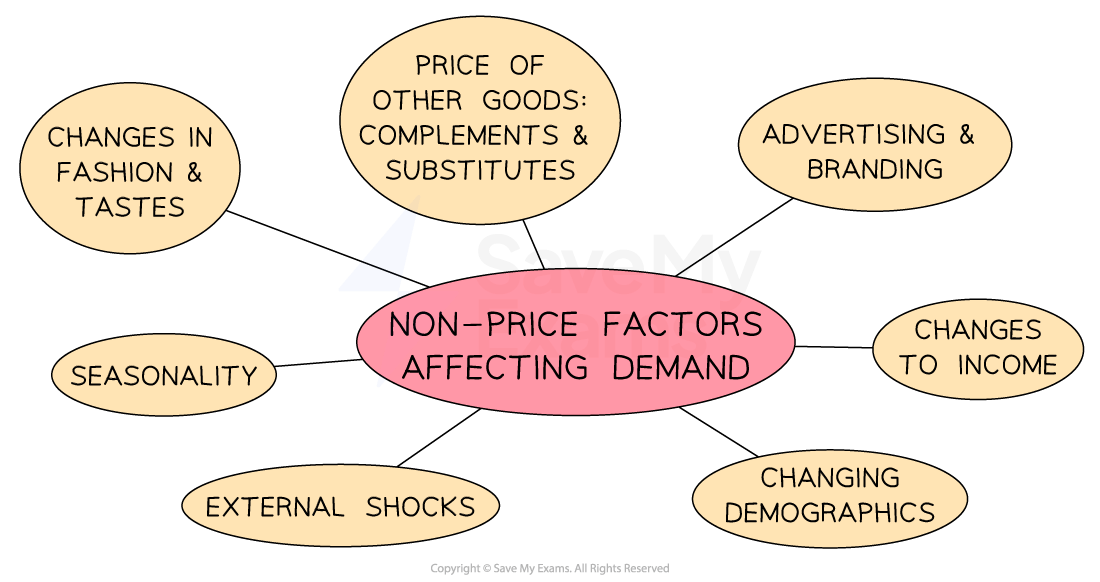
    • These are called non-price factors affecting demand
        

Diagram showing non-price factors affecting demand, including fashion changes, goods prices, advertising, income changes, seasonality, shocks, demographics.

The non-price factors affecting demand result in a shift of the entire demand curve 

  • For example, if a firm increases its Instagram advertising, there will be an increase in demand as more consumers become aware of the product

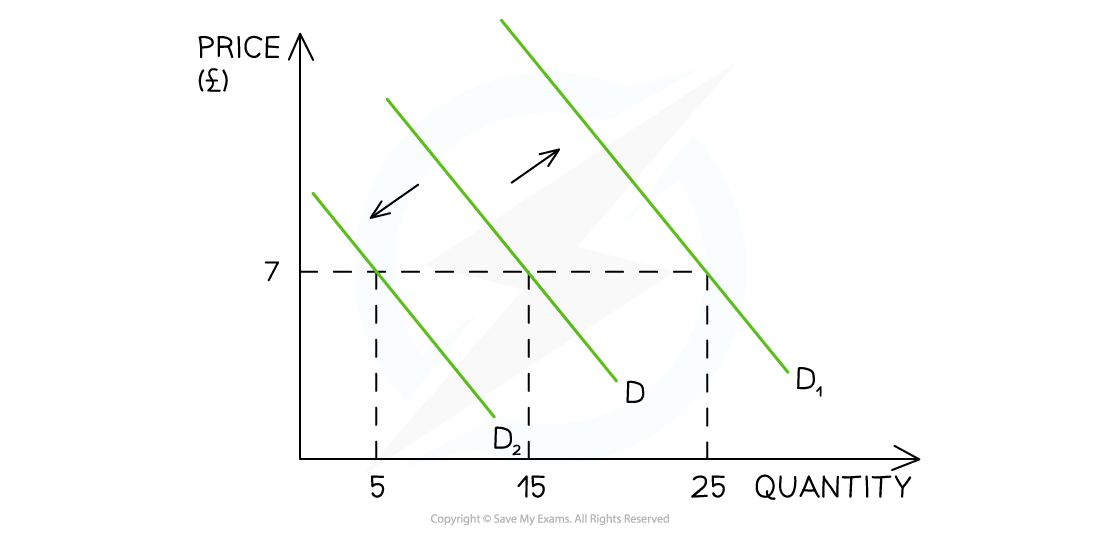
    • This is a shift in demand from D to D1. The price remains unchanged at £7 but the demand has increased from 15 to 25 units

      Graph showing the demand curve shifts. Axes labelled Price (£) and Quantity. Initial curve D shifts right from D2 through D to D1, with price marked at 7.

A change in any non-price factor will lead to a change in the position of the demand curve

Diagram Analysis

  • The initial demand curve is seen at D

    • At a price of £7, 15 units are demanded

  • If the price remains constant at £7 but demand decreases due to one of the non-price factors of demand (e.g. decreasing incomes), the entire demand curve shifts to the left from D to D2

    • Demand has decreased from 15 units to 5 units

  • If the price remains constant at £10 but demand increases due to one of the non-price factors of demand (e.g. increased advertising expenditure), the entire demand curve shifts to the right from D to D3

    • Demand has increased from 15 units to 25 units

Non-price Factors Affecting Demand

Non-price Factor

Explanation

Example

Change in the price of substitutes

  • Substitutes goods are replacement goods, e.g. different brands of car

  • If the price of VW cars increases, demand for Ford cars might rise

  • This shifts the demand curve for Ford cars to the right

Change in the price of complementary goods 

  • Complementary goods are goods that are consumed together 

  • Cars and petrol: if the price of petrol rises, the demand for cars may fall

  • This shifts the demand curve for cars to the left

Change in consumer incomes

  • As a consumer’s income rises, demand for normal goods) increases

  • Demand for branded goods, e.g. Superdry hoodies, tends to increase as consumer incomes rise

  • This shifts the demand curve for branded goods  to the right

  • As a consumer’s income falls, demand for inferior goods) increases

  • Demand for own label products, e.g. supermarket hoodies, tends to rise as consumer incomes fall

  • This shifts the demand curve for own label goods to the right

Fashions, tastes & preferences

  • If products become more fashionable, demand them increases

  • Plant based foods have become more popular in recent years

  • This shifts the demand curve for plant based foods to the right

Advertising & branding

  • If more money is spent on advertising or branding, then this increases consumer awareness and brand loyalty

  • Coca Cola spends an average of $4bn per year on advertising and branding

  • This shifts Coca Cola's demand curve to the right and makes demand more price inelastic

Demographics

  • If the structure or size of a country’s population changes, then the demand for products will also change

  • A decrease in the number of babies being born will reduce the demand for baby products

  • This shifts the demand curve for baby products to the left

Seasonality

  • Demand varies at different times of the year

  • In cold climates, the demand for gas and electricity will fall in the summer months

  • This shifts the demand curve for energy to the left

External shocks

  • An unexpected event can change the demand

  • The outbreak of Covid-19 lead to panic buying of goods such as toilet rolls 

  • This shifts the demand curve for toilet rolls to the right

Examiner Tips and Tricks

Remember, a change in any non-price factor which leads to less demand will shift the entire demand curve to the left but a change in any non-price factor which leads to more demand will shift the entire demand curve to the right

Last updated:

You've read 0 of your 5 free revision notes this week

Sign up now. It’s free!

Join the 100,000+ Students that ❤️ Save My Exams

the (exam) results speak for themselves:

Did this page help you?

Mark Collins

Author: Mark Collins

Expertise: Business Content Creator (Previous)

Mark has taught Business and Economics for over 25 years in the UK, Sri Lanka and Thailand. He has an MA from UCL and was a research assistant at the Institute of Education. He enjoys creating learning resources for students and has co-authored several teaching guides. Mark has been an examiner and principal examiner for various exam boards and has a mission to demystify the examination process for students. When not teaching Mark plays guitar, harmonica, ukulele and is currently teaching himself piano. He is a firm believer in Lifelong Learning.

Steve Vorster

Author: Steve Vorster

Expertise: Economics & Business Subject Lead

Steve has taught A Level, GCSE, IGCSE Business and Economics - as well as IBDP Economics and Business Management. He is an IBDP Examiner and IGCSE textbook author. His students regularly achieve 90-100% in their final exams. Steve has been the Assistant Head of Sixth Form for a school in Devon, and Head of Economics at the world's largest International school in Singapore. He loves to create resources which speed up student learning and are easily accessible by all.