Variation: t-test Worked Example (Cambridge (CIE) A Level Biology): Revision Note
Exam code: 9700

Variation: t-test worked example
Worked Example
The ear lengths of two populations of rabbits were measured.
Ear lengths of population A (mm):
62, 60, 59, 61, 60, 58, 59, 60, 57, 56, 59, 58, 60, 59, 57
Ear lengths of population B (mm):
58, 59, 57, 59, 59, 57, 55, 60, 57, 58, 59, 58, 57, 58, 59
Use the t-test to determine whether there is a significant difference in ear length between the two populations.
Solution
Null hypothesis: There is no significant difference between the ear lengths of the rabbits in populations A and B
Sample sizes:
Population A: n1 = 15
Population B: n2 = 15
Step 1: Calculate the mean for each data set:
Mean for population A x̅1 = 885 ÷ 15 = 59 mm
Mean for population B x̅2 = 870 ÷ 15 = 58 mm
Step 2: Calculate the standard deviation (s) for each set of data
Population A | Population B | ||
|---|---|---|---|
Difference between value and mean (x - x̄) | Difference between value and mean (x - x̄)2 | Difference between value and mean (x - x̄) | Difference between value and mean (x - x̄)2 |
62 - 59 = 3 | 9 | 58 - 58 = 0 | 0 |
60 - 59 = 1 | 1 | 59 - 58 = 1 | 1 |
59 - 59 = 0 | 0 | 57 - 58 = -1 | 1 |
61 - 59 = 2 | 4 | 59 - 58 = 1 | 1 |
60 - 59 = 1 | 1 | 59 - 58 = 1 | 1 |
58 - 59 = -1 | 1 | 57 - 58 = -1 | 1 |
59 - 59 = 0 | 0 | 55 - 58 = -3 | 9 |
60 - 59 = 1 | 1 | 60 - 58 = 2 | 4 |
57 - 59 = -2 | 4 | 57 - 58 = -1 | 1 |
56 - 59 = -3 | 9 | 58 - 58 = 0 | 0 |
59 - 59 = 0 | 0 | 59 - 58 = 1 | 1 |
58 - 59 = -1 | 1 | 58 - 58 = 0 | 0 |
60 - 59 = 1 | 1 | 57 - 58 = -1 | 1 |
59 - 59 = 0 | 0 | 58 - 58 = 0 | 0 |
57 - 59 = -2 | 4 | 59 - 58 = 1 | 1 |
Total ∑(x - x̄)2 | 36 | Total ∑(x - x̄)2 | 22 |
To find the standard deviations divide the sum of each square by n - 1 for each data set, and take the square root of each value
Population A (n1 = 15) | Population B (n2 = 15) |
|---|---|
n1 - 1 = 14 | n2 - 1 = 14 |
∑(x - x̄)2 = 36 so 36 ÷ 14 = 2.57 | ∑(x - x̄)2 = 22 so 36 ÷ 22 = 1.57 |
|
|
|
|
format('truetype')%3Bfont-weight%3Anormal%3Bfont-style%3Anormal%3B%7D%40font-face%7Bfont-family%3A'math1e5b166677791b8f78bf16bcf04'%3Bsrc%3Aurl(data%3Afont%2Ftruetype%3Bcharset%3Dutf-8%3Bbase64%2CAAEAAAAMAIAAAwBAT1MvMi7iBBMAAADMAAAATmNtYXDEvmKUAAABHAAAAExjdnQgDVUNBwAAAWgAAAA6Z2x5ZoPi2VsAAAGkAAABy2hlYWQQC2qxAAADcAAAADZoaGVhCGsXSAAAA6gAAAAkaG10eE2rRkcAAAPMAAAAFGxvY2EAHTwYAAAD4AAAABhtYXhwBT0FPgAAA%2FgAAAAgbmFtZaBxlY4AAAQYAAABn3Bvc3QB9wD6AAAFuAAAACBwcmVwa1uragAABdgAAAAUAAADSwGQAAUAAAQABAAAAAAABAAEAAAAAAAAAQEAAAAAAAAAAAAAAAAAAAAAAAAAAAAAAAAAAAAAACAgICAAAAAg1UADev96AAAD6ACWAAAAAAACAAEAAQAAABQAAwABAAAAFAAEADgAAAAKAAgAAgACAC4APSIRIhL%2F%2FwAAAC4APSIRIhL%2F%2F%2F%2FT%2F8Xd8t3yAAEAAAAAAAAAAAAAAAABVAMsAIABAABWACoCWAIeAQ4BLAIsAFoBgAKAAKAA1ACAAAAAAAAAACsAVQCAAKsA1QEAASsABwAAAAIAVQAAAwADqwADAAcAADMRIRElIREhVQKr%2FasCAP4AA6v8VVUDAAABACAAAACgAIAAAwAvGAGwBBCwA9SwAxCwAtSwAxCwADywAhCwATwAsAQQsAPUsAMQsAI8sAAQsAE8MDE3MxUjIICAgIAAAgCAAOsC1QIVAAMABwBlGAGwCBCwBtSwBhCwBdSwCBCwAdSwARCwANSwBhCwBzywBRCwBDywARCwAjywABCwAzwAsAgQsAbUsAYQsAfUsAcQsAHUsAEQsALUsAYQsAU8sAcQsAQ8sAEQsAA8sAIQsAM8MTATITUhHQEhNYACVf2rAlUBwFXVVVUAAQCAAAADKwMrAA8AShgBsBAQsQQD9rAAPLEJA%2FWwCzyxBgv1sA48sRED5rEHBv2wDTwAsQQAP7EIBf2xAwk8PLEGBe2xAAI%2FsQwF%2FbELATw8sQ4F%2FTEwExUJARUhNSMVIQkBIRUzNYABK%2F7VAqsr%2FgABK%2F7VAgArAytV%2Fv%2F%2BgFWrVgGAAQFWqwABAIABVQLVAasAAwAwGAGwBBCxAAP2sAM8sQIH9bABPLEFA%2BYAsQAAExCxAAblsQABExCwATyxAwX1sAI8EyEVIYACVf2rAatWAAABAAAAAQAA1XjOQV8PPPUAAwQA%2F%2F%2F%2F%2F9Y6E3P%2F%2F%2F%2F%2F1joTcwAA%2FyAEgAOrAAAACgACAAEAAAAAAAEAAAPo%2F2oAABdwAAD%2FtgSAAAEAAAAAAAAAAAAAAAAAAAAFA1IAVQDIACADVgCAA6wAgANWAIAAAAAAAAAAKAAAAG4AAAD4AAABgQAAAcsAAQAAAAUAXgAFAAAAAAACAIAEAAAAAAAEAADeAAAAAAAAABUBAgAAAAAAAAABABIAAAAAAAAAAAACAA4AEgAAAAAAAAADADAAIAAAAAAAAAAEABIAUAAAAAAAAAAFABYAYgAAAAAAAAAGAAkAeAAAAAAAAAAIABwAgQABAAAAAAABABIAAAABAAAAAAACAA4AEgABAAAAAAADADAAIAABAAAAAAAEABIAUAABAAAAAAAFABYAYgABAAAAAAAGAAkAeAABAAAAAAAIABwAgQADAAEECQABABIAAAADAAEECQACAA4AEgADAAEECQADADAAIAADAAEECQAEABIAUAADAAEECQAFABYAYgADAAEECQAGAAkAeAADAAEECQAIABwAgQBNAGEAdABoACAARgBvAG4AdABSAGUAZwB1AGwAYQByAE0AYQB0AGgAcwAgAEYAbwByACAATQBvAHIAZQAgAE0AYQB0AGgAIABGAG8AbgB0AE0AYQB0AGgAIABGAG8AbgB0AFYAZQByAHMAaQBvAG4AIAAxAC4AME1hdGhfRm9udABNAGEAdABoAHMAIABGAG8AcgAgAE0AbwByAGUAAAMAAAAAAAAB9AD6AAAAAAAAAAAAAAAAAAAAAAAAAAC5BxEAAI2FGACyAAAAFRQTsQABPw%3D%3D)format('truetype')%3Bfont-weight%3Anormal%3Bfont-style%3Anormal%3B%7D%40font-face%7Bfont-family%3A'round_brackets18549f92a457f2409'%3Bsrc%3Aurl(data%3Afont%2Ftruetype%3Bcharset%3Dutf-8%3Bbase64%2CAAEAAAAMAIAAAwBAT1MvMjwHLFQAAADMAAAATmNtYXDf7xCrAAABHAAAADxjdnQgBAkDLgAAAVgAAAASZ2x5ZmAOz2cAAAFsAAABJGhlYWQOKih8AAACkAAAADZoaGVhCvgVwgAAAsgAAAAkaG10eCA6AAIAAALsAAAADGxvY2EAAARLAAAC%2BAAAABBtYXhwBIgEWQAAAwgAAAAgbmFtZXHR30MAAAMoAAACOXBvc3QDogHPAAAFZAAAACBwcmVwupWEAAAABYQAAAAHAAAGcgGQAAUAAAgACAAAAAAACAAIAAAAAAAAAQIAAAAAAAAAAAAAAAAAAAAAAAAAAAAAAAAAAAAAACAgICAAAAAo8AMGe%2F57AAAHPgGyAAAAAAACAAEAAQAAABQAAwABAAAAFAAEACgAAAAGAAQAAQACACgAKf%2F%2FAAAAKAAp%2F%2F%2F%2F2f%2FZAAEAAAAAAAAAAAFUAFYBAAAsAKgDgAAyAAcAAAACAAAAKgDVA1UAAwAHAAA1MxEjEyMRM9XVq4CAKgMr%2FQAC1QABAAD%2B0AIgBtAACQBNGAGwChCwA9SwAxCwAtSwChCwBdSwBRCwANSwAxCwBzywAhCwCDwAsAoQsAPUsAMQsAfUsAoQsAXUsAoQsADUsAMQsAI8sAcQsAg8MTAREAEzABEQASMAAZCQ%2FnABkJD%2BcALQ%2FZD%2BcAGQAnACcAGQ%2FnAAAQAA%2FtACIAbQAAkATRgBsAoQsAPUsAMQsALUsAoQsAXUsAUQsADUsAMQsAc8sAIQsAg8ALAKELAD1LADELAH1LAKELAF1LAKELAA1LADELACPLAHELAIPDEwARABIwAREAEzAAIg%2FnCQAZD%2BcJABkALQ%2FZD%2BcAGQAnACcAGQ%2FnAAAQAAAAEAAPW2NYFfDzz1AAMIAP%2F%2F%2F%2F%2FVre7u%2F%2F%2F%2F%2F9Wt7u4AAP7QA7cG0AAAAAoAAgABAAAAAAABAAAHPv5OAAAXcAAA%2F%2F4DtwABAAAAAAAAAAAAAAAAAAAAAwDVAAACIAAAAiAAAAAAAAAAAAAkAAAAowAAASQAAQAAAAMACgACAAAAAAACAIAEAAAAAAAEAABNAAAAAAAAABUBAgAAAAAAAAABAD4AAAAAAAAAAAACAA4APgAAAAAAAAADAFwATAAAAAAAAAAEAD4AqAAAAAAAAAAFABYA5gAAAAAAAAAGAB8A%2FAAAAAAAAAAIABwBGwABAAAAAAABAD4AAAABAAAAAAACAA4APgABAAAAAAADAFwATAABAAAAAAAEAD4AqAABAAAAAAAFABYA5gABAAAAAAAGAB8A%2FAABAAAAAAAIABwBGwADAAEECQABAD4AAAADAAEECQACAA4APgADAAEECQADAFwATAADAAEECQAEAD4AqAADAAEECQAFABYA5gADAAEECQAGAB8A%2FAADAAEECQAIABwBGwBSAG8AdQBuAGQAIABiAHIAYQBjAGsAZQB0AHMAIAB3AGkAdABoACAAYQBzAGMAZQBuAHQAIAAxADgANQA0AFIAZQBnAHUAbABhAHIATQBhAHQAaABzACAARgBvAHIAIABNAG8AcgBlACAAUgBvAHUAbgBkACAAYgByAGEAYwBrAGUAdABzACAAdwBpAHQAaAAgAGEAcwBjAGUAbgB0ACAAMQA4ADUANABSAG8AdQBuAGQAIABiAHIAYQBjAGsAZQB0AHMAIAB3AGkAdABoACAAYQBzAGMAZQBuAHQAIAAxADgANQA0AFYAZQByAHMAaQBvAG4AIAAyAC4AMFJvdW5kX2JyYWNrZXRzX3dpdGhfYXNjZW50XzE4NTQATQBhAHQAaABzACAARgBvAHIAIABNAG8AcgBlAAAAAAMAAAAAAAADnwHPAAAAAAAAAAAAAAAAAAAAAAAAAAC5B%2F8AAY2FAA%3D%3D)format('truetype')%3Bfont-weight%3Anormal%3Bfont-style%3Anormal%3B%7D%3C%2Fstyle%3E%3C%2Fdefs%3E%3Ctext%20font-family%3D%22Arial%22%20font-size%3D%2218%22%20text-anchor%3D%22middle%22%20x%3D%224.5%22%20y%3D%2247%22%3Es%3C%2Ftext%3E%3Ctext%20font-family%3D%22Arial%22%20font-size%3D%2213%22%20text-anchor%3D%22middle%22%20x%3D%2212.5%22%20y%3D%2252%22%3E1%3C%2Ftext%3E%3Ctext%20font-family%3D%22math1e5b166677791b8f78bf16bcf04%22%20font-size%3D%2218%22%20text-anchor%3D%22middle%22%20x%3D%2225.5%22%20y%3D%2247%22%3E%3D%3C%2Ftext%3E%3Cpolyline%20fill%3D%22none%22%20points%3D%2214%2C-59%2013%2C-59%206%2C0%202%2C-23%22%20stroke%3D%22%23000%22%20stroke-linecap%3D%22square%22%20stroke-width%3D%221%22%20transform%3D%22translate(35.5%2C62.5)%22%2F%3E%3Cpolyline%20fill%3D%22none%22%20points%3D%226%2C0%202%2C-23%201%2C-20%22%20stroke%3D%22%23000%22%20stroke-linecap%3D%22square%22%20stroke-width%3D%221%22%20transform%3D%22translate(35.5%2C62.5)%22%2F%3E%3Cline%20stroke%3D%22%23000%22%20stroke-linecap%3D%22square%22%20stroke-width%3D%221%22%20x1%3D%2249.5%22%20x2%3D%22146.5%22%20y1%3D%223.5%22%20y2%3D%223.5%22%2F%3E%3Cline%20stroke%3D%22%23000%22%20stroke-linecap%3D%22square%22%20stroke-width%3D%221%22%20x1%3D%2253.5%22%20x2%3D%22142.5%22%20y1%3D%2240.5%22%20y2%3D%2240.5%22%2F%3E%3Ctext%20font-family%3D%22math1e5b166677791b8f78bf16bcf04%22%20font-size%3D%2227%22%20text-anchor%3D%22middle%22%20x%3D%2267.5%22%20y%3D%2230%22%3E%26%23x2211%3B%3C%2Ftext%3E%3Ctext%20font-family%3D%22round_brackets18549f92a457f2409%22%20font-size%3D%2218%22%20text-anchor%3D%22middle%22%20x%3D%2288.5%22%20y%3D%2227%22%3E(%3C%2Ftext%3E%3Ctext%20font-family%3D%22round_brackets18549f92a457f2409%22%20font-size%3D%2218%22%20text-anchor%3D%22middle%22%20x%3D%22130.5%22%20y%3D%2227%22%3E)%3C%2Ftext%3E%3Ctext%20font-family%3D%22Arial%22%20font-size%3D%2218%22%20text-anchor%3D%22middle%22%20x%3D%2295.5%22%20y%3D%2227%22%3Ex%3C%2Ftext%3E%3Ctext%20font-family%3D%22math1e5b166677791b8f78bf16bcf04%22%20font-size%3D%2218%22%20text-anchor%3D%22middle%22%20x%3D%22109.5%22%20y%3D%2227%22%3E%26%23x2212%3B%3C%2Ftext%3E%3Ctext%20font-family%3D%22horizontalbf65417dcecc7f2b0006e%22%20font-size%3D%2213%22%20text-anchor%3D%22middle%22%20x%3D%22121.5%22%20y%3D%2218%22%3E%26%23x23AF%3B%3C%2Ftext%3E%3Ctext%20font-family%3D%22horizontalbf65417dcecc7f2b0006e%22%20font-size%3D%2213%22%20text-anchor%3D%22middle%22%20x%3D%22125.5%22%20y%3D%2218%22%3E%26%23x23AF%3B%3C%2Ftext%3E%3Ctext%20font-family%3D%22Arial%22%20font-size%3D%2218%22%20text-anchor%3D%22middle%22%20x%3D%22123.5%22%20y%3D%2227%22%3Ex%3C%2Ftext%3E%3Ctext%20font-family%3D%22Arial%22%20font-size%3D%2213%22%20text-anchor%3D%22middle%22%20x%3D%22137.5%22%20y%3D%2218%22%3E2%3C%2Ftext%3E%3Ctext%20font-family%3D%22Arial%22%20font-size%3D%2218%22%20text-anchor%3D%22middle%22%20x%3D%2284.5%22%20y%3D%2260%22%3En%3C%2Ftext%3E%3Ctext%20font-family%3D%22math1e5b166677791b8f78bf16bcf04%22%20font-size%3D%2218%22%20text-anchor%3D%22middle%22%20x%3D%2298.5%22%20y%3D%2260%22%3E%26%23x2212%3B%3C%2Ftext%3E%3Ctext%20font-family%3D%22Arial%22%20font-size%3D%2218%22%20text-anchor%3D%22middle%22%20x%3D%22113.5%22%20y%3D%2260%22%3E1%3C%2Ftext%3E%3Ctext%20font-family%3D%22math1e5b166677791b8f78bf16bcf04%22%20font-size%3D%2218%22%20text-anchor%3D%22middle%22%20x%3D%22156.5%22%20y%3D%2247%22%3E%3D%3C%2Ftext%3E%3Ctext%20font-family%3D%22Arial%22%20font-size%3D%2218%22%20text-anchor%3D%22middle%22%20x%3D%22171.5%22%20y%3D%2247%22%3E1%3C%2Ftext%3E%3Ctext%20font-family%3D%22math1e5b166677791b8f78bf16bcf04%22%20font-size%3D%2218%22%20text-anchor%3D%22middle%22%20x%3D%22179.5%22%20y%3D%2247%22%3E.%3C%2Ftext%3E%3Ctext%20font-family%3D%22Arial%22%20font-size%3D%2218%22%20text-anchor%3D%22middle%22%20x%3D%22192.5%22%20y%3D%2247%22%3E60%3C%2Ftext%3E%3C%2Fsvg%3E)
format('truetype')%3Bfont-weight%3Anormal%3Bfont-style%3Anormal%3B%7D%40font-face%7Bfont-family%3A'math1e5b166677791b8f78bf16bcf04'%3Bsrc%3Aurl(data%3Afont%2Ftruetype%3Bcharset%3Dutf-8%3Bbase64%2CAAEAAAAMAIAAAwBAT1MvMi7iBBMAAADMAAAATmNtYXDEvmKUAAABHAAAAExjdnQgDVUNBwAAAWgAAAA6Z2x5ZoPi2VsAAAGkAAABy2hlYWQQC2qxAAADcAAAADZoaGVhCGsXSAAAA6gAAAAkaG10eE2rRkcAAAPMAAAAFGxvY2EAHTwYAAAD4AAAABhtYXhwBT0FPgAAA%2FgAAAAgbmFtZaBxlY4AAAQYAAABn3Bvc3QB9wD6AAAFuAAAACBwcmVwa1uragAABdgAAAAUAAADSwGQAAUAAAQABAAAAAAABAAEAAAAAAAAAQEAAAAAAAAAAAAAAAAAAAAAAAAAAAAAAAAAAAAAACAgICAAAAAg1UADev96AAAD6ACWAAAAAAACAAEAAQAAABQAAwABAAAAFAAEADgAAAAKAAgAAgACAC4APSIRIhL%2F%2FwAAAC4APSIRIhL%2F%2F%2F%2FT%2F8Xd8t3yAAEAAAAAAAAAAAAAAAABVAMsAIABAABWACoCWAIeAQ4BLAIsAFoBgAKAAKAA1ACAAAAAAAAAACsAVQCAAKsA1QEAASsABwAAAAIAVQAAAwADqwADAAcAADMRIRElIREhVQKr%2FasCAP4AA6v8VVUDAAABACAAAACgAIAAAwAvGAGwBBCwA9SwAxCwAtSwAxCwADywAhCwATwAsAQQsAPUsAMQsAI8sAAQsAE8MDE3MxUjIICAgIAAAgCAAOsC1QIVAAMABwBlGAGwCBCwBtSwBhCwBdSwCBCwAdSwARCwANSwBhCwBzywBRCwBDywARCwAjywABCwAzwAsAgQsAbUsAYQsAfUsAcQsAHUsAEQsALUsAYQsAU8sAcQsAQ8sAEQsAA8sAIQsAM8MTATITUhHQEhNYACVf2rAlUBwFXVVVUAAQCAAAADKwMrAA8AShgBsBAQsQQD9rAAPLEJA%2FWwCzyxBgv1sA48sRED5rEHBv2wDTwAsQQAP7EIBf2xAwk8PLEGBe2xAAI%2FsQwF%2FbELATw8sQ4F%2FTEwExUJARUhNSMVIQkBIRUzNYABK%2F7VAqsr%2FgABK%2F7VAgArAytV%2Fv%2F%2BgFWrVgGAAQFWqwABAIABVQLVAasAAwAwGAGwBBCxAAP2sAM8sQIH9bABPLEFA%2BYAsQAAExCxAAblsQABExCwATyxAwX1sAI8EyEVIYACVf2rAatWAAABAAAAAQAA1XjOQV8PPPUAAwQA%2F%2F%2F%2F%2F9Y6E3P%2F%2F%2F%2F%2F1joTcwAA%2FyAEgAOrAAAACgACAAEAAAAAAAEAAAPo%2F2oAABdwAAD%2FtgSAAAEAAAAAAAAAAAAAAAAAAAAFA1IAVQDIACADVgCAA6wAgANWAIAAAAAAAAAAKAAAAG4AAAD4AAABgQAAAcsAAQAAAAUAXgAFAAAAAAACAIAEAAAAAAAEAADeAAAAAAAAABUBAgAAAAAAAAABABIAAAAAAAAAAAACAA4AEgAAAAAAAAADADAAIAAAAAAAAAAEABIAUAAAAAAAAAAFABYAYgAAAAAAAAAGAAkAeAAAAAAAAAAIABwAgQABAAAAAAABABIAAAABAAAAAAACAA4AEgABAAAAAAADADAAIAABAAAAAAAEABIAUAABAAAAAAAFABYAYgABAAAAAAAGAAkAeAABAAAAAAAIABwAgQADAAEECQABABIAAAADAAEECQACAA4AEgADAAEECQADADAAIAADAAEECQAEABIAUAADAAEECQAFABYAYgADAAEECQAGAAkAeAADAAEECQAIABwAgQBNAGEAdABoACAARgBvAG4AdABSAGUAZwB1AGwAYQByAE0AYQB0AGgAcwAgAEYAbwByACAATQBvAHIAZQAgAE0AYQB0AGgAIABGAG8AbgB0AE0AYQB0AGgAIABGAG8AbgB0AFYAZQByAHMAaQBvAG4AIAAxAC4AME1hdGhfRm9udABNAGEAdABoAHMAIABGAG8AcgAgAE0AbwByAGUAAAMAAAAAAAAB9AD6AAAAAAAAAAAAAAAAAAAAAAAAAAC5BxEAAI2FGACyAAAAFRQTsQABPw%3D%3D)format('truetype')%3Bfont-weight%3Anormal%3Bfont-style%3Anormal%3B%7D%40font-face%7Bfont-family%3A'round_brackets18549f92a457f2409'%3Bsrc%3Aurl(data%3Afont%2Ftruetype%3Bcharset%3Dutf-8%3Bbase64%2CAAEAAAAMAIAAAwBAT1MvMjwHLFQAAADMAAAATmNtYXDf7xCrAAABHAAAADxjdnQgBAkDLgAAAVgAAAASZ2x5ZmAOz2cAAAFsAAABJGhlYWQOKih8AAACkAAAADZoaGVhCvgVwgAAAsgAAAAkaG10eCA6AAIAAALsAAAADGxvY2EAAARLAAAC%2BAAAABBtYXhwBIgEWQAAAwgAAAAgbmFtZXHR30MAAAMoAAACOXBvc3QDogHPAAAFZAAAACBwcmVwupWEAAAABYQAAAAHAAAGcgGQAAUAAAgACAAAAAAACAAIAAAAAAAAAQIAAAAAAAAAAAAAAAAAAAAAAAAAAAAAAAAAAAAAACAgICAAAAAo8AMGe%2F57AAAHPgGyAAAAAAACAAEAAQAAABQAAwABAAAAFAAEACgAAAAGAAQAAQACACgAKf%2F%2FAAAAKAAp%2F%2F%2F%2F2f%2FZAAEAAAAAAAAAAAFUAFYBAAAsAKgDgAAyAAcAAAACAAAAKgDVA1UAAwAHAAA1MxEjEyMRM9XVq4CAKgMr%2FQAC1QABAAD%2B0AIgBtAACQBNGAGwChCwA9SwAxCwAtSwChCwBdSwBRCwANSwAxCwBzywAhCwCDwAsAoQsAPUsAMQsAfUsAoQsAXUsAoQsADUsAMQsAI8sAcQsAg8MTAREAEzABEQASMAAZCQ%2FnABkJD%2BcALQ%2FZD%2BcAGQAnACcAGQ%2FnAAAQAA%2FtACIAbQAAkATRgBsAoQsAPUsAMQsALUsAoQsAXUsAUQsADUsAMQsAc8sAIQsAg8ALAKELAD1LADELAH1LAKELAF1LAKELAA1LADELACPLAHELAIPDEwARABIwAREAEzAAIg%2FnCQAZD%2BcJABkALQ%2FZD%2BcAGQAnACcAGQ%2FnAAAQAAAAEAAPW2NYFfDzz1AAMIAP%2F%2F%2F%2F%2FVre7u%2F%2F%2F%2F%2F9Wt7u4AAP7QA7cG0AAAAAoAAgABAAAAAAABAAAHPv5OAAAXcAAA%2F%2F4DtwABAAAAAAAAAAAAAAAAAAAAAwDVAAACIAAAAiAAAAAAAAAAAAAkAAAAowAAASQAAQAAAAMACgACAAAAAAACAIAEAAAAAAAEAABNAAAAAAAAABUBAgAAAAAAAAABAD4AAAAAAAAAAAACAA4APgAAAAAAAAADAFwATAAAAAAAAAAEAD4AqAAAAAAAAAAFABYA5gAAAAAAAAAGAB8A%2FAAAAAAAAAAIABwBGwABAAAAAAABAD4AAAABAAAAAAACAA4APgABAAAAAAADAFwATAABAAAAAAAEAD4AqAABAAAAAAAFABYA5gABAAAAAAAGAB8A%2FAABAAAAAAAIABwBGwADAAEECQABAD4AAAADAAEECQACAA4APgADAAEECQADAFwATAADAAEECQAEAD4AqAADAAEECQAFABYA5gADAAEECQAGAB8A%2FAADAAEECQAIABwBGwBSAG8AdQBuAGQAIABiAHIAYQBjAGsAZQB0AHMAIAB3AGkAdABoACAAYQBzAGMAZQBuAHQAIAAxADgANQA0AFIAZQBnAHUAbABhAHIATQBhAHQAaABzACAARgBvAHIAIABNAG8AcgBlACAAUgBvAHUAbgBkACAAYgByAGEAYwBrAGUAdABzACAAdwBpAHQAaAAgAGEAcwBjAGUAbgB0ACAAMQA4ADUANABSAG8AdQBuAGQAIABiAHIAYQBjAGsAZQB0AHMAIAB3AGkAdABoACAAYQBzAGMAZQBuAHQAIAAxADgANQA0AFYAZQByAHMAaQBvAG4AIAAyAC4AMFJvdW5kX2JyYWNrZXRzX3dpdGhfYXNjZW50XzE4NTQATQBhAHQAaABzACAARgBvAHIAIABNAG8AcgBlAAAAAAMAAAAAAAADnwHPAAAAAAAAAAAAAAAAAAAAAAAAAAC5B%2F8AAY2FAA%3D%3D)format('truetype')%3Bfont-weight%3Anormal%3Bfont-style%3Anormal%3B%7D%3C%2Fstyle%3E%3C%2Fdefs%3E%3Ctext%20font-family%3D%22Arial%22%20font-size%3D%2218%22%20text-anchor%3D%22middle%22%20x%3D%224.5%22%20y%3D%2247%22%3Es%3C%2Ftext%3E%3Ctext%20font-family%3D%22Arial%22%20font-size%3D%2213%22%20text-anchor%3D%22middle%22%20x%3D%2212.5%22%20y%3D%2252%22%3E2%3C%2Ftext%3E%3Ctext%20font-family%3D%22math1e5b166677791b8f78bf16bcf04%22%20font-size%3D%2218%22%20text-anchor%3D%22middle%22%20x%3D%2225.5%22%20y%3D%2247%22%3E%3D%3C%2Ftext%3E%3Cpolyline%20fill%3D%22none%22%20points%3D%2214%2C-59%2013%2C-59%206%2C0%202%2C-23%22%20stroke%3D%22%23000%22%20stroke-linecap%3D%22square%22%20stroke-width%3D%221%22%20transform%3D%22translate(35.5%2C62.5)%22%2F%3E%3Cpolyline%20fill%3D%22none%22%20points%3D%226%2C0%202%2C-23%201%2C-20%22%20stroke%3D%22%23000%22%20stroke-linecap%3D%22square%22%20stroke-width%3D%221%22%20transform%3D%22translate(35.5%2C62.5)%22%2F%3E%3Cline%20stroke%3D%22%23000%22%20stroke-linecap%3D%22square%22%20stroke-width%3D%221%22%20x1%3D%2249.5%22%20x2%3D%22146.5%22%20y1%3D%223.5%22%20y2%3D%223.5%22%2F%3E%3Cline%20stroke%3D%22%23000%22%20stroke-linecap%3D%22square%22%20stroke-width%3D%221%22%20x1%3D%2253.5%22%20x2%3D%22142.5%22%20y1%3D%2240.5%22%20y2%3D%2240.5%22%2F%3E%3Ctext%20font-family%3D%22math1e5b166677791b8f78bf16bcf04%22%20font-size%3D%2227%22%20text-anchor%3D%22middle%22%20x%3D%2267.5%22%20y%3D%2230%22%3E%26%23x2211%3B%3C%2Ftext%3E%3Ctext%20font-family%3D%22round_brackets18549f92a457f2409%22%20font-size%3D%2218%22%20text-anchor%3D%22middle%22%20x%3D%2288.5%22%20y%3D%2227%22%3E(%3C%2Ftext%3E%3Ctext%20font-family%3D%22round_brackets18549f92a457f2409%22%20font-size%3D%2218%22%20text-anchor%3D%22middle%22%20x%3D%22130.5%22%20y%3D%2227%22%3E)%3C%2Ftext%3E%3Ctext%20font-family%3D%22Arial%22%20font-size%3D%2218%22%20text-anchor%3D%22middle%22%20x%3D%2295.5%22%20y%3D%2227%22%3Ex%3C%2Ftext%3E%3Ctext%20font-family%3D%22math1e5b166677791b8f78bf16bcf04%22%20font-size%3D%2218%22%20text-anchor%3D%22middle%22%20x%3D%22109.5%22%20y%3D%2227%22%3E%26%23x2212%3B%3C%2Ftext%3E%3Ctext%20font-family%3D%22horizontalbf65417dcecc7f2b0006e%22%20font-size%3D%2213%22%20text-anchor%3D%22middle%22%20x%3D%22121.5%22%20y%3D%2218%22%3E%26%23x23AF%3B%3C%2Ftext%3E%3Ctext%20font-family%3D%22horizontalbf65417dcecc7f2b0006e%22%20font-size%3D%2213%22%20text-anchor%3D%22middle%22%20x%3D%22125.5%22%20y%3D%2218%22%3E%26%23x23AF%3B%3C%2Ftext%3E%3Ctext%20font-family%3D%22Arial%22%20font-size%3D%2218%22%20text-anchor%3D%22middle%22%20x%3D%22123.5%22%20y%3D%2227%22%3Ex%3C%2Ftext%3E%3Ctext%20font-family%3D%22Arial%22%20font-size%3D%2213%22%20text-anchor%3D%22middle%22%20x%3D%22137.5%22%20y%3D%2218%22%3E2%3C%2Ftext%3E%3Ctext%20font-family%3D%22Arial%22%20font-size%3D%2218%22%20text-anchor%3D%22middle%22%20x%3D%2284.5%22%20y%3D%2260%22%3En%3C%2Ftext%3E%3Ctext%20font-family%3D%22math1e5b166677791b8f78bf16bcf04%22%20font-size%3D%2218%22%20text-anchor%3D%22middle%22%20x%3D%2298.5%22%20y%3D%2260%22%3E%26%23x2212%3B%3C%2Ftext%3E%3Ctext%20font-family%3D%22Arial%22%20font-size%3D%2218%22%20text-anchor%3D%22middle%22%20x%3D%22113.5%22%20y%3D%2260%22%3E1%3C%2Ftext%3E%3Ctext%20font-family%3D%22math1e5b166677791b8f78bf16bcf04%22%20font-size%3D%2218%22%20text-anchor%3D%22middle%22%20x%3D%22156.5%22%20y%3D%2247%22%3E%3D%3C%2Ftext%3E%3Ctext%20font-family%3D%22Arial%22%20font-size%3D%2218%22%20text-anchor%3D%22middle%22%20x%3D%22171.5%22%20y%3D%2247%22%3E1%3C%2Ftext%3E%3Ctext%20font-family%3D%22math1e5b166677791b8f78bf16bcf04%22%20font-size%3D%2218%22%20text-anchor%3D%22middle%22%20x%3D%22179.5%22%20y%3D%2247%22%3E.%3C%2Ftext%3E%3Ctext%20font-family%3D%22Arial%22%20font-size%3D%2218%22%20text-anchor%3D%22middle%22%20x%3D%22192.5%22%20y%3D%2247%22%3E25%3C%2Ftext%3E%3C%2Fsvg%3E)
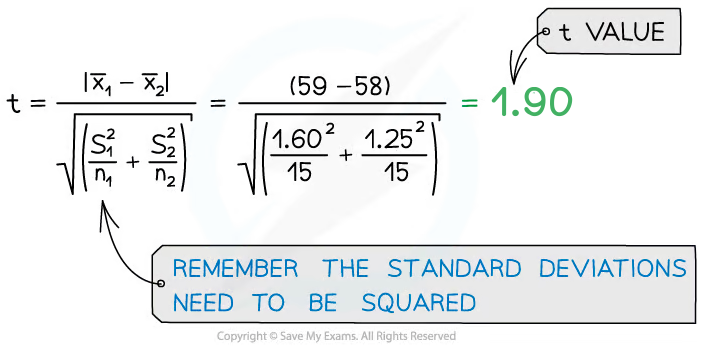
Step 3: Square the standard deviation and divide by n (the number of observations) in each sample, for both samples:
Step 4: Add the values from step 3 together and find the square root
Step 5: Divide the difference between the two means by the value from step 4
Population A | Population B |
|---|---|
x̄1 = 59 | x̄2 = 58 |
s1 = 1.60 | s2 = 1.25 |
n1 = 15 | n2 = 15 |
Step 6: Calculate the degrees of freedom (v) for all the data:
![]()
Step 7: Look at a table that relates t values to the probability that the difference between data sets is due to chance to find where the t value of 1.90 for 28 degrees of freedom (v) calculated lies
Degrees of freedom | Value of t | |||
|---|---|---|---|---|
28 | 1.70 | 2.05 | 2.76 | 3.67 |
Probability that chance would have produced this value of t | 0.1 | 0.05 | 0.01 | 0.001 |
Step 8: Draw a conclusion about the statistical relevance of the data
We are considering a confidence level of 0.05, corresponding to a critical value of at least 2.05. However, our t value is 1.90, less than the critical value. So the null hypothesis should be accepted
This means the null hypothesis should be accepted, as there are no significant differences between the two sets of results (any differences between the means of the ear length of rabbits in the two populations are due to chance)

Unlock more, it's free!
Join the 100,000+ Students that ❤️ Save My Exams
the (exam) results speak for themselves:

Was this revision note helpful?
