Growth Rate of Microorganisms (AQA A Level Biology): Revision Note
Exam code: 7402

Investigating growth rate using turbidity measurements
The population growth rate of microorganisms, such as bacteria or yeast, can be investigated by growing the microorganisms in a broth culture
The turbidity of the suspension can then be used as a way of estimating the number of cells (i.e. the population size) of the microorganisms in the broth culture
Turbidity is simply a measure of the cloudiness of a suspension (i.e. how much light can pass through it)
As the microorganisms in the broth culture reproduce and their population grows, the suspension becomes progressively more turbid (cloudy)
This changing turbidity can be monitored by measuring how much light can pass through the suspension at fixed time intervals after the initial inoculation of the nutrient broth with the microorganisms
A turbidity meter, a light sensor or a colorimeter (connected to a datalogger) can be used to take these measurements
The results can then be used to plot a population growth curve to show how the population of microorganism grew over time
Using logarithms when investigating bacteria
Bacterial colonies can grow at rapid rates when in culture, with very large numbers of bacteria produced within hours
Dealing with the experimental data relating to large numbers of bacteria can be difficult when using traditional linear scales
There is a wide range of very small and very large numbers
This makes it hard to work out a suitable scale for the axes of graphs
Logarithmic scales can be very useful when investigating bacteria
What is a logarithmic scale?
A log scale doesn't increase by equal amounts like 100, 200, 300
Instead, it increases by powers of 10:
102=100
103=1000
This allows large changes in data (e.g. population size) to be shown on a compressed axis
You can recognise a log scale because the intervals on the y-axis are not evenly spaced
Reading a log scale
Logarithmic scales allow a wide range of values to be shown on one graph
To read from the logarithmic scale, you should consider the following:
Identify the powers of 10 on the log scale
For example: 10¹ = 10, 10² = 100, 10³ = 1000
Check the spacing
On a log scale, the spacing between powers of 10 is even, but the actual numbers between them are not linear
This means 100 to 1000 is broken into log-based steps, not 200, 300, etc.
Estimate values between powers of 10
Use known log₁₀ values:
100 → log₁₀ = 2
320 → log₁₀ ≈ 2.5
1000 → log₁₀ = 3
For a value like 320, find the point halfway between 100 and 1000 on the log axis
Use a calculator for precision
Type log(value) into your calculator to find its position on the scale
E.g. log(320) ≈ 2.5, so it's slightly over halfway between 100 and 1000
Read carefully
Never assume even spacing = even number gaps
Always estimate based on logarithmic spacing
Example: reading a logarithmic scale
In this example, two graphs show population growth for a microbial population
The first uses a linear scale
The second uses a logarithmic scale
At 5 hours, the population size is 320
Annotations on each graph show how this reading was taken
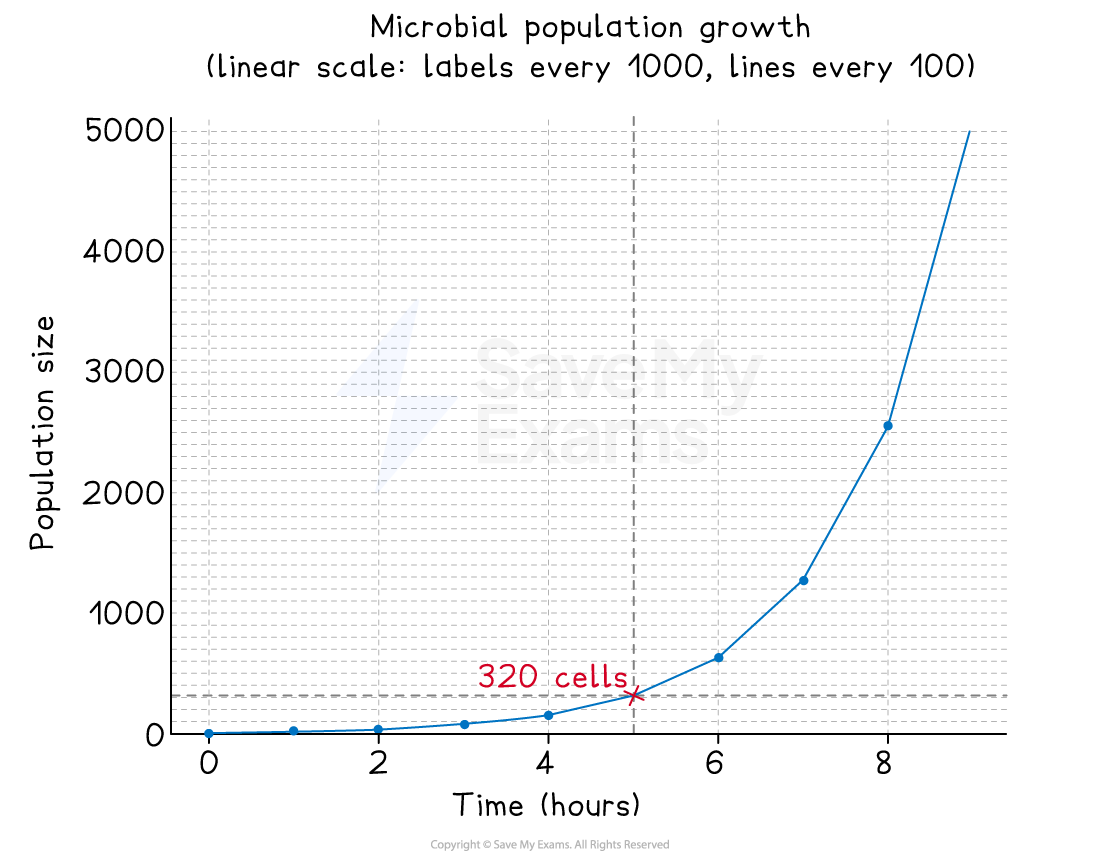
A linear graph used to show population growth. Annotations show the reading of population size at 5 hours.
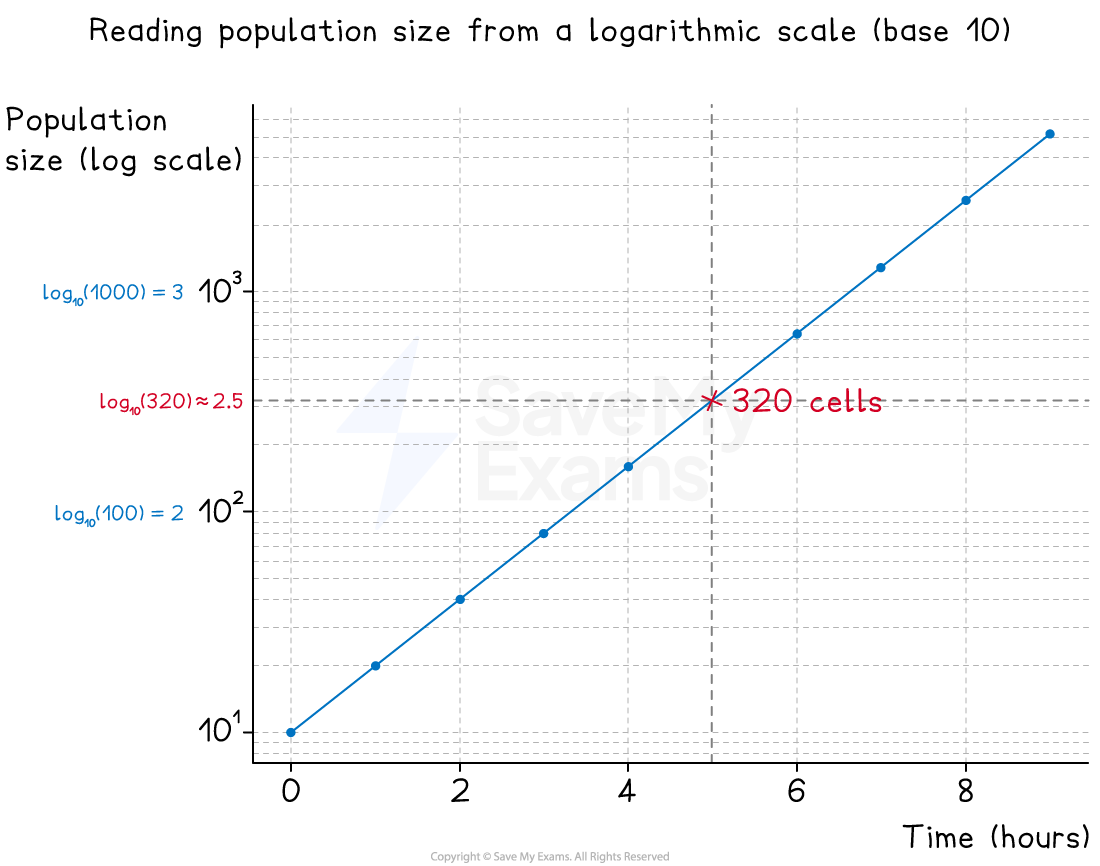
A log graph used to show population growth. Annotations show the reading of population size at 5 hours.
pH scales
The pH scale is logarithmic
The concentration of hydrogen ions varies massively between each pH level

Examiner Tips and Tricks
You won’t be expected to convert values into logarithms or create a log scale graph in the exam. Instead, you might be asked to interpret results that use logarithmic scales or explain the benefit of using one!
Remember that graphs with a logarithmic scale have uneven intervals between values on one or more axes.

Unlock more, it's free!
Join the 100,000+ Students that ❤️ Save My Exams
the (exam) results speak for themselves:

Was this revision note helpful?
